Full Length Research Paper

ABSTRACT
This study investigates the optimum water requirements of Sugarcane planted in different months under rainfall and irrigation management, using CROPWAT model at Finchaa Valley in view of the importance of efficient water use as a key to grow crops and satisfy water demand. Analysis of soil physical properties was performed following the standard field and laboratories procedures and methods. The result of investigation indicated that total and monthly crop (irrigation) water requirement of sugarcane varied with the first watering month, ranging from 1554.6 mm (764.5 mm) to 1677.8 mm (1090.9 mm) with the average value of 1614.45 mm (903.8 mm). per growing season The highest and lowest amount of both rainfall and irrigation water demands were obtained for the first watering month (from irrigation or rainfall) of May and August respectively. The finding of the study also implies that, irrespective of the planting and harvesting months’ irrigation water provision is not required in June, July and August months for sugarcane cultivated in Finchaa Valley under current climatic condition. Thus, applying fixed depth of irrigation water at a fixed frequency to different soil types throughout the growing season probably lower water use efficiency and reduce crop yield. It is recommended to use CROPWAT model for proper and effective irrigation scheduling for efficient use of available water and improved yields of sugarcane.
Key words: Sugarcane, first watering month, water requirement, CROPWAT model.
INTRODUCTION
Water is the primary input for plant growth and food production. There is a competition among water users as many different uses of water resources are interdependent. For instance, agricultural water use can be affected by other uses and it also affects other uses through competition and pollution, respectively (Cap-Net UNDP, 2018). Accurately, estimating the volume of water required at different growth stages for cultivated crops is very essential for efficient use of available finite water resources. Furthermore, the knowledge of water requirement of crops allows to get maximum yields through controlling over or under irrigation problems such as water logging or insufficient water at root zone, salinization of soil and water stress to plant which can reduce yields of crops (Michael, 1999; Savva and Freken, 2002; Katerji and Rana, 2008). Crop water requirements (CWR) include the total volume of water used in evapotranspiration. Doorenbos and Pruit (1992) defined crop water requirements as ‘the depth of water needed to meet the water loss through evapotranspiration of a crop, being disease-free, growing in large fields under non restricting soil conditions, including soil water and fertility, and achieving full production potential under the given growing environment’. Irrigation Water Requirements (IWR) refer to the water that must be supplied through the irrigation system to ensure that the crop receives its full crop water requirements.
A number of empirical, radiation based, energy budget, water balance, mass transfer and measurement based methods were developed around the world to determine crop water requirement ranging from the simplest and oldest Blaney Criddle method to the most recent and accurate FAO Penman-Montheith method and spatial analyzer GIS based method (Doorenbos and Pruit, 1992; Blaney-Criddle, 1950; Makkink, 1957; Priestly and Taylor, 1972; Allen et al., 1998; Thornthwaite, 1948; Hargreaves and Samani, 1985). Some of the most commonly used methods were Blaney-Criddle model (Burman and Pochop, 1994), Makkink model (Maged, 2017), Priestly-Taylor model (McNaughton and Jarvis, 1983; Cristea et al., 2012; Maged, 2017), Penman-Monteith-FAO-56 model (Abirdew et al., 2018; Shakeel et al., 2017), Thornthwaite model (Ahmadi and Fooladmand, 2008), and Hargreaves-Samani model (Feng et al., 2017).
According to Allen et al. (1998), the FAO Penman-Monteith method is now recommended as the sole standard method for the definition and calculation of the reference crop evapotranspiration. It has been found to be a method with a strong likelihood of correctly predicting ETo in a wide range of locations and climates. The method provides values that are more accurate and consistent with actual crop water use worldwide. In addition, the method has provisions for calculating ETo in cases where some of the climatic data are missing (Allen et al., 1998).
CROPWAT software, developed by FAO, is a computer program, which was based on the sole recommended FAO Penman-Monteith (FAO-PM) model for estimating crop and irrigation water requirement. In Finchaa Valley most of the land was covered by sugarcane plant due to the presence of a sugar factory in the valley. Therefore, the aim of this study is to determine rainfall water and irrigation water requirement of sugarcane planted in different months at Finchaa Valley, Western part of Ethiopia.
MATERIALS AND METHODS
Description of study area
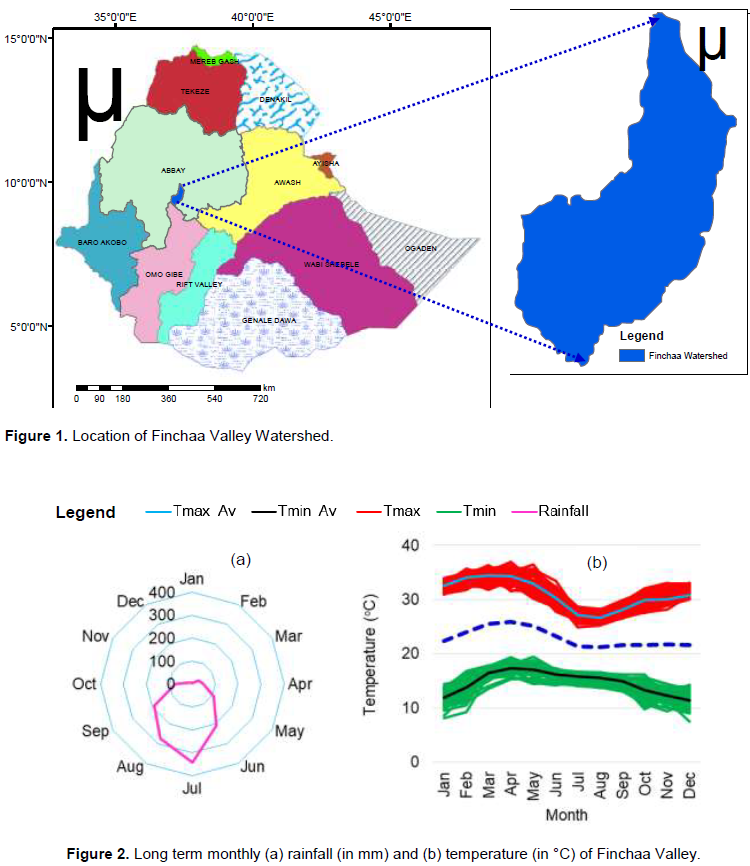
The Finchaa Valley is located in the Horro Guduru Wollega Zone of Oromia administrative regional state, at a distance of 350 km West-North Latitude and 70 km East-North Latitude of the Addis Ababa and Shambu, which is the capital city of Ethiopia and Horro Guduru Wollega zone, respectively. The study area positioned at coordinates of 9°30’ to 10°00’ North and 37°15’ to 37°30' East (Figure 1). It is a sub-basin of Blue Nile (Abbay) basin.
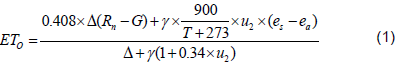
Major part of the land has slopes between 2 and 5%, there is no land with slopes less than 2%. Due to the topographic features of the project area, distribution of rain is very smooth and regular, easy to manage and adjust water distribution to crop requirement during cropping cycle. The average annual rainfall within the valley is about 1300 mm. The rains are more intense during the four rainy months of such that more than 80% of the rain falls during June to September period (Figure 2a).
As illustrated in Figure 2b, mean maximum air temperatures range from 26 to 34°C, the lowest prevailing between July and October. Average minimum air temperatures begin to decline around September and reach their lowest levels in December and January (about 11.5°C). The annual average relative humidity is around 84%. Monthly maximum average humidity varies from June to September (94-96%) to February to March (62-65%). The minimum relative humidity was observed from December to April.
Description of CROPWAT model
CROPWAT is a decision support system developed by the Land and Water Development Division of FAO for planning and management of irrigation. CROPWAT is meant as a practical tool to carry out standard calculations for reference evapotranspiration, crop water requirements and crop irrigation requirements, and more specifically the design and management of irrigation schemes. It allows the development of recommendations for improved irrigation practices, the planning of irrigation schedules under varying water supply conditions, and the assessment of production under rain fed conditions or deficit irrigation (Smith, 1992).
CROPWAT calculates daily reference evapotranspiration (ETo) from weather data according to the equation of FAO-PM (Allen et al., 1998) as presented in Equation 1.
where ETO: Reference evapotranspiration [mm day-1], Rn: Net radiation at the crop surface [MJ m-2 day-1], G: Soil heat flux density [MJ m-2 day-1], T Mean daily air temperature at 2 m height [°C], u2: Wind speed at 2 m height [m s-1], es: Saturation vapor pressure [kPa], ea: Actual vapor pressure [kPa], es - ea: Saturation vapor pressure deficit [kPa], D: Slope vapor pressure curve [kPa °C-1], and g: Psychometric constant [kPa °C-1].
Again, CROPWAT estimated crop evapotranspiration (ETc) or crop water requirement using crop coefficient according to Equation 2.

where ETc: Crop water Requirement (mm/day), ETO: Reference evapotranspiration [mm day-1], and Kc: Crop coefficient.
Further, CROPWAT model calculates irrigation water requirement (IWR) using Equation 3.

where IWR: Irrigation water requirement (mm/day), ETc: Crop water Requirement (mm/day), and Pe: Effective Rainfall (mm).
Input data and analysis
Basically, CROPWAT model requires four categories of input data. These are Climate data, Rainfall data, Crop data and Soil data. The first two data sets were collected for meteorological station located in the valley from Ethiopian National Meteorological Agency for 25 years. Whereas, the third data set was taken from CROPWAT FAO database. The fourth data set was collected by the researcher and analyzed using the standard procedures.
Climate data set
Climate data set was collected from the meteorological station of Finchaa Valley. This data set includes maximum and minimum temperature, humidity, wind speed and sunshine hours. These climatic data types are essential because CROPWAT depends on the to calculate Radiation and Reference evapotranspiration (ETo).
Rainfall data and analysis
Rain data were also collected from the meteorological station and analyzed for their quality. Station average and normal ratio methods
were used to fill the missing rainfall data based on Richard (1998) criteria. Similarly, double mass curve method was used to check the consistency and homogeneity of rainfall data and for adjustment of the inconsistent rainfall data. Then, it was inserted into CROPWAT software to obtain effective rainfall. Effective rainfall was computed using USDA soil conservation service method (USDA, 1997) and it is described in the Equations 4 and 5.
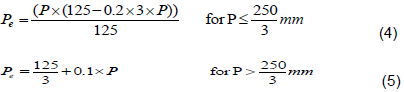
where P: Total Rainfall (mm) and Pe: Effective Rainfall (mm).
Crop data
The software needs some information about sugarcane crop. This information was obtained from CROPWAT FAO crop database for sugarcane crop, including crop name, planting date, harvesting date, crop coefficient (Kc), rooting depth, length of plant, growth stages, critical depletion and yield response factor.
Soil data and analysis
The software needs some general soil data like total available soil moisture, maximum rain infiltration rate, maximum rooting depth, initial soil moisture depletion and initial available soil moisture. This information was obtained through field and laboratorial procedures and recommendation manuals of Kamara and Haque (1991) and Sahlemedhin and Taye (2000). The analysis procedure detail of each soil physical properties was explained subsequently.
Soil samples were taken to analyze the soil texture, bulk density, field capacity (FC) and wilting point (PWP). The sampling points for the analysis of each parameter were spread over two sections/villages of Finchaa sugar estate farm, namely, village C and village Hora and three fields, P513, EPS-705 and G204. The soil of field number G204 and P513 was classified as Luvisols (L) and that of field number EPS-705 was classified as Vertisols (V) as obtained from soil map of the area (FSF, 2016).
Soil texture
To determine soil texture, six samples of disturbed soil were collected from the selected locations in the field and determined in the laboratory using mechanical analysis and textural triangle.
Bulk density
Bulk density and porosity of the study area was determined using twenty two undisturbed soil samples collected from six pits at different intervals starting from surface to a depth of 150 cm based on sugarcane root abundance with core samplers volume of 100 cm3 each. The samples were placed in an oven and dried at 105°C for 24 h. After drying, the soil and container were again weighed. The dry weight of the soil was divided by the sample volume to determine the dry bulk density.
Moisture content
Moisture contents at field capacity and wilting point were determined using twenty two disturbed soil samples collected from six sampling points at different intervals. Soil samples were soaked in water for one day and a pressure of 1/3 (for field capacity) and 15 bars (for permanent wilting point) were exerted in the laboratory using pressure plate apparatus until no further change in soil moisture content was observed for the determination of field capacity and permanent wilting point, respectively at the national soil laboratory center.
Water holding capacity
To determine the total available water (TAW, mm) in each soil layer, Equation 6 was used. TAW is the amount of water that a crop can extract from its root zone, and its magnitude depends on the type of soil and the rooting depth (Walker and Skogerboe, 1987; Allen et al., 1998).

where TAW: Total available water (mm), RZi: Depth of soil horizon i (cm), FCi: Gravimetric water content of soil horizon i at field capacity, PWPi: Gravimetric water content of soil horizon i at wilting point, and ρbi: Bulk density of soil horizon i (g/cm3).
Water requirement analysis
The crop water requirements (CWR) and irrigation water requirement (IWR) of the sugarcane planted in different months of the year or for different first watering months practiced at different fields in Finchaa Valley (Finchaa Sugar Estate irrigation system) were estimated by CROPWAT software for Windows Version 8.0.
The outputs were arranged and analyzed in seasonal, growth stage and monthly time scale as per their respective first watering month. The computation was done under two considerations. Firstly, sugarcane is a perennial crop having the growth length of 365 and more days (Ouda et al., 2016; MoANR, 2011). This indicates that fields first irrigated or watered in January will be harvested in December. Secondly, at Finchaa Valley, sugarcane is cultivated for the production of sugar and ethanol from the byproducts. This means, there is harvesting and planting (first watering) activities in all months to provide sugarcane for the factory for continuous sugar production.
Provided that, in each months of every year some portion of cultivated farms will be harvested and then after it can be either newly planted with seed pieces or stalk cuttings or the shoots grow from the buds on the underground part of the stubble left in the field and this crop is termed as ratoon crop. Therefore, the analysis of crop and irrigation water requirements were performed for sugarcane farms covered with ratoon canes in the twelve months of RESULTS
Soil properties of the study area
Bulk density and porosity
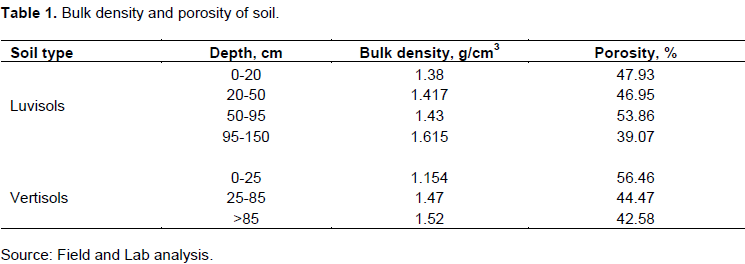
The bulk densities and porosity of the soils wereanalyzed for two major soil types (Luvisols and Vertisols). Due to the difference in abundance of sugarcane root in soils, analysis wasdone in four layers (0 - 20 cm, 20 - 50 cm, 50 - 95 cm and 90 - 150 cm) and three layers (0 - 25 cm, 25 - 85 cm and >85 cm) for Luvisols and Vertisols soil depth, respectively. The obtained bulk density of the upper layer of Luvisols is higher than the lower layer. This may be due to lower sprinkler operating pressure that causes the sealing of the surface soil because of the larger drop size produced (Table 1). the year, hereafter called first watering month.
Descriptive statistics such as mean, standard deviation, minimum, maximum and variance were calculated for soil, crop, rainfall and meteorological data with MS-Excel 2016. It was also used to draw different graphs and charts.
Water holding capacity
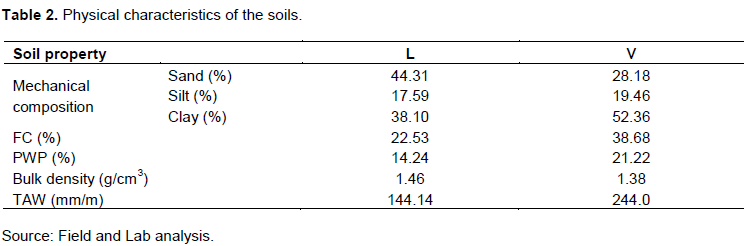
Another soil physical property important for CROPWAT model is the ability of soil to retain water which is so called, water holding capacity. The result of soil sample analysis indicated that the total available water content of the Luvisols and Vertisols was 144.14 and 244 mm per meter of soil depth respectively (Table 2). This shows that Vertisols store more water than Luvisols in Finchaa Valley. Thus, Luvisols has to be irrigated more frequently than Vertisols. Applying equal volume of water at similar rate leads to loss of water or deficiency of water.
Crop water requirement and irrigation water requirement
Seasonal crop water requirement and irrigation water requirement
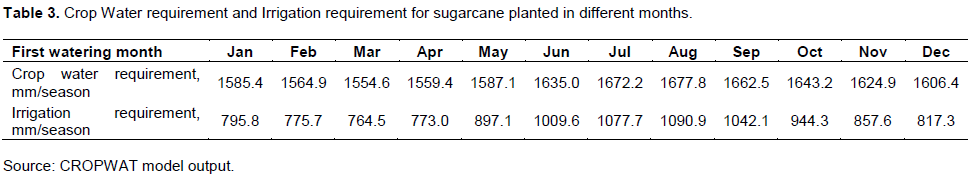
The obtained result revealed that the average seasonal water requirement of sugarcane planted in any months of the year in Finchaa Valley was 1614.45 mm. The maximum and minimum seasonal crop water requirements was 1677.8 and 1554.6 mm per season for sugarcane first watered in the month of August (harvested in July) and March (harvested in February), respectively (Figure 3).
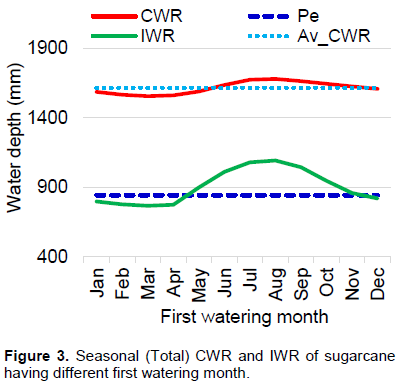
Further analysis showed that the total seasonal water requirements of ratoon sugarcane plants harvested in the months of November, December, January, February, March and April were less than the average of all first watering months’ total water requirements 1614.45 mm/season. Sugarcane harvested in the remaining months requires more water than the average demand in Finchaa Valley.
Interestingly, the result of the study highlighted that, the seasonal irrigation water requirements pattern followed the crop water requirement pattern as indicated in Figure 3. Seasonal total net irrigation water requirement of sugarcane in Finchaa Valley ranges from 764.5 to 1090.9 mm per season with average value of 903.8 mm/season (Table 3).
Growth stage crop water requirement and irrigation water requirement
As can be seen from the Table 4, the crop water requirement (ETc) of sugarcane reached peak value at mid growth stage for all crops harvested in any month.
Moreover, crop water requirement during initial and mid-season stage does not show significant change. However, it shows significant increase and decrease over time during crop development stage and late season stage, respectively.
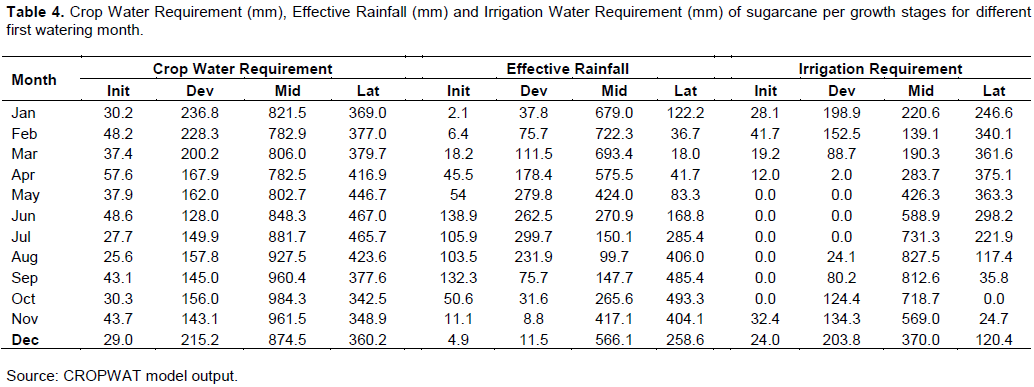
The result of the study further showed that, sugarcane that can be harvested in the months of November, December, January, February and March require less irrigation water than others. The reason is the overlap of peak effective rainfall and peak water demand of the crop. On the other hand, for the remaining months, particularly for the first watering month of August, September and October, due to the mismatch between water demand of sugarcane and availability of rainfall relatively, more irrigation is demanded.
Monthly crop water requirement and irrigation water requirement
The monthly water requirements and irrigation water requirements of sugarcane planted in different months of the year is presented in Figure 4. Figure 4 illustrates that monthly crop water demand and irrigation water requirement is varied with first watering month. The maximum monthly crop water requirement can be obtained in the month of March (197.3 mm/month) for sugarcane that can be harvested in the month of July every year under current climatic conditions of Finchaa Valley.
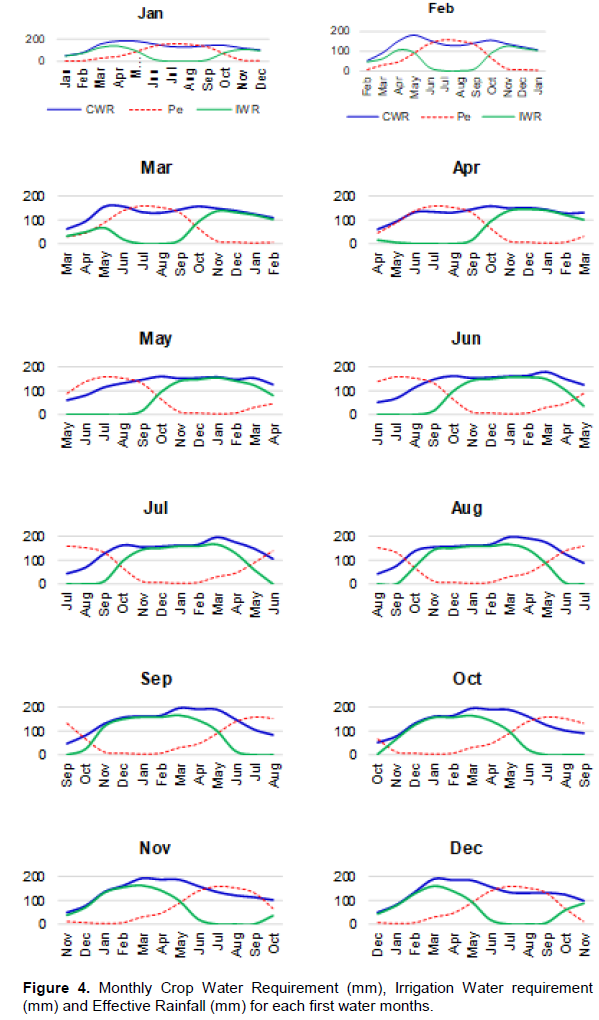
The result obtained also indicates that for all harvesting months or first watering months’ irrigation, water supply is not required in the months of June, July and August. The reason is that in these months’ crop, water demand is satisfied from rainfall only. However, the volume of water required for irrigation months is highly variable based on season of the year and water required by sugarcane as per growth stage.
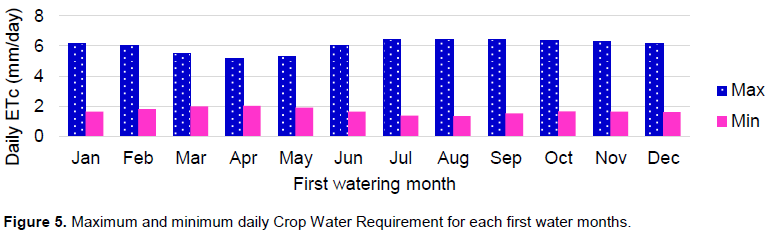
The finding of the current study also shows that, average daily water requirement of sugarcane crop cultivated in Finchaa Valley ranges from 1.35 to 6.42 mm/day. Figure 5 demonstrates the variation daily water requirements of sugarcane crop having a different first watering month or harvesting month. Maximum and minimum average daily water requirement can be reached in April and August months, respectively, both for sugarcane first watered in the month of August.
DISCUSSION
Analysis of the physical properties of soil samples indicated that there are two dominant soil types in Finchaa Valley, namely, Luvisols (Sandy-loam to Sandy-clay loam) and Vertisols (Clay). These soil types differ in their textural class and water holding capacity, which affects the irrigation depth, frequency and rate of water application. It possibly leads to poor irrigation water management. Lack of proper irrigation water management may enhance loss of fertilizers by leaching and parallel salinity and waterlogging of the soil. Pal and Yihenew (2018) concluded that, due to waterlogging of soil, there is a possible risk of considerable yield reduction which may affect the project’s economic viability.
The finding of the study shows that the sugarcane crop (ratoon) with 365 days growing period would require an average of 1614.45 mm of water per season. Of this, 44% can be obtained from effective portions of annual rainfall (841.2 mm) in Finchaa Valley. The remaining 56% (903.8 mm) would be supplemented from irrigation water sources. The obtained sugarcane water requirement was in the range of previous study which stated that depending on climate, water requirements (ETc) of sugarcane are 1500 to 2500 mm evenly distributed over the growing season (FAO Water, 2018; MoANR, 2011). The findings of the current study, however, differ from those of Win et al. (2014) and Bhingardeve et al. (2017) who stated that, on annual basis the average water requirements of sugarcane as 1369.84 and 1135.5 mm using lysimeter and pan evaporation methods, respectively. This is may be due the difference in methods used and location of the study area.
The result of the analysis shows that, on annual basis, the total water requirements of sugarcane harvested in different months of the same year is not equal. For instance, the difference between seasonal water requirement of sugarcane harvested in July and February months was 123.2 mm. This difference indicates that sugarcane first watered in the month of August and harvested in July can demand 123.2 mm (1232 m3) of water more than sugarcane first watered in March and harvested in February month per a single hectare of cultivated land. This may allow to bring more areas under irrigation and leads to increased sugarcane yields (MoANR, 2011). Furthermore, the finding of this study shows that, irrigation water requirement of sugarcane also varies from month to month and with growth stages for different first watering months (Win et al., 2014). This may highly affect the irrigation schedule (depth of application, irrigation period and irrigation interval) and efficiency of water use. In other words, applying uniform depth of water with fixed interval at all growth stages of sugarcane crop harvested in different months of the year may lead to a shortage of water and loss or excess application of irrigation water. Particularly, this type of irrigation schedule causes moisture stress to the crop during the early stage and post-harvest, when rapid and light irrigation of soil profile is necessary since the root is shallow, due to larger irrigation interval. Therefore, the quantity of water applied and the interval of irrigation must be adjusted to the actual water requirement of the crop, the water-holding capacity of the soil and rooting depth (MoANR, 2011).
In addition, applying fixed depth of irrigation water at constant frequency to the soils (Luvisols and Vertisols) having quite different textural classes and water retaining and absorbing capacities may result in excess of water application in turn leading to wastage or low efficiency and some side effects like rising of water table level and accumulation of unwanted water on the soil surface which may reduce crop yield and cause outbreak of malaria disease in vicinity area unless adequate drainage system is provided.
In general, the most significant implication of the current study is that proper irrigation scheduling as per soil water holding capacity, crop water demand based on growth stages (especially, during critical stages of water requirement of sugarcane crop, that is, vegetative period of sugarcane is the most critical stage, particularly during period of tillering and stem elongation as it is yield formation stage) for efficient use of available water and improved yield.
CONCLUSION
This study has shown that seasonal and monthly crop water requirement and irrigation water requirement of sugarcane vary with growth stages, harvesting and first watering month. Applying fixed amount of irrigation water at a fixed frequency throughout the growing season to soils having different water holding capacities possibly lower water use efficiency and decline yield and make irrigation scheduling more complex in terms of practicability and probably incur additional cost. However, it is suggested that to use CROPWAT model for proper and effective scheduling of sugarcane irrigation practices. The current study has only been examined for ratoon (regrow) sugarcane using the present weather data of Finchaa Valley. Therefore, it is further suggested that a future study investigating impacts of climate change on sugarcane water and irrigation requirements would be very interesting.
CONFLICT OF INTERESTS
The author has not declared any conflict of interests.
REFERENCES
|
Abirdew S, Mamo G, Mengesha M (2018). Determination of Crop Water Requirements for Maize in Abshege Woreda, Gurage Zone, Ethiopia. Journal of Earth Science and Climatic Change 9:439. |
|
|
Ahmadi SH, Fooladmand HR (2008). Spatially distributed monthly reference evapotranspiration derived from the calibration of Thornthwaite equation: a case study, south of Iran. Irrigation Science 26:303-312. |
|
|
Allen RG, Pereira LS, Raes D, Smith M (1998). Crop evapotranspiration. Guidelines for computing crop water requirements. FAO Irrigation and Drainage. Paper No. 56. FAO, Rome. |
|
|
Blaney HF, Criddle WD (1950). Determining water requirements in irrigated areas from climatological and irrigation data. USDA Soil Conservation Service SCS-TP96. 44 p. |
|
|
Burman R, Pochop LO (1994). Evaporation, evapotranspiration and climatic data. Developments in Atmospheric Science, 22. Elsevier, Amsterdam. |
|
|
Cap-Net UNDP (2018). Tutorial on Basic Principles of Integrated Water Resource Management. |
|
|
Cristea NC, Kampf SK, Burges SJ (2012). Revised coefficients for Priestley-Taylor and Makkink-Hansen equations for estimating daily reference evapotranspiration. Journal of Hydrologic Engineering 18:1289-1300. |
|
|
Doorenbos J, Pruitt WO (1992). Crop water requirements. FAO Irrigation and Drainage. Paper No.24. (reprinted) FAO, Rome. |
|
|
FAO Water Development and Management Unit (2018). Crop water information: Sugarcane. |
|
|
Feng Y, Jia Y, Cui N, Zhao L, Li C and Gong D (2017). Calibration of Hargreaves model for reference evapotranspiration estimation in Sichuan basin of southwest China. Agricultrall Water Management 181:1-9. |
|
|
Finchaa Sugar Factory (FSF) (2016). Finchaa Sugar Factory, Irrigation and Drainage, soil map of Finchaa Valley. |
|
|
Hargreaves GL, Samani ZA (1985). Reference crop evapotranspiration from temperature. Applied Engineering in Agriculture 1(2):96-99. |
|
|
Kamara CS, Haque I (1991). Soil Physics Manual. Working Document No.B12 Soil science & Plant Nutrition Section: International Livestock Center for Africa. Addis Abeba, Ethiopia. |
|
|
Katerji N, Rana G (2008). Crop evapotranspiration measurement and estimation in the Mediterranean region, INRA-CRA, Bari. ISBN 978 8 89015 2412. |
|
|
Maged MA (2017). Evaporation and Evaluation of Seven Estimation Methods: Results from Brullus Lake, North of Nile Delta, Egypt. Hydrology. 5(4):58-66. |
|
|
Makkink GF (1957). Testing the Penman formula by means of lysimeters. Journal of the Institution of Water Engineers and Scientists 11:277-288. |
|
|
McNaughton KG, Jarvis PG (1983). Predicting effects of vegetation changes on transpiration and evaporation. In: Kozlowski TT (Ed.) Water Deficits and Plant Growth 7:1-47. |
|
|
Michael AM (1999). Irrigation: Theory and Practice. Vikas Publishing House, New Delhi, India. pp 530-539. |
|
|
MoANR (2011). Guideline on Irrigation Agronomy. Published by Natural Resources Management Directorate, Natural Resource Sector and the Ministry of Agriculture, Ethiopia with the of Deutsche Gesellschaft für Internationale Zusammenarbeit (GIZ) GmbH. Addis Ababa, Ethiopia, pp:241 |
|
|
Ouda S, El-lalif AK, Khalil F (2016). Water Requirements for major crops. Springer brief in water science and technology. |
|
|
Pal D, Yihenew G (2018). Soil physicochemical properties and their significance for sustainable sugarcane production in Kesem Allaideghe plains irrigation project area, Eastern Ethiopia. Ethiopian Journal of Science and Technology 11(1):19-28. |
|
|
Priestley CHB, Taylor RJ (1972). On the assessment of surface heat flux and evaporation using large scale parameters. Monthly Weather Reviews 100:81-92. |
|
|
Richard HM (1998). Hydrologic Analysis and Design. Department of Civil Engineering University of Maryland, Prentice Hall Upper Saddle River, New Jersey 07458, 2nd Edition. |
|
|
Sahlemedhin S, Taye B (2000). Procedures for Soil and Plant Analysis. National Soil Research Center. Ethiopian Agricultural Research Organization. Technical Report No. 74. Addis Abeba Ethiopia. |
|
|
Savva PA, Freken K (2002). Irrigation Manual: Crop Water Requirement and Irrigation Scheduling. FAO, Sub-regional office for east and southern Africa (SAFR), Fontline Electronic publishing, Harare, Zimbabwe. ISBN: 0-7974-2316-8. |
|
|
Shakeel AB, Pandit BA, Khan JN, Kumar R, Rehana J (2017). Water Requirements and Irrigation Scheduling of Maize Crop using CROPWAT Model. International Journal of Current Microbiology and Applied Science 6(11):1662-1670. |
|
|
Smith M (1992). CROPWAT, a computer program for irrigation planning and management. FAO Irrigation and Drainage Paper 46, FAO, Rome. |
|
|
Thornthwaite CW (1948). An approach toward a rational classification of climate. Geographical Review 38(1):55-94. |
|
|
United States Department of Agriculture (USDA), (1997). Natural Resources Conservation National Engineering Handbook, Irrigation Guide, Natural Resource Conservation Service, Washington DC, 754 p. |
|
|
Walker WR, Skogerboe GV (1987). Surface irrigation. Theory and practice. Prentice Hall, Inc. Englewood Cliffs, New Jersey, USA 386 p. |
|
Copyright © 2024 Author(s) retain the copyright of this article.
This article is published under the terms of the Creative Commons Attribution License 4.0


