Full Length Research Paper

ABSTRACT
This study was conducted to identify and understand the current level of canal water conveyance and on-farm water application efficiency of Lemchek-Sewur small-scale irrigation scheme in Ethiopia. The water conveyance efficiency of canals was determined by estimating discharge at different segments. On-farm water application efficiency was evaluated from the amount of water actually applied and from soil moisture measurements. Primary data were collected through flow measurement, transect walk, household surveys and group discussions, whereas secondary data were collected from different sources. Microsoft Excels and Geographic Information System software were used to analyze the data. The mean values of water conveyance efficiency of main, secondary and tertiary canals were 86.17, 86.26 and 55.97%, respectively. Mean value of the overall on-field water application efficiency was 53.13%. Generally, the performance of the irrigation scheme was poor mainly due to illegal water abstraction, sedimentation of canals and inadequate operation and maintenance provisions. Therefore, adequate maintenance and suitable management approaches are required to improve the irrigation system performance.
Key words: Lemchek-Sewur SSI scheme, conveyance efficiency, application efficiency, evaluation, Ethiopia.
INTRODUCTION
Water is a valuable resource for agricultural production. Scarcity or misuse of water resources poses serious and growing threats to life and sustainable development. The irrigated agriculture faces number of difficult problems. One of the major concerns is poor efficiency pertaining to misuse of water resources in irrigation practices. To make irrigation projects economically and environmentally sustainable, water users need to improve agricultural productivity, which requires change in their institutional structures, water use management systems and policies, improve service delivery systems, and proper farmland management (Gebremeskel and Mekonen, 2014).
Most of the expansion in irrigated area in the past occurred through capital investments in infrastructure for capture, storage and distribution of water. The increased availability of irrigation and less dependency on rain fed agriculture is one of the means to increase food production.
Performance of many irrigation schemes is significantly below their potential due to a number of shortcomings, including poor design, construction, operation, maintenance, and ineffective water control and measurement structure (Degirmenci et al., 2003). Water is a natural resource of strategic importance, which directly affects economic and social development. As competition for water increases, the irrigation sector is often blamed for high and inefficient use of water and commonly held responsible for urban water shortages.
The efficient, equitable and dependable delivery of water and the efficient and uniform application of water to the fields are as important as increasing irrigated area. Therefore, it is necessary to determine water conveyance loss in irrigation canals and in field water application so that economic and operational performance of the systems may be improved.
The competition for irrigation water use among the upstream and downstream irrigation units in Lemcheck-Sewur Small Scale Irrigation (SSI) scheme is very high due to on-farm and off-farm water distribution problems. The irrigation system infrastructure in the scheme lacks the capacity to deliver irrigation water, has problems of operating gates and maintenance of canals, management gaps, water scarcity, poor water management, siltation, flooding and erosion. The critical problem is frequent water related conflicts resulting from unregulated and incorrect allocation of irrigation water. Water User Association (WUA) of the scheme is too weak to manage the system in a sustainable manner. The evaluation of the irrigation scheme performance is of paramount importance not only to point out where the problem lies, but also to identify alternative management options that may be effective and feasible in improving irrigation scheme performance. Therefore, the present study was conducted for Lemechek-Sewer SSI scheme with the following objectives.
Objectives
The objectives of the performance study for Lemechek-Sewer SSI scheme are:
(1) To investigate the situation of existing irrigation practices
(2) To assess canals conveyance and on-farm water application efficiency
(3) To identify the performance gaps and suggest remedial measures.
LITERATURE REVIEW
Ethiopia has abundant rainfall and water resources, but its agricultural system does not yet fully benefit from the technologies of water management and irrigation (Awulachew et al., 2010). The country is presently committing huge investments to develop irrigation infrastructure with the aim to enhance agricultural production but little attention is given to the existing performance of the irrigation schemes. Ayana and Awulachew (2009) and Awulachew and Ayana (2011) studied the performance of different irrigation schemes in Ethiopia and observed that the performance of the existing irrigation schemes are low due to poor operation and maintenance services, problems related to improper planning and design, and lack of incentive for proper management of water in state-run projects. The small-scale irrigation schemes are operated and managed by the water users themselves with little involvement of government agencies. According to Bos et al. (1994), the performance assessment evaluates the existing situation of irrigation performance, identifies the constraints to proper performance, and implements management interventions to improve the performance. Jureins et al. (2001) proposed common efficiency terms for irrigation system evaluation such as application efficiency, conveyance efficiency, distribution uniformity, storage efficiency, runoff ratio, and deep percolation ratio. However, most of the water losses in seepage, deep percolation and runoff are considered by water conveyance and water application efficiencies. Walker (1989) proposed guidelines for design and evaluation of surface irrigation systems. The proposed value of water conveyance efficiency for lined canal was 95%. Whereas, the value for unlined canals varied from 60 to 90% depending on the soil and canal length. Sisay et al. (2009) studied the effect of water management practices on crop productivity for SSI schemes in Blue Nile command in Ethiopia and reported water conveyance losses as 2.58 l/s/100 m for average water flow rate of 43 l/s. The water application efficiency for design and evaluation of surface irrigation system varied from 55 to 70% (Walker, 1989).
The water conveyance losses in different canal and water application efficiency in field water application were studied by different workers in different conditions and different conclusions were drawn. However, such studies for Lemchek-Sewur SSI scheme are yet to be conducted.
MATERIALS AND METHODS
Description of study areas
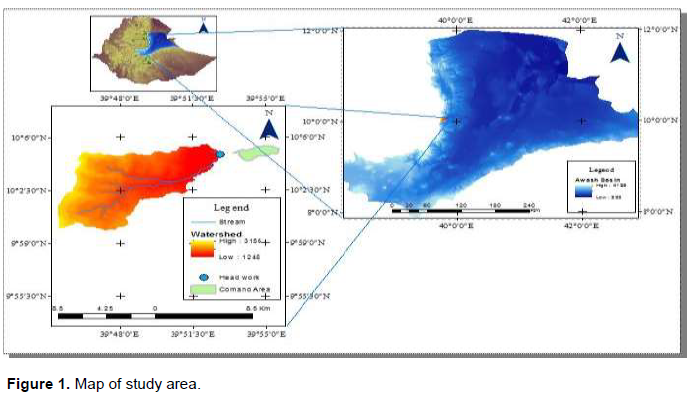
Lemchek-Sewursmall-SSI scheme is an intake irrigation project, located in Yelen-Wacho Kebele, Kewet Woreda in North Shewa Zone of the Amhara region, Ethiopia. The study area is located at 10° 4' 51.6" N Latitude and 39° 53' 13.2" E longitude at about 1245 m.a.s.l. The total commend area of the project is 180 ha. In traditional agro ecological classification system, the project area is located in Kolaagro ecologic zone. The map of the study area is as shown in Figure 1.
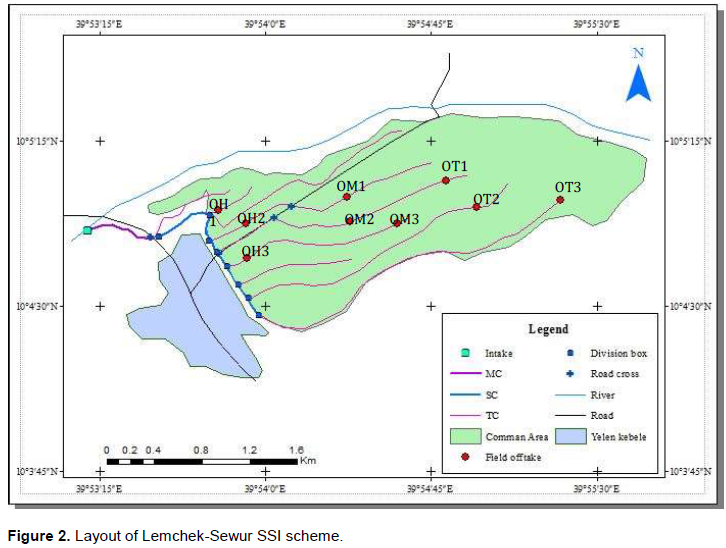
Water for the scheme is supplied from an intake structure on the Sewer River. The primary contour canal on the right side of the river course is 1.6 km long. The secondary canal is 1.761 km long and leads water from the main canal into the command area, running down the slope. Nine tertiary canals of total length of 5.516 km run on contours, serve standard size irrigated plots by means of field ditches. Surface drains remove surplus irrigation water and runoff from rainfall. The slope of the main canal ranges from 0.29 to 0.49%, whereas that of the command area slope ranges from 2 to 4%. The irrigation scheme was constructed in 2012 by Bureau of Water Resource Development (BoWRD), with a total investment cost of 7.1 million ETB for its life span of about 20 years. The irrigation scheme has total of 720 household beneficiaries. Farmers are organized in compulsory WUA, which collect fees for maintenance of the canals and formulate bylaws. The layout of Lemchek-Sewur SSI scheme is as shown in Figure 2.
Climate of study area
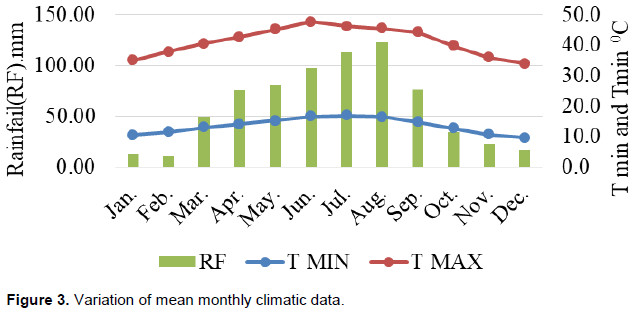
The mean monthly minimum temperature (Tmin) in the study area varies from 9.6°C in December to 16.9°C in July with yearly average value of 13.5°C. Similarly, the mean monthly maximum temperature (Tmax) varies from 24.3°C in December to 31.0°C in June with yearly average value of 27.7°C. The rainfall distribution in the study areas is ‘unimodal’ rainfall pattern. The main rainy season is from July to early September. The mean annual rainfall (RF) in the study area is 712 mm. The graphical variation of mean monthly climatic data is as shown in Figure 3.
Crops grown in study area
Lemchek-Sewur SSI project is one of the modern irrigation projects in north Shewa zone of Ethiopia dominated by annual food crops. Cereal crops such as teff, sorghum, and maize cover the major part of the area followed by vegetable crops such as onion, cabbage, pepper and tomato and pulse crops such as mung bean.
Method of data collection
The research was carried out from October to December 2016 as large numbers of fields are irrigated during the period. The data collection was done with the Development Agent assigned by the Agricultural Office. The primary data were collected by direct field measurements. Such data were discharge measurements, filed observations, and measurement of soil physical properties. The secondary data were collected from agricultural and rural development office and National Meteorological Service Agency. Such data were climatic data, crop data, actual command areas and designed features of the scheme.
Discharge measurement
Synthetic propeller type current meter and Parshall flume (3” size) were used for discharge measurement of main, secondary and tertiary canals and field off takes. The current meter was used for measurement of water flow for main and secondary canals. The main and secondary canals were rectangular and lined with masonry. The tertiary canals were trapezoidal and unlined. The current meter measured the velocity of water flow using Equation 1.
V=k × n + ⧠(1)
where n = number of propeller rotation per second, V = the flow velocity of the water, in cm/s, and
k and ⧠= coefficient of synthetic propeller type current meter.
The values of k and ⧠depend on number of propeller rotation per second (n). Substituting corresponding values of k and ⧠for different range of n, Equation 1 may be expressed by Equations 2 to 4.
V = 31.17 × n + 1.93, if 0.00 < n< 1.98 (2)
V = 32.05 × n + 0.19, if 1.98 < n < 10.27 (3)
V = 33.44 × n - 14.09, if 10.27 < n < 15. (4)
The depths of the water flow in the main and secondary canals were less than 60 cm. Therefore, the water flow velocity in these canals with current meter was measured at depth equal to 0.6 d, where d was depth of water flow in the canal. The discharge for the main and secondary canal was calculated as the multiple of cross-sectional area and water flow velocity.
Parshall flume was used to measure discharge from tertiary canal and field offtakes using Equation 5 for free flow condition.
Q = k h1n (5)
where Q = flow rate in m3/s, h1 = upstream water flow depth in the converging inlet section, in m, k = free flow coefficient, and n = free flow exponent.
The value of the constant of k and exponent n for Parshall flume (3” size) and for metric units were 0.1771 and 1.55, respectively (Gertrudys, 2006).
Method of data analysis
Soil analysis
Soil samples were collected from different locations at 0-30 and 30-60 cm soil depths to determine particle size distribution (soil texture), bulk density and soil moisture content before and 24 h after irrigation. Bulk density was determined using the core sampler. Particle size distribution was determined using mechanical analysis and the soil texture was determined using the USDA Soil Textural Triangle. The soil moisture content was estimated using gravimetric method.
Estimation of water conveyance efficiency
The water conveyance efficiency and water losses main secondary and tertiary canals were estimated by measuring inflow and outflow for the selected canal reaches. The inflow and outflow were measured at nine points at an interval of 200 m for main canal and at eight points at an interval of 250 m for secondary canal. The measurements for tertiary canals were made at initial and final points at head, middle and tail reaches. The discharge measurements were made twice a day for 30 min each time for four irrigation events. The average values of inflow and out flows for all measurements for each of the selected canal segment were used for the estimation of water conveyance losses and water conveyance efficiency using Equation 6.
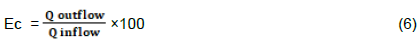
where Ec = water conveyance efficiency (%), Q outflow = amount of water outflow, and Q inflow = amount of water inflow.
Estimation of on-farm water application efficiency
The required data for the estimation of on-farm water application efficiency were collected from nine farmers’ fields in the command area of the scheme, three each from the head reach (FH1, FH2 and FH3), middle reach (FM1, FM2 and FM3), and tail reach (FT1, FT2 and FT3). The crop grown in selected fields was onion at full development stage of crop growth. There were 21 numbers of furrows in each field. Three representative furrows were selected from each of the nine selected fields at the head, middle and tail reaches using systematic sampling method. Soil samples were taken before and 24 h after irrigation from 0-30 and 30-60 cm soil depths from each of the selected furrow. The actual amount of the water applied into each furrows was measured using Parshall flume (3” size). The on-farm water application efficiency was calculated using Equation 7.

where Ea = water application efficiency (%), ws = depth of water stored in crop root zone soil profile, and wn = depth of water applied to the field.
The depth of water stored in crop root zone soil profile (ws) was estimated using Equation 8.
where ws = depth of water stored in crop root zone soil profile (cm), Wf = moisture content of ith soil layer 24 h after irrigation on oven dry weight basis (%), Wi = moisture content of ith soil layer before irrigation on oven dry weight basis (%), ρi = apparent specific gravity of the ith soil layer ( g/cm3), Di = depth of ith soil layer (cm), i = integer, 1 to n and n =number of soil layers in the crop root zone.
The moisture content of the collected soil samples before and after irrigation was determined using gravimetric method as expressed by Equation 9.

Where W = soil moisture content on oven dry weight basis (%), Ww = wet weight of the soil (g), and Wd = oven dry weight of the soil (g)
RESULTS AND DISCUSSION
Water conveyance efficiency
The water conveyance efficiency was estimated using Equation 6 for each measurement at each selected location along the main canal, tertiary canal and offtake.
Main canal water conveyance efficiency
The estimated average value of inflow, outflow, water conveyance efficiency and water conveyance losses for different sections of the main canal are shown in Table 1. The water conveyance efficiency for main canal varied from 77 to 96.6% with average value of 86.2%. The values of conveyance efficiency were different for each canal section. The measurements for replication 2 were made after the maintenance of the main canal. Therefore, the values of water conveyance efficiency for replication 2 in some of the reaches were higher as compared to the values for replication 1. The water conveyance losses per 100 m length varied from 1.43 l/s/100 m to 20.35 l/s/100 m with average value equal to 10.57 l/s/100 m.
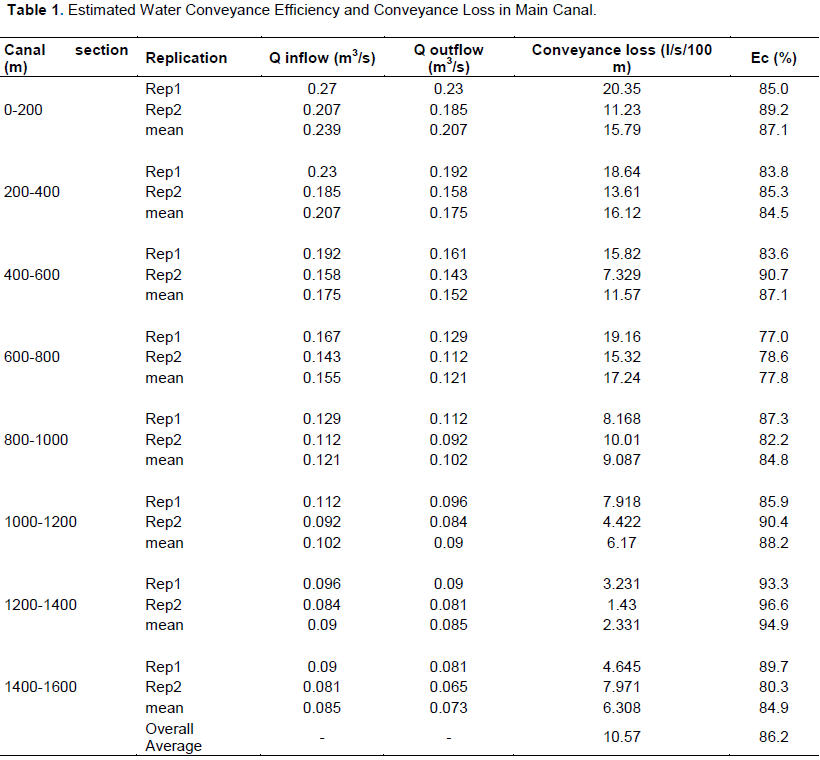
The water conveyance efficiency was the lowest for canal section at 600 to 800 m. The water conveyance losses per 100 m canal length were also the highest equal to 19.16 l/s/100 m for this canal section. This indicates the priority of maintenance in this section as compared to other sections of the main canal. The reasons for high water conveyance losses were nonfunction of flow control gates, unauthorized water turnouts, breaching of main canals and illegal water abstractions for domestic purpose. This inefficient conveyance affected the equity of water distribution throughout the systems, particularly, the tail users did not get their equitable share of water.
Secondary canal water conveyance efficiency
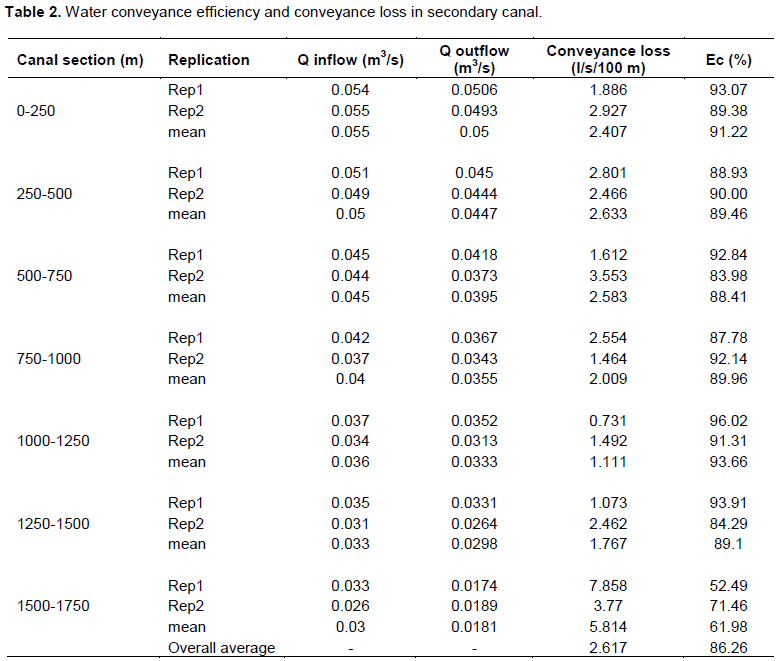
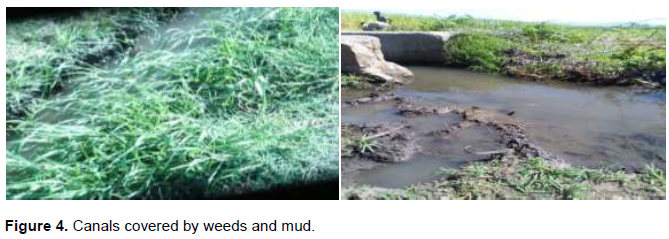
The estimated average values of inflow, outflow, water conveyance efficiency and water conveyance losses for different section of the secondary canal are shown in Table 2. The water conveyance efficiency for secondary canal varied from 52.49 to 96.02% with average value equal to 86.26%. The water conveyance losses per 100 m length of secondary canal varied from 0.731 l/s/100 m to 7.858 l/s/100 m with average value equal to 2.617 l/s/100 m. The lowest values of water conveyance efficiency was observed for canal section at 1500 to 1750 m. Reason being this section was highly cracked which caused high seepage and leakage losses. It was observed during the field visit that the water was leaking from different locations, wherever, canal was breached. The measurements for replication 2 were done after the maintenance of the secondary canal. Therefore, the values of conveyance efficiency for second replication in some of the cases were higher as compared to replication 1. The major reasons for high water conveyance losses in the secondary canal of the scheme were generally improper construction, canals silting with weeds and soils, cracked sections and broken parts at different places, canals under design with smaller cross sectional area which resulted in water overflow, sides and beds of the canal were greatly damaged by scouring due to steep bed slope, absence of drop structures and flow control structures (Figure 4).
Tertiary canals water conveyance efficiency
The tertiary canals in the study area received water from secondary canal through offtakes and delivered the irrigation water to the field ditches. The following problems were observed in tertiary canals before and during the actual evaluation activities.
(1) The physical conditions of some of the tertiary canal structures were not as per designed specifications. The sidewalls were eroded (width was widened) and plants/grasses were growing in the canals. The canal bed slope was also causing backflow when sufficient water was not supplied in the canals. In some of the tertiary canals, there was siltation problem, which decreased water flow depth and widened canal widths (Figure 5).
(2) Seepage from canal sidewalls along the canal length and leakage from offtake points were predominant in the area and it was difficult to be measured.
(3) Operational losses were also observed.
(4) Dead storage was formed at different points inside the canals along the length of the canal, which facilitated irrigation water loss via evaporation and deep percolation.
(5) Overtopping from canals due to releasing of excess water which caused damage to field crops.
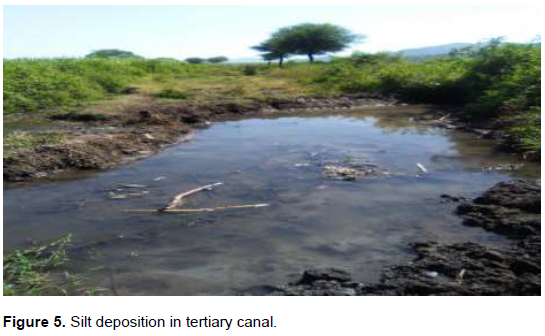
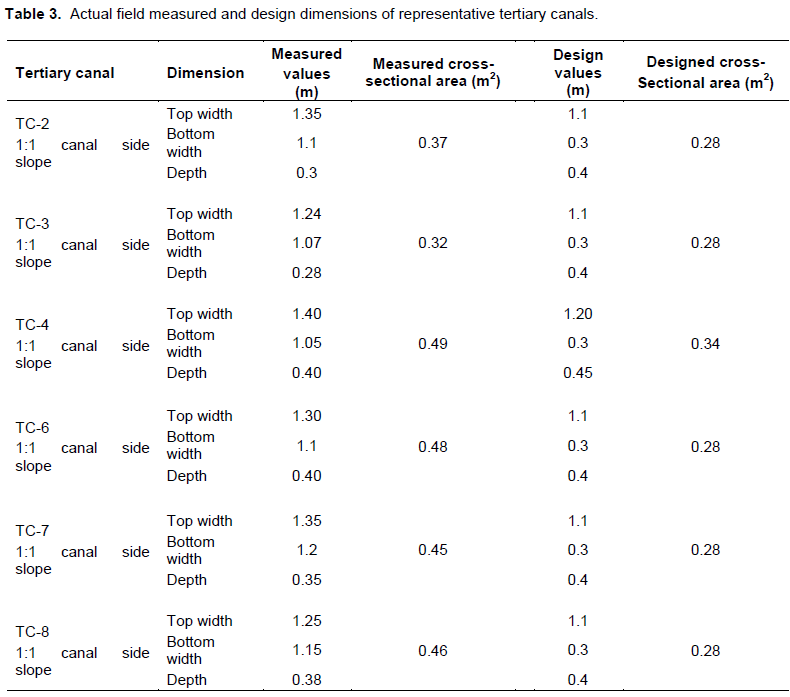
Tertiary canal dimensions: The designed and actual field measured values of different dimensions of the tertiary canals are shown in Table 3. The measured value of canal depth varied from 28 to 40 cm, whereas the designed values varied from 40 to 45 cm. The actually measured values of the depth of tertiary canals were smaller than the designed values. It might be due to siltation problems which resulted from canals side erosion and from sediment particles brought into canals with irrigation water (Figure 5). The measured values for bottom width and top width varied from 105 cm to 120 and 124 to 140 cm, respectively. Whereas the design values were 30 and 110 to 120 cm, respectively. The actual values of bottom width and top width were more than the designed values. Similarly, the actual canal cross-section area was also more than the design values. This might have occurred because of unsafe canal cleaning, canal erosions due to repeated excess water flow above free board level, damage by domestic animals and overtopping at some canal banks.
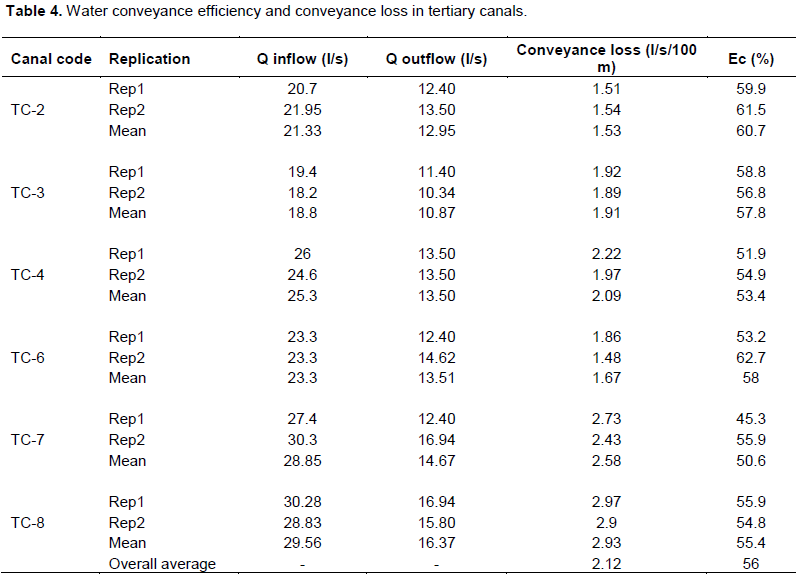
Tertiary canals water conveyance efficiency: The estimated values of inflow, outflow, water conveyance efficiency and water losses for different selected tertiary canals are shown in Table 4. The estimated value of water conveyance efficiency for the tertiary canals varied from 45.3 to 62.7% with average value of 56%. The water conveyance losses for different tertiary canals varied from 1.48 to 2.97 l/s/100 m with average value equal to 2.12 l/s/100 m. The highest mean conveyance efficiency of the tertiary canal for both replication was 60.7% for tertiary canal-2 and the lower mean efficiency was 50.6% for the tertiary canal-7. This indicates that the tertiary canal TC-7 had priority of maintenance. Tertiary canal TC-2 having the highest mean value for both replications equal to 60.7% can be considered as better canal as compared to other tertiary canals. The measurements for replication 2 were taken after canal cleaning and maintenances. The water conveyance efficiency was comparatively lower and thus water seepage losses were comparatively higher for the tertiary canals as compared to main and secondary canals. Efficient water saving can be achieved by keeping the conveyance losses to minimum. In this study, large amount of water was lost in conveyance during its route up to the farms. The main reasons for these conveyance losses in watercourses were leakages from turnouts, high density of vegetation in the unlined watercourses, turns in the watercourse, weak banks broken by domestic animals, siltation, holes made by rodents or boars and lack of maintenance.
On-farm water application efficiency (Ea)
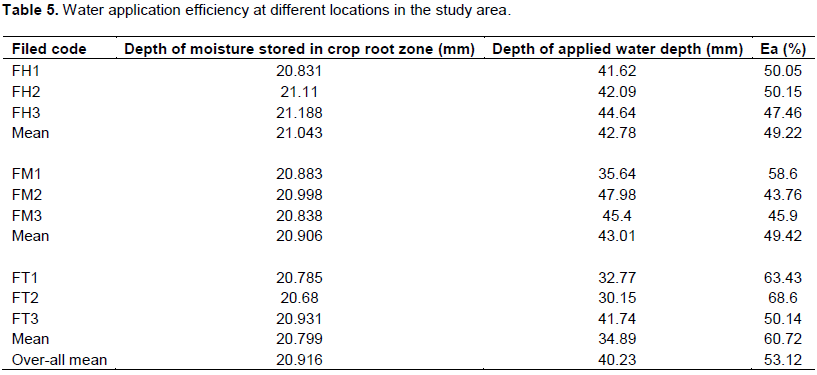
The on-farm water application efficiency for the nine-selected farmers fields, three each at head, middle and tail reach were estimated by the measured water application depth and soil moisture content before and 24 h after irrigation for each of the selected furrow using Equations 6 to 8. The estimated average values of the water application efficiency at different location are shown in Table 5. The water application efficiency varied from 43.76 to 68.60% with over-all average value equal to 53.12%. The lowest application efficiency equal to 43.76% was for field FM2. Reason being that the furrows at location FM2 were not blocked at lower end which resulted in huge runoff loss. The furrows at other locations were blocked at lower ends and thus no runoff at lower ends of the furrows was allowed. Generally, farmers in Ethiopia used blocked furrows. The reach wise mean values of the application efficiency were 49.22, 49.42, and 60.72% for head, middle, and tail reach, respectively. The reach-wise mean value of application efficiency increased from head reach to tail reach. Thus, the farmers at head and middle reach were getting more water and applying the water less efficiently as compared to the farmers at tail reach. The deep percolation losses at head and middle reach were higher as compared to tail reach. The farmers at tail reach were getting less water and thus most of the applied irrigation water was stored in the crop root zone. The other factor of low application efficiency at the head and middle reach was high soil moisture contents in the soil as compared to the tail water users. The main factors which contributed to the low application efficiency in the irrigation systems were poor irrigation system design, poor irrigation system management, non-existent of water measuring and control structures, inadequate maintenance of schedules and non-existent of scientific irrigation scheduling.
RECOMMEDATIONS
The following recommendations weredrawn from the performance evaluation studies of the Lemchek-Sewur SSI scheme:
(1) The water allocation should be planned based on predetermined and designed cropping pattern and irrigation scheduling. Water delivered to the fields should be measured and systems should be established to estimate crop evapotranspiration to determine the amount of irrigation water to be applied. Farmers may be provided trainings on water management and irrigation practices to avoid any undesirable impacts of irrigation such as water logging and salt accumulation.
(2) Water User Association (WUA) of the scheme was not well organized and it has management target gaps. Reforming and training WUA is important for ensuring better management of the irrigation scheme. The organization needs to improve irrigation water use, distribute water equitably, resolve conflicts between users and manage system sustainability. Introducing and adopting the new proclamations IWUAs No. 84/2014 of Irrigation Water Users Associations (IWUAs), for beneficiaries and related stakeholders is very important.
(3) Canals, especially tertiary canals require continuous maintenance to keep them free from weeds and reduce the deposition of silt. Continuous removal of sedimentation, preventing large logs and debris throwing into the canal, constructing water control structure across the canal and canal bank protection are some of the necessary activities. Therefore, WUA and the beneficiaries’ farmers should work together in coordination with each other.
(4) Putting formal way of fee collection and utilizing the collected money for maintenance work are relevant to increase farmers participation. Charging the farmers as per amount of water supplied may be examined.
(5) The farmers in Ethiopia generally use furrow irrigation blocked at lower ends. The technology for proper design and operation for the irrigation system especially suitable for Ethiopian conditions may be developed to minimize deep percolation losses and improve on-farm water application efficiency.
(6) Providing water storage structures and enhancing diversion capacity of the scheme might be vital for improving an adequate and reliable supply of irrigation water. The hydraulic characteristics of flow control structures at offtakes play a vital role in water distribution and delivery. Therefore, installation of proportional division structures at offtakes will improve water delivery equity.
(7) Providing water balancing reservoirs in the canal command area to stabilize canal water supply may be examined.
CONFLICT OF INTERESTS
The author has not declared any conflict of interests.
REFERENCES
|
Awulachew SB, Ayana M (2011). Performance of irrigation: An assessment at different scales in Ethiopia. Experimental Agriculture 47(S1):57-69. |
|
|
Awulachew SB, Erkossa T, Namara RE (2010). Irrigation Potential in Ethiopia-Constraints and Opportunities for Enhancing the System, International Water management Institute. P 59. |
|
|
Ayana M, Awulachew SB (2009). Assessment of the performance of selected irrigation Schemes in Ethiopia. Journal of Applied Irrigation Science 44(1):121-142. |
|
|
Bos MG, Murray-Rust DH, Merrey DJ, Johnson HG, Snellen WB (1994). Methodologies for assessing performance of irrigation and drainage management. Irrigation and Drainage Systems 7(4):231-261. |
|
|
Degirmenci H, Buyukcangaz H, Kuscu H (2003). Assessment of irrigation schemes with comparative indicators in the Southeastern Anatolia Project. Turkish Journal of Agriculture and Forestry 27(5):293-303. dergipark.gov.tr/.../178542 |
|
|
Gertrudys BA (2006). Flow measurement devices. Division of water rights, Utah government, |
|
|
Sisay D, Katrin D, Amare H, Tilahun A (2009). Irrigation Water Productivity as Affected By Water Management in a Small-Scale Irrigation Scheme in the Blue Nile Basin, Ethiopia (Unpulished). |
|
|
Walker WR (1989). Guidelines for Designing and Evaluating of surface Irrigation System: FAO Irrigation and Drainage paper. Food and Agriculture Organization, Rome 45:137. |
|
Copyright © 2024 Author(s) retain the copyright of this article.
This article is published under the terms of the Creative Commons Attribution License 4.0


