ABSTRACT
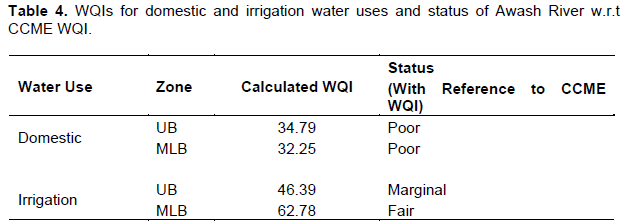
Awash river has been impaired by various types of pollution owing to waste released from different socio-economic activities in its basin. This research was aimed at evaluating its quality status with respect to drinking and irrigation water uses. Based on accessibility and land use severity, 23 sample sites were chosen along the river and sampling was done twice in each of the dry and wet seasons. Thereafter, both onsite and offsite water quality analyses were undertaken following standard procedures. Canadian Council of Ministers of Environment Water Quality Index (CCME WQI) was applied to compute the water quality indices. Accordingly, the drinking and irrigation water quality indices of the upper basin were found to be 34.79 and 46.39 respectively, which were in the poor and marginal categories of the Canadian water quality ranking. Meanwhile, the respective indices for the middle/lower basin, which were 32.25 and 62.78, which lie in the poor and fair ranges of the ranking. Although the difference in the dataset used for the two cases and natural purification in the course of the river might contribute to the difference in WQI, it is generally conceivable that the water quality of the river is below the good rank. Establishment of wastewater treatment plants and storm water quality management at hotspot areas are recommended to improve the quality.
Key words: Awash river basin, Canadian Council of Ministers of Environment Water Quality Index (CCME WQI), drinking and irrigation water uses, Ethiopia, water pollution.
Water quality problems are caused by natural and anthropogenic factors. The most important of the natural influences are geological, hydrological and climatic since these affect both the quantity and the quality of water available (Bartram and Ballance, 1996; Pejman et al., 2009; Bu et al., 2010). Their impact is magnified especially when water scarcity is observed and maximum use is expected to be made of the limited resource, which is exemplified by a frequently high salinity problem in arid and coastal areas (Bartram and Ballance, 1996), like that of Awash River Basin. The impact of human activities on water quality is versatile in the degree to which it disrupts the ecosystem and restricts its use. These activities have usually affected water quality through either point sources such as wastewater treatment facilities or non-point sources such as runoff from urban areas and farm lands (Bartram and Ballance, 1996).
The impact of water pollution is seen on human-being who have been directly or indirectly consuming the contaminated water like Awash River. Irrigation water quality depends mainly on permeability (Hussain et al., 2010; Bauder et al., 2011). Permeability affects infiltration rate of water into the soil and is determined by the relative concentrations of salinity (Electrical conductivity (EC)) and sodicity. Sodicity is a measure of the relative amount of Na to Ca and Mg which gives an indication of the level at which the exchangeable Na percentage of the soil will stabilize after prolonged irrigation (Holmes, 1996). Alkalinity, on the other hand, is a measure of water’s capacity of neutralizing acid and is expressed by Residual Sodium Carbonate (RSC). Alkaline water causes iron deficiency by increasing the pH of soil to unacceptable level. Drinking water quality determinants are broadly classified into physical (such as taste, odor and color), microbial (viruses, protozoa, helminths, total coliform (TC) bacteria, Escherichia coli (ECo)) and chemical (BOD, COD, F-, NO3-, Fe, Cu, Ca, PO42-, Cr, and others) (Sorlini et al., 2013; WHO, 2011; Amenu, 2014).
Most people living in the rural parts of Ethiopia rely on water from unprotected sources such as rivers which are unsafe to drink and Awash river is no exception. As a result, more than half a million people die each year from water-related diseases, mostly infants and children (Halcrow, 2008). Natural water constituents such as fluorides and inputs of socio-economic activities such as pesticides, herbicides, heavy metals and pollution from industrial effluents and domestic wastes are also threats to the water resources (Halcrow, 2009).
Although water quality problem is apparent to most Ethiopian Rivers, Awash leads in the extent of impairment due to its service as a sink for the basin-wide urban, industrial and rural wastes (Belay, 2009; Alemayehu, 2001). In assessing the pollution level of the river, it is concluded that attention needs to be paid in irrigating with the river for fear of public health effect. This is confirmed by examining the bacteriological contaminant level of leafy vegetables grown around Adama town with Awash River along with identifying heavy pollution loads on the vegetables (Benti et al., 2014).
Additionally, heavy helminths, bacteriological pollution load, toxicity level and the slight to moderate salinity effects of the Little Akaki River, which is a tributary of Awash river, made it unfit for any intended use (Taddese et al., 2004). According to this study, nitrate level of the river water is above 10 mg/L and mean concentration of heavy metals including Mn, Cr, Ni, Pb, As and Zn are reported to be more in soils and vegetables irrigated by Awash River than their allowable limits. The incidences of dental and skeletal fluorosis from the high concentration of fluoride are found to exist in its valleys (Reimann et al., 2003).
Evaluation and communication of quality status of the River to water quality professionals and the policy makers is needed to safeguard the public health and the environment. Having such a study, which is non-existent for Awash River, ultimately contributes towards quantification and understanding of the status of the River water and ultimately enables decision makers to have ample information so as to suggest if the water is suitable for intended uses. This study aims at evaluating the overall status of Awash River water quality in the upper and downstream sub-basins based on Water Quality Index (WQI) calculated for selected parameters relative to the irrigation and drinking water uses.
There are various ways of determining WQI although most indices measure the same attributes of deviation from the objectives (Wills and Irvine, 1996). Some of them being used worldwide are: National Sanitation Foundation (NSF) WQI (Kaurish and Younos, 2007), Canadian Council of Ministers of the Environment (CCME) WQI (Worako, 2015), Overall Water Quality Index (OWQI) and Oregon WQI (Tyagi et al., 2013; CCME, 2001b; Poonam et al., 2015). Though NSF WQI (Wills and Irvine, 1996; Tyagi et al., 2013; Poonam et al., 2015), CCME WQI and OWQI (Singh et al., 2015) are indices frequently used for water quality assessment, CCME WQI is the most efficient and flexible with respect to the type and number of water quality variables to be tested, the period of application, and the type of water body. OWQI is efficient but parameters should be carefully selected depending on the source and time. The main drawback of NSF WQI is the eclipsing effect, due to which one or more parameters that have values above permissible limit are masked if the rest of the parameters are within the limits (Poonam et al., 2015). Oregon WQI aids in the assessment only of water quality for general recreational uses and is designed only for Oregon streams (Cude, 2001; Tyagi et al., 2013).
Description of the study area
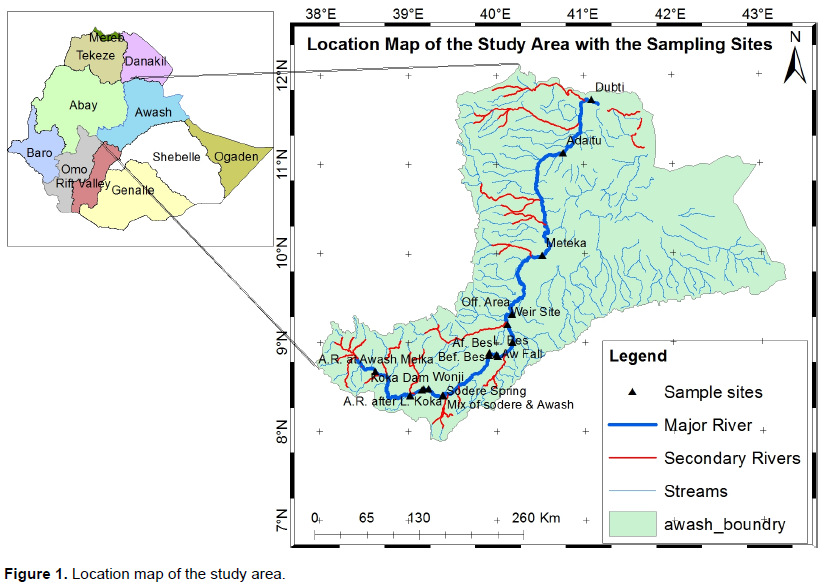
Awash River Basin, with a total catchment area of 113,304 km2, is located between latitudes 7°53′N and 12°N and longitudes 37°57′E and 43°25′E in Ethiopia (Figure 1). The Awash River originates from the high plateau Ginchi of 3000 m.a.s.l, 80 km west of Addis Ababa and terminates, after travelling about 1200 km, at Lake Abe of 250 m.a.s.l., at the border of Ethiopia and Djibouti (Tessema, 2011; Berhe et al., 2013; Degefu et al., 2013). With extreme ranges of topography, vegetation, rainfall, temperature and soils, the basin extends from semi-desert lowlands to cold high mountain zones. Land use in the catchment is mainly agricultural and shrub lands used for rain-fed crops, irrigation and grazing. Various crops are cultivated ranging from cereals, vegetables, flowers, cotton to perennial fruit trees and sugarcane (Tessema, 2011; Gedion, 2009). Although the relative surface water resource of the basin is about 4.65 billion m3, it is the most developed and utilized since 77.4% of the irrigable land in the basin has been cultivated. About 60% of the large-scale irrigated agriculture and more than 65% of the national industries are located in the basin. The rainfall pattern is bimodal with the first being the short season of March to May while the second and the main one is from July to September (Tessema, 2011). Annual average temperature ranges from 16.7 to 29°C and the annual mean relative humidity in the basin varies from 60.2 to 49.7%. While the mean annual wind speed is 0.9 m/s, the mean annual rainfall varies from about 1600 mm at Ankober to 160 mm at Asayita (Berhe et al., 2013).
Data collection, quality control and validation
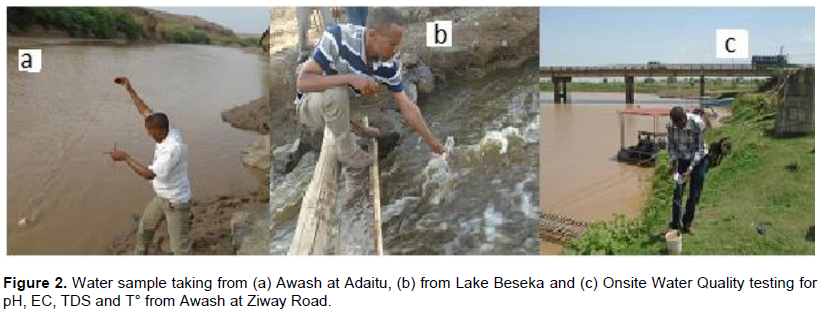
The sampling process has been designed adequately to decide the exact number, sites and time at which the samples were taken. This was done to attain representativeness of the samples. Multi-parameter (HANNA HI 991300) onsite water quality testing meter, GPS, digital camera, plastic sample containers, plaster, long rope, sample fetching plastic vessel, and ice box were some of the materials taken to the field. Sampling was done in four phases, twice in each of the dry (February 2016 and January 2017) and wet seasons (May 2015 and June 2016). In all the phases, grab samples of water have been taken from 13 sites: three of them in the lower and ten in the middle basin. These were chosen based on accessibility and types of land use (agricultural, urban and industrial) found in the catchment. Samples were taken in triplicate from midpoint (vertically and laterally) of the river by using plastic vessel tied with long rope. Thereafter, samples were collected in polyethylene plastic bottles rinsed with distilled water both for onsite testing and laboratory analyses as shown in Figure 2. All samples for offsite analyses were kept at 4°C in a refrigerator until further use.
When samples were collected, transported, and preserved from the field, quality control (QC) procedures were followed to produce quality data with respect to precision and accuracy. Therefore, field QC samples such as equipment blank and trip blanks were collected to test the presence or absence of errors occurring in the field according to Zhang (2007) procedures. The QC samples that were used for assuring quality during laboratory analysis were duplicates (to know the analytical precision) and blanks (to identify any potential contamination).
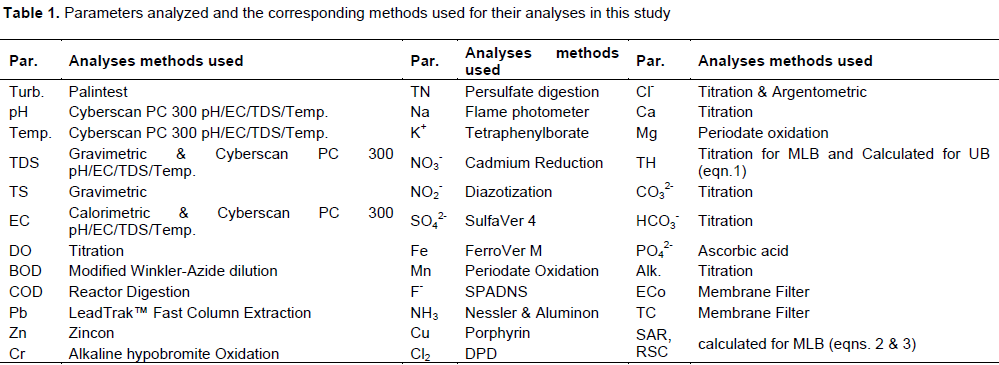
EC and total dissolved solids (TDS) were analyzed on site using the HANNA meter (Figure 2) since they would otherwise have changed during storage and transport while the offsite analyses of water quality parameters of interest were conducted using standard methods for examination of water and wastewater (APHA, 1998). Since the River is being used mainly for irrigation and domestic uses in the basin, parameters such as Turbidity (Turb.), Temperature (Temp.), TDS, Total Solids (TS), Total Hardness (TH), Total Nitrogen (TN), ECo, TC, Alkalinity (Alk.), NH3, EC, DO, BOD, COD, Na+, Ca2+, Mg2+, F-, Cl-, NO2-, NO3-, CO32-, HCO3-, and PO42- were considered for analysis. The parameters analyzed and methods used for their analyses in this study are illustrated in Table 1.
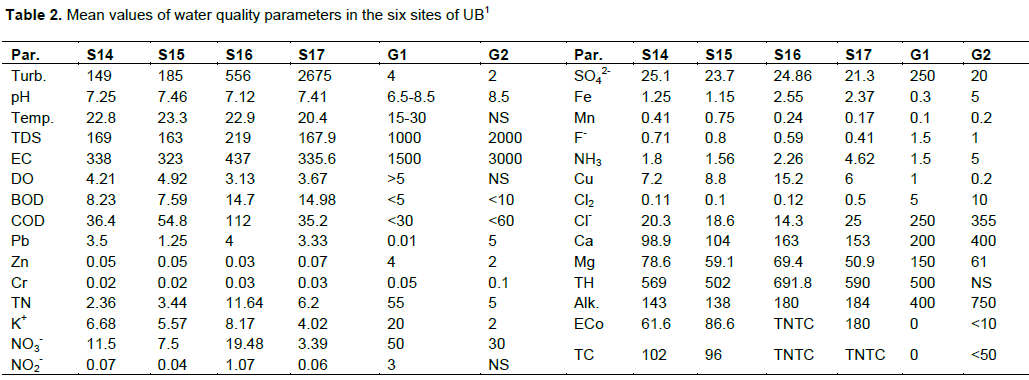
Water quality analysis for the upper basin (UB) was done by Vitens Evides International Granting Organization of Netherlands together with Oromia Regional Water Office of Ethiopia in seven rounds at about 2.5 months’ interval between 26/06/2014 and 30/11/2015. They considered ten sample sites of which only six sites of interest and only those parameters having full data in all the sites were selected. Since a lot of samples were taken from each site, a number of parameters were considered and the choice of sampling sites was strategic enough; this dataset was preferably used for computation of WQI in the sub-basin. There were missing and censored values in the UB water quality dataset marked as ‘x’, ‘?’, ‘empty’, ‘nil’, ‘<R’ and ‘TNTC’ and were validated by ignoring from calculation of the mean and appropriate substitution. Dixon test, which is based on the ratio of the distance between the potential outlier value and its nearest value to the range of the whole data set (Rangeti et al., 2015), was used to detect the outliers observed in the dataset. Accordingly, out of the selected 28 variables, only turbidity showed outlier at the 17th site.
Since only concentrations of Ca2+ and Mg2+ were given for the UB, TH indicated in Table 2 was computed as the concentrations of Ca2+ and Mg2+ expressed as equivalent of CaCO3 (Lenntech, 2014) by using equation (1):
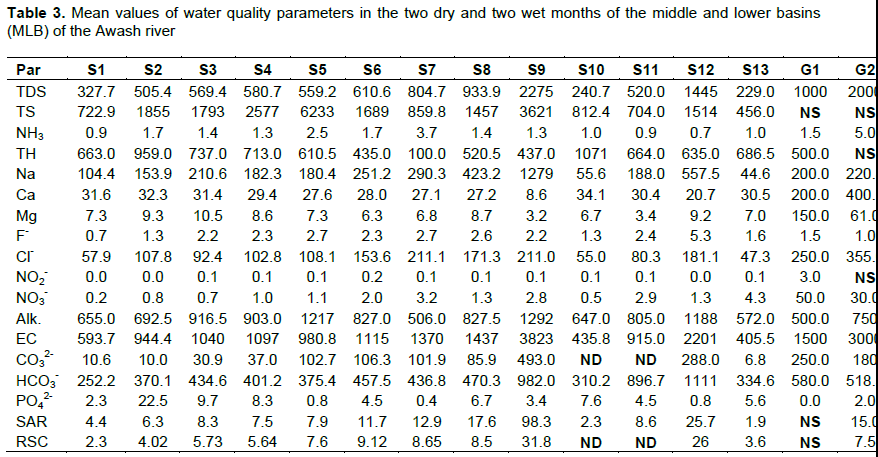
Soil sodicity, which is expressed by a ratio called Sodium Adsorption Ratio (SAR) and depicted in Table 3, could be calculated from the major cations by using equation (2) (Lesch and Suarez, 2009; Seid and Genanew, 2013; Hussain et al., 2010). Other chemical index of irrigation water quality importance such as RSC was also calculated from the measured water quality parameters by the formulas (3) (Dinka, 2016). The cations and anions, which were expressed in mg/L, were all changed into mili-equivalents per liter (meq/L)

which represents a suitable sodium hazard index for typical irrigation water. However, the guideline of SAR for irrigation, according to Ayers and Westcot (1985), is dependent on the concentration of salinity, which is severely restricted if EC and TDS exceed 3 dS/m and 2000 mg/L respectively since it affects crop water availability. The other chemical index of irrigation water quality importance such as RSC was also calculated from the measured water quality parameters by using equation (3) (Dinka, 2016). The cations and anions, which were expressed in mg/L, were all changed into mili-equivalents per liter (meq/L).
According to Dinka (2016), RSC >7.5 is unfit, 5.0 to 7.5 is poor, 2.5 to 5.0 is marginal, 0 to 2.5 is fit, and < 0 is very good for irrigation.
Water quality indices (WQI)
WQI practically describes the problem of pollution in a water body and is used to represent measurements of bulk of water quality data in a single number, combines various measurements of different units in a single metric, and facilitates communication of results (CCME, 2001b). It is a very reliable and efï¬cient way for evaluating water quality relative to its desirable state. It also modifies policies thereby developing tools to decide suitability of water sources for their intended use and makes suggestions for a more efficient water resources and River basin management by formulating pollution control strategies (Gibrilla et al., 2011; Barceló-Quintal et al., 2013; Tyagi et al., 2013; Sargaonkar and Deshpande, 2003; CCME, 2001a). Awash River water quality status was evaluated using CCME WQI due to its efficiency and flexibility.
Conceptual framework of CCME WQI
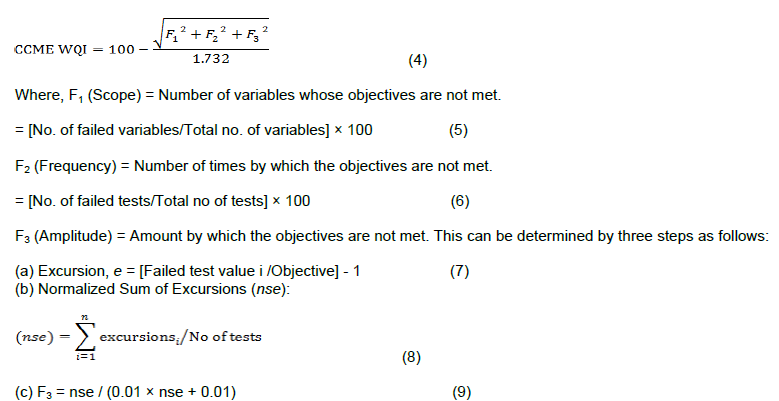
CCME WQI is based on a combination of three factors: scope, frequency and amplitude (Tyagi et al., 2013; CCME, 2001a, b) and is given by:
is an asymptotic function that scales the normalized sum of excursions from objectives (nse) to yield a range between 0 and 100.
Based on results of index calculation, which was based on exceedances of objectives for key water quality variables, water quality of a water body was ranked as either excellent (95 to 100), good (80 to 94), fair (60 to 79), marginal (45 to 59) or poor (0 to 44) (Tyagi et al., 2013; CCME, 2001a, b; Andrea et al., 2005). Before calculating the index, the water body, variables, and appropriate objectives were defined. Although the time period chosen depends on the amount of data available, here dataset of two years has been used since data from different years can be combined when monitoring of certain years is incomplete (CCME, 2001a, b). Furthermore, WQIs were calculated separately as the dataset used to determine WQI of the UB is quite different from that of the MLB.
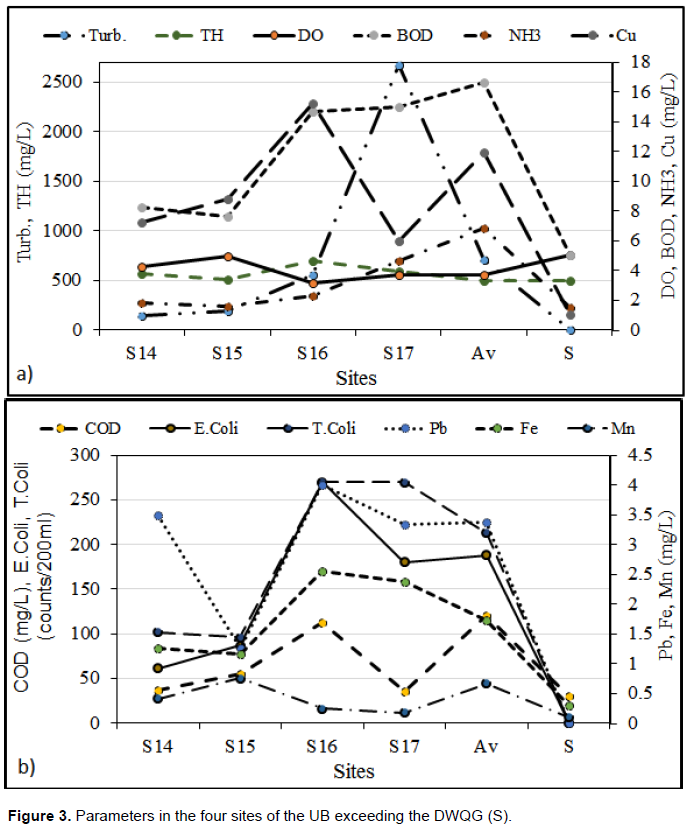
Looking at the average (Av) of the overall sites of each parameter, those which failed to meet the WHO DWQG (S), according to WHO (2011, 2017), were turbidity, DO, BOD, COD, Pb, Fe, Mn, NH3, Cu, TH, ECo and TC in the UB as could be depicted by Figure 3a and b. In the MLB, parameters that do not satisfy the DWQG are TH, Na, F-, alkalinity, and PO4-. Those that are not in harmony with the FAO irrigation water quality guideline, according to Ayers and Westcot (1985), were TN, K+, SO4, Mn, NH3, Cu, Mg, TH, ECo and TC in the UB and Na, Mg, F-, alkalinity, HCO3-, PO4-, and SAR in the MLB.
Determination of WQI and status of Awash River in the upper basin
Temperature,DO,NO2- and TH were excluded from evaluating the irrigation WQI as their guideline values
were not available. The calculation of WQI in the UB was done assuming values of TNTC of fecal and total coliforms to be 270 each while nil in the MLB was assumed to be zero. In the calculation of amplitude (F3), the objectives of ECo and TC were assumed to be 1 to prevent an infinity excursion though the actual standard of 0. Here the only parameters in Table 2 considered in the index calculation were those for which the WHO, FAO or US EPA guidelines were specified. The three factors F1, F2, and F3 determining the CCME WQI and the resulting indices were computed for drinking and agricultural uses. The factors in this sub-basin got the respective values of 39.29, 42.31 and 97.08 for drinking and 36, 27.72 and 80.97 for irrigation uses. The drinking and irrigation WQIs for the basin, which were computed using Equation 4, were found respectively to be 34.79 and 46.39 as could be seen in Table 4.
WQI and status of Awash River in the MLB
Since guideline values for TS and SAR were not available, these parameters were excluded from the calculation of drinking WQI. For the same reason, TS, TH and NO2- were ignored in calculating irrigation WQI (Table 3). The total number of tests was reduced by two as there were two no data values of CO32- for the tenth and eleventh sites. Taking average values of water quality parameters for the two seasons (dry and wet) in the sub-basins, the three factors F1, F2, and F3 determining the CCME WQI were computed for the respective water uses, drinking and irrigation. Accordingly, their respective values were found to be 60, 33.16 and 95.25 for drinking and 57.14, 24.44 and 17.14 for irrigation uses. As a result the drinking and irrigation WQIs for the basin were computed using Equation 4 were found respectively to be 32.25 and 62.78 (Table 4).
The drinking and irrigation WQIs of the UB were respectively in the poor and marginal categories of the Canadian water quality classification. The indices of drinking and irrigation in the MLB were respectively in the poor and fair categories of the Canadian water quality ranking. Although the difference in the used water quality dataset of the two cases might contribute for the difference in the indices to some extent, it was generally conceivable that the water quality of the River was below the good rank of the council. The water quality status for irrigation use in the MLB seems to have significantly been improved to fair from the marginal status of the UB. This might be attributed to the natural purification process in the course of the River and the release of relatively smaller amount and less polluted effluent in the MLB. Though it may be difficult to compare due to the fact, for instance, that the bacteriological parameters like ECo and TC having significant impact were not considered in the MLB, it can be clearly seen from Figures 3 and 4 that the upper basin’s waste is being stabilized at Lake Koka (S15) after attaining peak values at the 16th site (just before Lake Koka). Alemayehu et al. (2006) also found out that the domestic water quality status seems to have been deteriorated more in the MLB than that in the UB. This might be the impact of the hydro-geochemical nature of the downstream sub-basin, which includes part of the Ethiopian rift valley (Dinka, 2017).
On the other hand, the value of SAR for sites S8, S9 and S12, which were respectively After Beseka, Lake Beseka and Sodere spring, exceeded the FAO guideline and hence these water bodies are not fit for irrigation unless some intervention is exercised at these hotspots. Similarly, RSC for sites S5, S6, S7, S8, S9, and S12 was greater than 7.5 and hence these sites were found to be unfit for irrigation while only S1 and S2 were shown to lie respectively in the fit and marginal ranges (Table 3). This finding is supported by the conclusions of Dinka (2017) and Alemayehu et al. (2006), stating that Lake Beseka’s and other rift valley lakes’ salinity, sodicity and alkalinity are too high to affect the River.
Means of the commonly analyzed 11 variables (TDS, EC, NO3-, NO2-, NH3, F-, Cl-, Ca, Mg, TH and alkalinity) were compared between the UB and MLB and between sites in each sub-basin as shown by Figures 4 and 5a and b. The comparison showed that TDS, EC, F-, Cl-, and alkalinity were observed to be greater in the MLB than that in the UB. However, NO3-, NO2-, NH3, Ca, Mg and TH showed higher values in the UB than in the downstream. This low concentration is in agreement with that studied by Dinka et al. (2015) which may be due to the fact that the upper basin is relatively more dominated by agro-chemicals and hardness. The former is consistent with the fact that the water from Sodere hot spring and Lake Beseka is of exceptionally high TDS and EC values and with previous studies such as that conducted by Reimann et al. (2003) and Halcrow (1989) indicating high fluoride concentration in Awash valley.
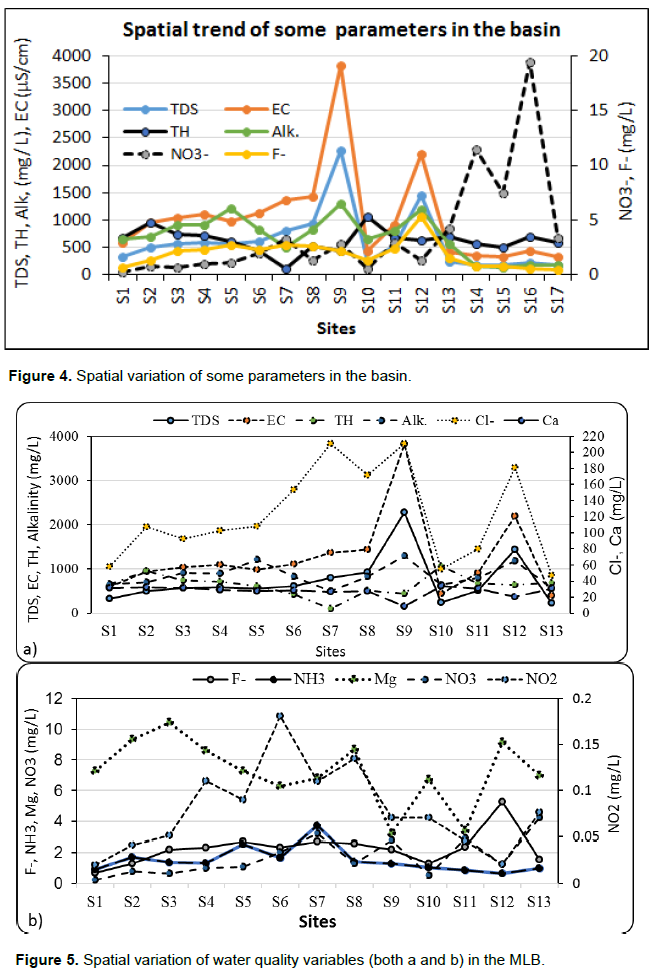
Comparison among sites within the UB showed that S16 (Awash River just before Koka Dam) had higher values of almost all parameters than S17 (Melka Kuntire) (Figures 3, 4 and Table 2); that is, as one goes from
uplands to downstream, except turbidity, BOD, TC and NH3, all have shown increasing trends. This can be attributed to effluents discharged from tanneries, oil mill factories, slaughterhouses and poultry farms around Mojo town (discharging their raw effluent directly into the Mojo River-tributary to Awash), similar wastes of Addis Ababa city (through Great and Little Akaki Rivers, which in turn converge to Abasamuel-tributary to Awash) and that of the nearby rural areas concentrated by floriculture and other industrial establishments (Degefu et al., 2013). However, some others such as COD, Fe, ECo, and TC were seen to decrease in the way from the 16th to the 14th site. Comparison among sites within the MLB also indicates some variation with exceptional picks especially of EC, TDS, and alkalinity at S9 and S12 (Lake Beseka and Sodere hot spring respectively) (Figures 4 and 5).
The graphical representations of the spatial variation of the determining parameters indicate clearly why the domestic water quality decreases as one goes from upper to downstream sub-basins and why the opposite is true for irrigation water quality.
Abundance of nutrients in the UB is expected from the ground based on the fact that agricultural activities using intensive nutrients are pronounced more in the UB than in the downstream basins. Hardness, as expected, is higher in the UB since ground water is being utilized and released into the River and discharges of greywater, full of Ca and Mg, from urban centers can potentially raise hardness.
CONCLUSION AND RECOMMENDATIONS
The study evaluated the physico-chemical (throughout the Awash River) and bacteriological (only in its UB) water quality for drinking and irrigation water uses. The water quality analysis results examined from different sites of the River showed that most of the parameters of concern do not comply with the drinking water quality guidelines and hence unsuitable for drinking. It also showed that most parameters need great care to be used even for irrigation. Both the cumulative drinking and irrigation WQIs of the UB and the drinking WQI of the downstream sub-basins lie in the poor range. This calls for protection of the River (especially in the upper and middle basins where intensive socio-economic activities are being observed) since contamination of this River with physical-chemical and biological determinants are attributed to wastewater discharge from urban, industrial, agricultural activities, lakes and hot springs in its catchment. Because one ultimate goal of water resources management in a basin is to implement programs that conserve water quality, it would be imperative to have a long-term monitoring program at selected sites. These programs together with establishment of municipal wastewater and storm-water treatment plants for identified dischargers in the basin would be among the potential solutions to increase the indices, which show improvement of the River water quality.
The authors have not declared any conflict of interests.
REFERENCES
|
Alemayehu T (2001). The impact of uncontrolled waste disposal on surface water quality in Addis Ababa, Ethiopia. SINET: Ethiop. J. Sci. 24(1):93-104.
Crossref
|
|
|
|
Alemayehu T, Ayenew T, Kebede S (2006). Hydro geochemical and lake level changes in the Ethiopian Rift. J. Hydrol. 316:290-300.
Crossref
|
|
|
|
|
Amenu D (2014). Drinking Water Quality and Determinants of Household Potable Water Consumption. Res J. Chem. Environ. Sci. 2(5):09-12.
|
|
|
|
|
Andrea R, Beverly M, Stephanie S (2005). Calculation of the CCME Water Quality Index for Selected Rivers in the Georgia Basin. Proceedings of the Puget Sound Georgia Basin Research Conference.
|
|
|
|
|
American Public Health Association (APHA) (1998). Standard methods for the examination of water and wastewater, 20th Edn, American People Health Association/ American Water Works Association/ Water Environment Federation, Washington DC, USA.
|
|
|
|
|
Ayers RS, Westcot DW (1985). Water quality for agriculture: FAO Irrigation and Practice Paper, Vol. 29. Rome, UN FAO.
|
|
|
|
|
Barceló-Quintal ID, Salazar-Peláez ML, García-Albortante J, Domínguez-Mariani E, López-Chuken UJ, Gómez-Salazar S (2013). Evaluation of water quality index in Lerma River upper basin. J. Environ. Prot. 4(7A):98-103.
Crossref
|
|
|
|
|
Bartram J, Ballance R (1996). Water quality monitoring: a practical guide to the design and implementation of freshwater quality studies and monitoring programs. CRC Press, UNEP and WHO, E and FN Spon of Chapman and Hall, London, UK.
|
|
|
|
|
Bauder TA, Waskom RM, Davis JG, Sutherland PL (2011). Irrigation water quality criteria. Fort Collins, CO: Colorado State University Extension.
|
|
|
|
|
Belay EA (2009). Growing lake with growing problems: integrated hydrogeological investigation on Lake Beseka, Ethiopia. ZEF, Germany.
|
|
|
|
|
Benti G, Kebede A, Menkir S (2014). Assessment of bacteriological contaminants of some vegetables irrigated with Awash River water in selected farms around Adama town, Ethiopia. J. Microbiol. Antimicrob. 6(2):37-42.
Crossref
|
|
|
|
|
Berhe FT, Melesse AM, Hailu D, Sileshi Y (2013). MODSIM-based water allocation modeling of Awash River Basin, Ethiopia. Catena 109:118-128.
Crossref
|
|
|
|
|
Bu H, Tan X, Li S, Zhang Q (2010). Temporal and spatial variations of water quality in the Jinshui River of the South Qinling Mts., China. Ecotoxicol. Environ. Saf. 73(5):907-913.
Crossref
|
|
|
|
|
Canadian Council of Ministers of the Environment (CCME) (2001a). Canadian water quality guidelines for the protection of aquatic life: CCME Water Quality Index 1.0, User's Manual. In: Canadian environmental quality guidelines, Canadian Council of Ministers of the Environment, Winnipeg.
|
|
|
|
|
CCME (2001b). Canadian water quality guidelines for the protection of aquatic life: CCME Water Quality Index 1.0, Technical Report. In: Canadian environmental quality guidelines, Canadian Council of Ministers of the Environment, Winnipeg.
|
|
|
|
|
Cude CG (2001). Oregon water quality index: a tool for evaluating water quality management effectiveness. J. Am. Water Resour. Assoc. 37(1):125-137.
Crossref
|
|
|
|
|
Degefu F, Lakew A, Tigabu Y, Teshome K (2013). The water quality degradation of upper Awash River, Ethiopia. Ethiop. J. Environ. Stud. Manag. 6(1):58-66.
Crossref
|
|
|
|
|
Dinka MO (2016). Quality Composition and Irrigation Suitability of Various Surface Water and Groundwater Sources at Matahara Plain. Water Resour. 43(4):677-689.
Crossref
|
|
|
|
|
Dinka MO (2017). Analysing the temporal water quality dynamics of Lake Basaka, Central Rift Valley of Ethiopia. IOP Conf. Series: Earth and Environmental Science 52 (2017).
|
|
|
|
|
Dinka MO, Loiskandl W, Ndambuki JM (2015). Hydrochemical characterization of various surface water and groundwater resources available in Matahara areas, Fantalle Woreda of Oromiya region. J. Hydrol. Reg. Stud. 3:444-456.
Crossref
|
|
|
|
|
Gedion T (2009). Surface Water-Groundwater Interactions and Effects of Irrigation on Water and Soil Resources in the Awash Valley. Dissertation, Addis Ababa University.
|
|
|
|
|
Gibrilla A, Bam EK, Adomako D, Ganyaglo S, Osae S, Akiti TT, Kebede S, Achoribo E, Ahialey E, Ayanu G, Agyeman EK (2011). Application of water quality index (WQI) and multivariate analysis for groundwater quality assessment of the Birimian and Cape Coast Granitoid Complex: Densu River Basin of Ghana. Water Qual. Expo. Health 3(2):63-78.
Crossref
|
|
|
|
|
HALCROW (1989). Master plan for the development of surface water resources in the Awash Basin. Final Report-Vol. 2, Ministry of Water Resources, Addis Ababa, Ethiopia.
|
|
|
|
|
HALCROW (2008). Rift Valley Lakes Basin Integrated Resources Development Master Plan Study Project, Phase 1-Report, Part II-Sector Assessments, Volume 7 – Environment, Annex D: Water Quality, Ministry of Water, Irrigation and Energy, Addis Ababa Ethiopia.
|
|
|
|
|
HALCROW (2009). Rift Valley Lakes Basin Integrated Resources Development Master Plan Study Project. Phase 2 Final Report, Part I, Volume 1: Master Plan and Stakeholder Consultation, Ministry of Water, Irrigation and Energy, Addis Ababa Ethiopia.
|
|
|
|
|
Holmes S (1996). South African Water Quality Guidelines. Volume 7: Aquatic Ecosystems. Department of Water Affairs and Forestry (DWAF). Government Printer, Pretoria. 145p.
|
|
|
|
|
Hussain G, Alquwaizany A, Al-Zarah A (2010). Guidelines for irrigation water quality and water management in the Kingdom of Saudi Arabia: An overview. J. Appl. Sci. 10(2):79-96.
Crossref
|
|
|
|
|
Kaurish FW, Younos T (2007). Developing a standardized water quality index for evaluating surface water quality. J. Am. Water Resour. Assoc. 43(2):533-545.
Crossref
|
|
|
|
|
Lenntech BV (2014). Water hardness calculator.
|
|
|
|
|
Lesch SM, Suarez DL (2009). Technical note: a short note on calculating the adjusted SAR index. Trans. ASABE 52(2):493-496.
Crossref
|
|
|
|
|
Pejman AH, Bidhendi GN, Karbassi AR, Mehrdadi N, Bidhendi ME (2009). Evaluation of spatial and seasonal variations in surface water quality using multivariate statistical techniques. Int. J. Environ. Sci. Technol. 6(3):467-476.
Crossref
|
|
|
|
|
Poonam T, Tanushree B, Sukalyan C (2015). Water quality indices-important tools for water quality assessment: a review. Int. J. Adv. Chem. 1(1):15-28.
|
|
|
|
|
Rangeti I, Dzwairo B, Barratt GJ, Otieno FA (2015). Validity and Errors in Water Quality Data-A Review. Research and Practices in Water Quality. Durban University of Technology, Durban, South Africa, pp. 95-112.
Crossref
|
|
|
|
|
Reimann C, Bjorvatn K, Frengstad B, Melaku Z, Tekle-Haimanot R, Siewers U (2003). Drinking water quality in the Ethiopian section of the East African Rift Valley I - data and health aspects. Sci. Total Environ. 311(1):65-80.
Crossref
|
|
|
|
|
Sargaonkar A, Deshpande V (2003). Development of an overall index of pollution for surface water based on a general classification scheme in Indian context. Environ. Monit. Assess. 89(1):43-67.
Crossref
|
|
|
|
|
Seid M, Genanew T (2013). Evaluation of soil and water salinity for irrigation in North-eastern Ethiopia: Case study of Fursa small scale irrigation system in Awash River Basin. Afr. J. Environ. Sci. Technol. 7(5):167-174.
|
|
|
|
|
Singh S, Ghosh NC, Krishan G, Galkate R, Thomas T, Jaiswal RK (2015). Development of an overall water quality index (OWQI) for surface water in Indian context. Curr. World Environ. 10(3):813-822.
Crossref
|
|
|
|
|
Sorlini S, Palazzini D, Sieliechi JM, Ngassoum MB (2013). Assessment of physical-chemical drinking water quality in the Logone Valley (Chad-Cameroon). Sustainability 5(7):3060-3076.
Crossref
|
|
|
|
|
Taddese G, Sonder K, Peden D (2004). The water of the Awash River basin: a future challenge to Ethiopia. Addis Ababa, Ethiopia.
|
|
|
|
|
Tessema SM (2011). Hydrological modeling as a tool for sustainable water resources management: a case study of the Awash River Basin. Doctoral dissertation, KTH Royal Institute of Technology.
|
|
|
|
|
Tyagi S, Sharma B, Singh P, Dobhal R (2013). Water quality assessment in terms of water quality index. Am. J. Water Resour. 1(3):34-38.
|
|
|
|
|
WHO (2011). Guidelines for drinking-water quality. Vol. 1, 4th ed., world health organization, Geneva.
|
|
|
|
|
WHO (2017). Guidelines for drinking-water quality: incorporating the first addendum, 4th ed., Geneva.
|
|
|
|
|
Wills M, Irvine KN (1996). Application of the national sanitation foundation water quality index in Cazenovia Creek, NY, pilot watershed management project. Middle States Geographer. pp. 95-104.
|
|
|
|
|
Worako AW (2015). Evaluation of the water quality status of Lake Hawassa by using water quality index, Southern Ethiopia. Int. J. Water Resour. Environ. Eng. 7(4):58-65.
Crossref
|
|
|
|
|
Zhang C (2007). Fundamentals of Environmental Sampling and Analysis. John Wiley and Sons, Inc. Houston, Texas, USA.
Crossref
|
|