Full Length Research Paper

ABSTRACT
Land cover changes impact the soil and water quality which are critical for environmental and human health. The goal of this study is to evaluate whether the land cover change along the Tigris River, one of the largest rivers in the Middle East, is causing any heavy metal contamination. The objectives of this study were: (1) To analyze the metal concentrations in the water and soil samples along the Tigris River and (2) identify and map the land cover changes of the Baghdad district. A total of nine water and soil samples were collected from three different Tigris River (TR) sampling locations, namely Gherai´at (TR1), Bab Al Moatham Bridge (TR2), and Karada-Masbah (TR3). Surface soil and water samples were collected, and analyzed for various metal concentrations. Landsat satellite imagery from 1984 and 2018 were analyzed and compared for land cover changes. Our water sample analysis revealed that As, Cd, Cr, Cu, Pb and Zn remained low and are within the permissible limit of WHO standards. Soil samples showed that Cu, and Pb concentrations in TR1 and TR2, respectively were higher compared to other locations. The metal concentrations in both water and soil samples at the sampled locations were at safe levels. Remote sensing analysis revealed that the water surface in the study area increased by about 5.3% while the vegetative surface decreased by 10.3% during the period of 1984 to 2018. Water and vegetative cover increased further in the south of Baghdad, along the Tigris River, compared to the north. The impact of land cover changes and increase in soil metal concentrations are higher on TR2 and TR3 locations. Environmental chemical analysis coupled with geospatial data helps to monitor the impact of land cover changes on water and soil quality by identifying areas vulnerable to change.
Key words: Water quality, landsat, soil quality, heavy metal, land cover change.
INTRODUCTION
Increased pollution of rivers by nutrients and metals are jeopardizing the environmental and human health around the world. Several natural and geological processes, including weathering, erosion, and dissolution of rocks and soils contribute to significant addition of mineral nutrients to freshwater (Al-Juboury, 2009). In recent years, air and water pollutants originating from industrial and urban centers have become primary sources of freshwater pollution (Lomniczi et al., 2007). Dominant anthropogenic sources of contamination include fertilizer, textile, tanning, agricultural, and petrochemical industries. Additionally, domestic and medical waste contribute to the accumulation of elevated levels of chemical contaminants in the soil and water resources of urban regions (Goel, 2006). Further, concentrations of nutrients and heavy metals can be used to estimate changes in aquatic and soil pollution levels (Chen et al., 2006) and its impact on human and environmental health. Heavy metals in nature can remain inactive or stable by forming compounds which can influence their bioavailability and toxicity in aquatic environments (Al-Juboury, 2009).
The Tigris River is 1850 km long, of which 1414 km runs through Iraq. The river rises in the Taurus Mountains of eastern Turkey and flows in a generally southeasterly direction until joining the Euphrates River in southern Iraq (Ewaid et al., 2018). The Tigris River enters Baghdad and divides the city into two parts, Karkh and Risafa (Ewaid et al., 2018). Baghdad has a subtropical desert climate and is one of the hottest cities in the world. From June to August, the average temperature ranges from 32.3 to 34°C; while from December to February, Baghdad has high temperatures ranging from 15 to 16°C (Tasnim et al., 2016). The lowest temperatures typically are recorded in January and can be around 4°C. Annual rainfall is almost entirely limited to November through March, averaging around 150 mm. Average monthly rainfall ranges from 3.3 mm for October to 27.2 mm for January (Tasnim et al., 2016).
Several studies were conducted to monitor and evaluate the Tigris River water quality (Al-Ansari and Knutsson, 2011; Rabee et al., 2011). High concentrations of SO4, Fe, Ni, and Cd were reported in the Tigris River water (Al-kubaisi and Ebrahim, 2004; Atta, 2020). Consequently, the Water Quality Index (WQI) of Tigris River water is reported to be 266, exceeding the safety limit of 100 (Ewaid et al., 2018). The quality of Baghdad’s outflowing water is poorer than that of water flowing into the city (Atta, 2020). Spikes in nutrient and heavy metal contamination along the Tigris River in recent years were influenced by generous discharges of domestic sewage and industrial effluents released directly into the river channel (Sulaymon et al., 2009; Ewaid et al., 2018). Additionally, increases in the number of power plants, chemical industries, and waste water treatment plants (WWTP) along the river since the 1980s (Hamad et al., 2014) coupled with continuous armed conflicts in the region have also contributed to the degradation in water quality. Abdullah et al. (2020) indicated that several irrigation systems had been built at the upper and middle parts of Tigris River basin (within the Mesopotamia plain), and the river has suffered from water scarcity as well as damage to its banks. Low water volume in the river channel also contributes to increase in chemical concentration. In another report, the water quality of Baghdad’s Tigris River was evaluated at various points and observed to have poor quality in both summer and winter, indicating that the Tigris River, within Baghdad, was heavily polluted (Rabee et al., 2009). More recently, El-Amier et al. (2018) recommended treating drainage water from point pollution sources along the Tigris River in addition to preventing agricultural discharge from flowing directly into the river to improve water quality. The urban and road side soils of Baghdad were reported to have high concentrations of Cd, Ni, and Pb (Al-Obaidy and Al Mashhadi, 2013), which also acts as a source to transfer metal pollutants to surface water sources.
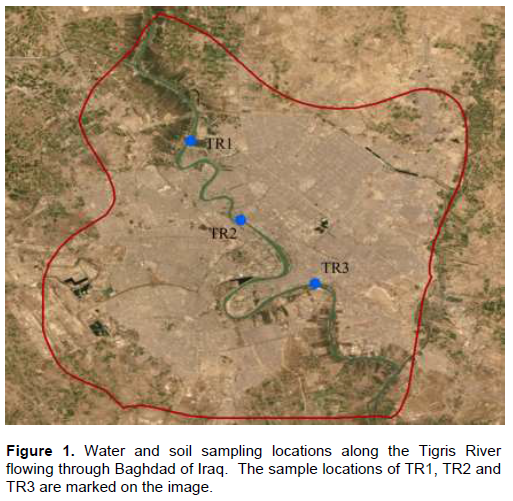
In this study, three locations were chosen along the Tigris River within Baghdad (Figure 1) to assess water and soil quality. Land cover changes within Baghdad, and its impact on river water quality was also analyzed. The objectives of this study were: (1) to analyze the metal concentrations in the water and soil samples along the Tigris River and (2) to identify and map the land cover changes of Baghdad.
METHODOLOGY
Study area and sampling locations along Tigris River
Tigris River locations for the surface water and soil samples of this study are as shown in Figure 1. Nine water and soil samples were collected from three different sampling locations, namely, Gherai´at (TR1), Bab Al Moatham Bridge (TR2) and Karada-Masbah (TR3) along the Tigris River. All three locations are popular, publicly accessible locations for recreation, tourism, fishing, business, and other day-to-day activities. Water samples from all three locations were collected in triplicates, and the GPS coordinates of the sampling sites were recorded by a portable Global Positioning System (GPS) receiver (Trimble Inc., Sunnyvale, CA). Samples were immediately transported and kept refrigerated until chemical analysis was performed. The Gherai´at area (TR1) is an old residential neighborhood located on the northern side of Baghdad and is characterized by intense agriculture activities. The Bab Al Moatham Bridge (TR2) is an historic area in the center of Baghdad neighboring a large medical facility and several plastic and other manufacturing industries. Karada-Masbah (TR3) is located downstream where the Tigris River exits Baghdad and is surrounded by several petrochemical, tanning, and agricultural industries.
Sampling and chemical analysis
Triplicate water samples were collected from upper surface layers of about 0-30 cm depth in the middle of the river, and flood plain soil samples were collected at depth of 0-15 cm from the banks of the river at each of the three sampling locations along the river. All samples were stored in sterile 250 mL plastic bottles. Chemical concentration within the water and soil samples was determined by using Inductively Coupled Plasma Mass Spectrometry (ICP-MS) (Agilent Technologies, 7800 ICP-MS). Approximately, 10 mL of water samples were acidified in 0.6 mL of HNO3 and 0.4 mL of HCl and then acid digested. About 0.5 g of sieved soil samples were added to 50 mL centrifuge tubes into which 10 mL of HNO3 was added. Soil and water samples were acid-digested using a microwave digester (Mars 6, CEM, Matthews, NC) following the EPA 3015A method for water (Dirk et al., 1999) and the EPA 3050B (USEPA, 1996) for soil. Digested samples were stored in centrifuge tubes for 24 h for further digestion, allowing the soil and other solids to settle. About 0.2 μl of supernatants were micro pipetted into 5 mL centrifuge tubes containing 6.8 mL of water. The diluted, acid-digested soil and water samples were loaded and analyzed for of As, Cd, Cr, Cu, Pb, and Zn concentrations by ICP-MS. Water and soil samples were statistically analyzed using MINITAB statistical software (MINITAB Inc., State College, PA, USA).
GIS Analysis
Spatial data, comprising the spatial boundaries for the study area at district level, were downloaded and processed from DIVA-GIS (http://www.diva-gis.org/gdata), a public and freely available dataset. Vector data of Baghdad district along with the Tigris River flow line was extracted and separated to derive the study area. Water sampling points of the study area were imported into GIS as a separate vector layer. The land cover changes within the study area were evaluated from downloaded satellite imagery.
Satellite data analysis
Landsat 5 and Landsat 8 imagery corresponding to the time periods of June 24, 1984 and June 22, 2018, respectively, were chosen for this study. Both the Landsat imagery were cloud free and were downloaded from USGS Earth Explorer (https://earthexplorer.usgs.gov/) website, and processed using the ER Mapper V16.6 software (Hexagon Geospatial, 2020). Several single band and spectral ratio combinations were derived from the Dark Object Subtracted (DOS) values from each of the 7 bands in the case of Landsat 5 imagery and from each of the 11 bands in the case of Landsat 8 imagery. A DOS value of a spectral band is defined as one value less than the minimum digital number found in all pixels of that particular image for that spectral band (Vincent et al., 2004; Sridhar et al., 2009, 2011).
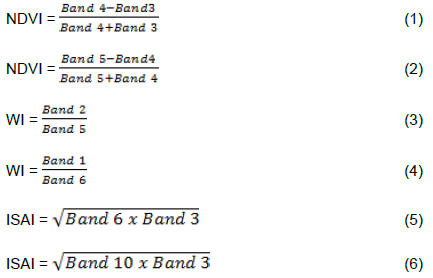
The vector data layers of Baghdad district study area were overlaid and clipped, and the extracted study area from each of the Landsat imagery was then used for subsequent analysis. Land cover changes were evaluated by mapping the vegetative and impervious surface characteristics. These serve as environmental indicators to map and monitor the landscape changes in the study area. To map the green vegetation in the study area, Normalized Difference Vegetation Index (NDVI) was calculated by using Equation 1 (Rouse et al., 1974) for Landsat 5 imagery and using Equation 2 for Landsat 8 imagery. A Water Index (WI), Equation 3 in the case of Landsat 5 Imagery and Equation 4 in the case of Landsat 8, was used to map the water content of the study area (Sridhar et al., 2020; Sridhar and Gidudu, 2020). For Impervious Surface Area Index (ISAI), Equation 5 was used to map the impervious surface areas in the Landsat 5 imagery, while Equation 6 was used for the Landsat 8 imagery (Sridhar et al., 2020; Sridhar and Gidudu, 2020). The spatial and temporal changes in impervious surface, water, and vegetative surface areas for the periods of 1984 and 2018 were mapped and quantified individually for each of the satellite images.
Landsat image classification accuracy assessment was conducted with reference of 70 random ground truth sampling points of the study area, that were collected with GPS device in the field and using high resolution google earth imagery for assessment of every classified image. The data was summarized and quantified by using error matrices.
RESULTS AND DISCUSSION
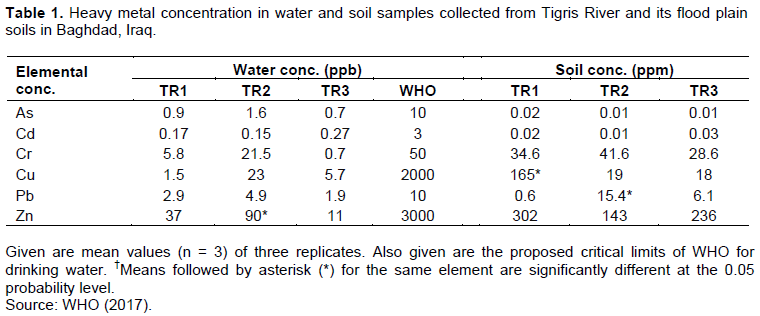
Water concentrations of As, Cd, Cr, Cu, Pb and Zn remained low and below permissible limits of WHO standards along the Tigris River (Table 1). Among the three sample locations, the concentrations of Zn were significantly (p < 0.05) higher in TR2 compared to TRI and TR3 (Table 1), but they are all well below the WHO permissible limits. The concentration of As, Cd, and Pb remained similar at all three sampling locations. The Cr and Cu concentrations in water samples at TR2 was at least four times higher than other sampling locations. The metal concentrations in soil samples across the three locations do not show much variation and remained low. Soil concentrations of Pb in TR2 were significantly (p < 0.05) higher than levels measured for TR1 and TR3 (Table 1). The concentrations of Cu were significantly higher (p < 0.05) in TR1 compared to the other two locations.
The natural color Landsat imagery of the Baghdad study area along with the Tigris River that flows within the urban area from the time periods of 1984 and 2018 are as shown in Figure 2A and C. The location of the water and soil samples collected during the summer of 2018 is also shown in Figure 2C. A three-ratio color composite image, where the WI, NDVI, and ISAI indices are displayed in blue, green, and red, respectively, for the 1984 (Figure 2B) and 2018 (Figure 2D) time period is shown. The vegetation in the northern region of Baghdad, upstream of TR1, decreased in 2018 (Figure 2D) compared to 1984 (Figure 2B). Further, the surface area of water increased over time from 1984 to 2018 (Figure 2).
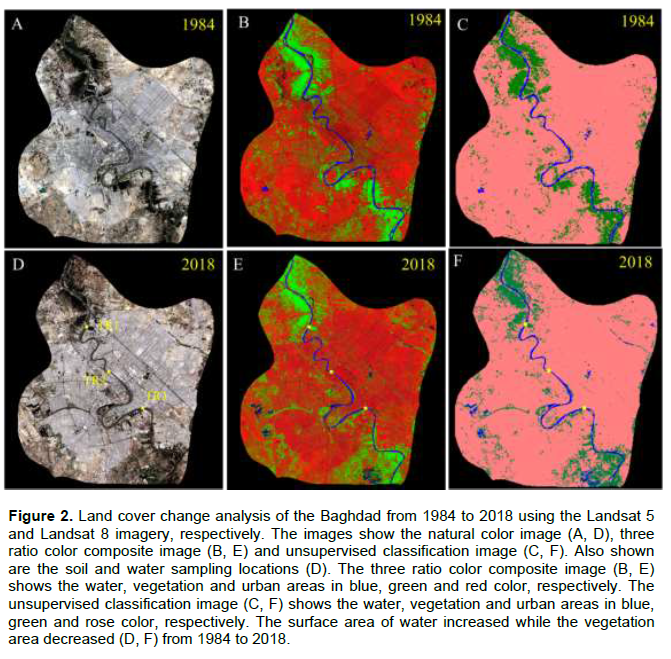
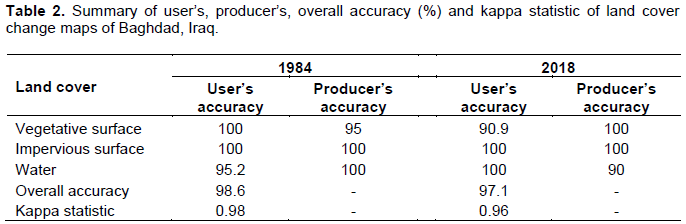
An unsupervised classification of the Landsat imagery with the ratio inputs of WI, NDVI and ISAI showed that the southern part of Baghdad, along the Tigris River, had greater vegetative and water cover compared to the northern part in 2018 (Figure 2F) compared to 1984 (Figure 2C). Interestingly, while the vegetative surface area in the study area decreased from 10,632 ha in 1984 to 9,542 ha in 2018, the surface area covered by water increased slightly from 1,674 ha in 1984 to 1,763 ha in 2018 (Figure 2C and D). The impervious surface area increased from 69,594 ha in 1984 to 70,698 ha in 2018 (Figure 2C and D). The vegetative surface area within the study area of Baghdad decreased by 10.3% from 1984 to 2018 while the water cover increased by 5.3% over that same period (Figure 2C and D). Furthermore, impervious surface area increased by 1.5% over the period of the last three decades. The accuracy assessment of the classified Landsat imagery of 1984 and 2018 are shown in Table 2. The overall accuracy of the study area was98.6 and 97% while the kappa statistic was 0.98 and0.96 for the 1984 and 2018 imagery, respectively (Table 2).
The concentration of As, Cd, Cr, Cu, Pb and Zn in water at all the locations was well below the WHO critical limits. The previous reports indicated that Iraqi wastewater contains high concentrations of Cu, Pb, Cd, and Ni which accumulate in soil sediments, thereby negatively impacting living systems (Al-Obaidy et al., 2016). The metal concentrations in the water remained low in this study because the sampling was conducted during the summer. The concentrations of heavy metals were found to be higher in the Tigris River during winter season compared to summer, because of low water flow (Rabee et al., 2009).
The Cr and Cu water concentrations at TR2 were several-fold higher than the other two sampling locations but were well below the WHO criteria. The Cu soil concentrations of TR1 were significantly higher compared to the other two locations. Anthropogenic sources for increased Cr in soil and water concentrations are steel manufacturing, leather and textile manufacturing, coal combustion, and other industrial sources (Al-Juboury, 2009). Elevated Cr concentration in TR2 was likely due to its proximity to the largest gathering of industrial facilities in Baghdad. Additionally, regional power stations use Cr salts in their cooling towers, producing chromite that is eventually discharged into the wastewater (Al-Obaidy et al., 2016). With regards to human health, Cr causes inflammation of the kidneys and has a corrosive effect on the intestinal epithelium. Further, Cr is noxious for aquatic organisms and has been observed to inhibit algal growth (Goel, 2006). The high Cu in TR1 soil samples was likely due to the electroplating operations and electrical wiring industries nearby. Our data mirrored earlier findings reporting elevated Cu salts in the area (Al Saadi et al., 2002).
Zn concentrations in flood plain soils in TR1 and TR3 were observed to be higher but far from concern. In highly polluted river beds, Zn concentrations may reach up to 2000 and 14000 mg/kg (Kabata and Pendias, 2001). Pb concentrations in TR2 soils were significantly higher than the other two locations (Table 2). The sources of Pb include ammunition, welding, chemical fertilizers, pesticides, and printing (Alloway and Ayres, 1997). Previous studies indicated significantly high Pb concentrations in vegetable oil factories (Al-Saadi et al., 2002), which were in close proximity to TR2 sample site. Over all our soil analysis indicates that the metal concentration was low.
When comparing Landsat satellite imagery of 1984 to 2018, we found that the vegetative surface of the Tigris River within Baghdad decreased by 10.3% while water cover increased by 5.3%. The predominant increase in the water cover was seen to the south of Baghdad district along the Tigris River. Even though the overall vegetation cover decreased in the study area, the vegetation along the southern part of the district along the Tigris River increased in 2018 compared to 1984. Overall, the land cover changes were significant to the north of the TR1 sampling location with decreased vegetative surface area over time. The surface area of the water and vegetation to the south of the TR3 sampling site increased from 1984 to 2018.
The overall Landsat classification accuracy of Baghdad district, which is 98.6 and 97.1% for the imagery of 1984 and 2018 (Table 2) is higher than the suggested minimum level of interpretation accuracy of 85% (Anderson et al., 1976). The user’s and producer’s accuracy for the vegetative and impervious surface cover land cover was found to be high (Table 2), which is sufficient to produce an overview of the landscape change pattern within the area along the Tigris river.
CONCLUSIONS
Our water quality analysis revealed that all the metal concentrations fell within the permissible WHO limits. Reduced vegetation cover, as revealed by Landsat imagery, followed by the presence of several medical, industrial, and urban facilities in the vicinity of TR2 was the likely cause for the slight increase in metal concentration at that site. Also, high vegetative cover (in the vicinity of TR1) and the meandering, sinuous flow of the river along with higher vegetation along TR3 may be partly responsible for the lower metal concentrations in water.
Soil chemical concentration revealed increase in concentrations of Cr, and Pb in the soils of TR2 compared to the other two locations. The high proportion of urban and impervious surface areas near the TR2 location, compared to the TR1 and TR3 locations, might have played a major role in the variability of the soil and water along the river. At midstream (TR2), within Baghdad’s largest industrial region, the concentrations of metals in water and soil were elevated. Overall the metal concentration in the water and soil samples were below the threshold levels in the region. This study improves our understanding of the impact of surrounding land cover and their changes on water and soil quality in Baghdad.
Further research involving the use of high-resolution satellite and aerial imagery along with a comprehensive, multi-temporal water and soil analysis for extensive inorganic and organic contaminants covering the region will be greatly beneficial. The limitation of this study is that the soil and water sampling was carried only once during the summer. Urban growth coupled with environmental sustainability is key to future economic growth in the region.
CONFLICT OF INTERESTS
The authors have not declared any conflict of interests.
ACKNOWLEDGMENTS
The author thanks Mr. Abas Yahia and Ms. Kanar Hasan for the assistance in water and soil sample collection and Ms. Djene Keita for her help in chemical analysis of the samples. This work was supported by the personal travel funds of the author and the National Science Foundation (NSF) grants for Texas Southern University (TSU) under the award numbers HRD-1622993 and BCS-1831205.
REFERENCES
|
Abdullah M, Al-Ansari N, Adamo N, Sissakian VK, Laue J (2020). Irrigation Major Systems on Euphrates River within Mesopotamia. Journal of Earth Sciences and Geotechnical Engineering 10(4):199-219. |
|
|
Al-Ansari N, Knutsson S (2011). Toward prudent management of water resources in Iraq. Journal of Advanced Science and Engineering Research 1:53-67. |
|
|
Al-Juboury AI (2009). Natural Pollution by Some Heavy Metals in the Tigris River, Northern Iraq. International Journal of Environmental Research 3(2):189-198. |
|
|
Al-kubaisi QY, Ebrahim HA (2004). Some characteristics of Tigris river pollution for Baghdad city. Iraqi National Journal of Earth Science 4(2):76-83. |
|
|
Alloway B, Ayres DC (1997). Chemical Principles of Environmental Pollution.2nd Edition, Chapman and Hall, London, 395pp. |
|
|
Al-Obaidy AHMJ, Al Mashhadi AAM (2013). Heavy metal contaminants in urban soil within Baghdad city, Iraq. Journal of Environmental Protection 4:72-82. |
|
|
Al-Obaid AHMJ, Al-Janabi ZZ, Al-Mashhady AAM (2016). Distribution of some heavy metals in sediments and water in Tigris River. Journal of Global Ecology and Environment 4(3):140-146. |
|
|
Al-Saadi H AHA, Al-Mayaly EK, Hassian DM (2002). Heavy Metals in Diyala and Tigris River Southern Baghdad City. Iraq. Al Qadisiyia Journal of Pure Science 7(2):52-58. |
|
|
Anderson JR, Hardy EE, Roach JT, Witmer RE (1976). A Land Use and Land Cover Classification System for Use with Remote Sensor Data. Circular 761. Washington, DC, USA. |
|
|
Atta HA (2020). Assessment and geographic visualization of salinity of Tigris and Diyala rivers in Baghdad city. Environmental Technology and Innovation 17:1-12. |
|
|
Chen GC, He ZL, Sotoffellac PJ, Yang X S, Yu S, Yang JY, Calvert DV (2006). Leaching Potential of Heavy Metals (Cd, Ni, Pb, Cu and Zn) from Acidic Sandy Soil Amended with Dolomite Phosphate Rock (DPR) Fertilizers. Journal of Trace Elements in Medicine and Biology 20(2):127-133. |
|
|
Dirk DL, Walter PJ, Kingston HM (1999). Wastewater Standards and Extraction Chemistry in Validation of Microwave-Assisted EPA Method 3015A. Environmental Science and Technology 33(14):2469-2473 |
|
|
El-Amier YA, Al-Hadithy ON, Kadhim OG, El-Alfy MA (2018). Evaluation of Water and Sediment Quality of the Tigris River, Baghdad City, Iraq. American Journal of Earth and Environmental Sciences 1(1):10-19. |
|
|
Ewaid SH, Abed SA, Kadhum SA (2018). Predicting the Tigris river water quality within Baghdad, Iraq by using water quality index and regression analysis. Environmental Technology and Innovation 11:390-398. |
|
|
Goel PK (2006). Water Pollution.2nd Edition. Published by New Age International (P) Ltd., Publisher 418 p |
|
|
Hamad SH, Schauer JJ, Shafer MM, Al-Rheem EA, Skaar PS, Heo J, Tejedor-Tejedor I (2014). Risk assessment of total and bioavailable potentially toxic elements (PTEs) in urban soils of Baghdad-Iraq. Science of Total Environment 494:39-48. |
|
|
Hexagon Geospatia (2020). ERDAS ER Mapper Software (Version- 16.6.0.630). Madison, AL, USA. |
|
|
Lomniczi I, Boemo A, Musso H (2007). Location and Characterization of Pollution Sites by Principal Component Analysis of Trace Contaminants in A Slightly Polluted Seasonal River: A Case Study of the Arenales River (Salta, Argentina). Water SA 33(4):479-485. |
|
|
Rabee A, Abdul-Kareem B, Al-Dhamin A (2011). Seasonal variations of some ecological parameters in Tigris River Water at Baghdad Region, Iraq. Journal of Water Resource and Protection 3(4):262-267. |
|
|
Rabee A, Al-Fatlawy Y, Abd Own A (2009). Seasonal Variation and Assessment of Heavy Metal Pollution in Sediments from Selected Stations in Tigris and Euphrates Rivers, Central Iraq, Iraqi Journal of Science 50(4):466-475. |
|
|
Rouse JW, Haas R., Schelle JA, Deering DW, Harlan JC (1974). Monitoring the vernal advancement and retrogradation (green wave effect) of natural vegetation. Type III Final Report, NASA Goddard Space Flight Center, Green belt, Maryland. |
|
|
Sridhar BBM, Gidudu A. (2020). Effect of Landscape Changes on the Water Quality of Murchison Bay. International Journal of Advanced Remote Sensing and GIS. |
|
|
Sridhar BBM, Johnson J, Mosuro A (2020). Impact of Land Cover Changes on the Soil and Water Quality of Greens Bayou Watershed. Water Air and Soil Pollution 231:510 |
|
|
Sridhar BBM, Vincent RK, Roberts SJ, Czajkowski K (2011). Remote sensing of soybean stress as an indicator of chemical concentration of biosolid amended surface soils. International Journal of Applied Earth Observation 13:676-681. |
|
|
Sridhar BBM, Vincent RK, Witter JD, Spongberg AL (2009). Mapping the total phosphorus concentration of biosolid amended surface soils using LANDSAT TM data. Science of the Total Environment 407:2894-2899. |
|
|
Sulaymon AH, Ali AM, Al-Naseri SK (2009). Natural organic matter removal from Tigris river water in Baghdad, Iraq. Desalination 245(3):155-168. |
|
|
Tasnim HK, Al-Baldawi Z, Al-Zuabidi ZA (2016). Statistical analysis of extreme rainfall data in Baghdad city. Iraqi Journal of Science 57(1): 713-718. |
|
|
USEPA (1996). Method 3050B: Acid Digestion of Sediments, Sludges, and Soils, Revision 2. Washington, DC. |
|
|
Vincent RK, Qin X, McKay RML, Miner J, Czajkowski K, Savino J, Bridgeman T (2004). Phycocyanin detection from LANDSAT TM data for mapping cyanobacterial blooms in Lake Erie. Remote Sensing of Environment 89(3):381-392. |
|
|
World Health Organization (WHO) (2017). Guidelines for drinking-water quality: fourth. Geneva: World Health Organization, License: CC BY-NC-SA 3.0 IGO. |
|
Copyright © 2024 Author(s) retain the copyright of this article.
This article is published under the terms of the Creative Commons Attribution License 4.0


