Full Length Research Paper

ABSTRACT
Droughts are part of extreme meteorological phenomena that generate serious social, economic and environmental consequences. This study seeks to characterize the historical (1976-2019) and projected (2021-2050) meteorological drought in the Niger River Basin in Benin. To achieve this, the present study used daily rainfall observations and simulations of two regional climate models (RCM) (HIRHAM and REMO) from fifteen (15) rainfall stations installed around the basin. We used standardized precipitation indices (SPI) at 12 and 36 months’ time steps. To have a normal distribution, the data were transformed according to the Gamma distribution. The results revealed that over the historical period (1976-2019), SPI showed increasing trends with near-normal droughts occurring about 90% and the other drought classes around 10%. At the 12- and 36-month SPI scales, there are average durations of 17 and 32 months respectively and peaks of -1.52 and -1.12. In the future, according to the average representative concentration pathway of the RCM, the trends remain very low (1/1000 per decade) with near-normal droughts occurring at about 80 and 20% for the other classes. For SPI-12 and SPI-36 months, there are likely mean drought durations of 19 and 40 months respectively with likely mean peaks of -1.5 and -1.6. The changes assessment shows the decrease in near-normal droughts and the increase in moderate and severe droughts on average compared to the baseline period. Drought durations are also expected to increase with smaller peaks. These changes remain non-significant according to the Student's test.
Key words: Meteorological, drought, standardized precipitation index (SPI), Beninese Niger River Basin.
INTRODUCTION
The industrial revolution has favored the impact of human activities on the environment, which is becoming more and more important, altering the climatic balance and thus having effects on precipitation and this phenomenon leads to drought. Drought is a normal and frequent feature of the climate. There are several types of droughts (Layelmam, 2008). Drought is defined from the meteorological, hydrological, agricultural or socio-economic point of view (FAO, 1996). Thus, drought does not have a universal definition; there are as many definitions of drought as there are water uses (Layelmam, 2008; McKee et al., 1993). Weather-related drought is a natural phenomenon due to multiple causes, which vary from region to region (WMO, 2006).
In recent years, several studies have focused on global change, many of which have focused on droughts (Layelmam, 2008). The drought of the 1970s was manifested by a shortening of rainfall in West Africa (Sow, 2007; Faye, 2013) and the Sahelian zone does not say otherwise (Sarr, 2009). Indeed, in West Africa, drought results in a decrease in river flows, or even a cessation of flow in some rivers (Nicholson et al., 2000; Chappell and Agnew, 2004; Dai et al., 2004). In fact, the WMO counts a total of 1.3 billion people who died from direct or indirect causes of drought, compared to 1.4 billion people who were affected by this phenomenon from 1967 to 1991 (Layelmam, 2008). These phenomena would be intensified by an agricultural practice not adapted to the environmental and climatological conditions, combined with the overexploitation of the hydric reserves which accelerate the process of droughts and sometimes lead to an irreversible situation, the desertification. Thus, it appears that drought is one of the most complex natural disasters that impacts on different sectors, economic, social and environmental (ILWAC Project, 2013). This phenomenon of drought does not put the Beninese basin of the Niger River on the margin.
Benin's Niger River Basin, located in the semi-arid zone is all the more affected as it is experiencing a significant population increase. This increase in population intensifies anthropogenic pressures on fragile resources whose degradation is increasingly worrying (Ozer et al., 2010). Throughout the Niger River, the hydrological regime has evolved due to climate change and anthropogenic impacts. There are only a few dams on the Niger River, and future planned works will modify its regime and the flooded areas (Mahe et al., 2011). Indeed, in the basin, rainfall has dropped by 15 to 25% since the beginning of the drought in the 1970s, but towards the outlet of the basin, at Douna (101,200 km²), annual flows have fallen by more than 65% (Paturel et al., 2010). In order to highlight the dry sequences which are so far slightly addressed in the Benin basin of the Niger River and to assess their evolution in the near future on the said basin, this work is interested in the study of standardized precipitation indices at intervals of 12 and 36 months over the basin.
METHODOLOGY
Description of the study environment and data
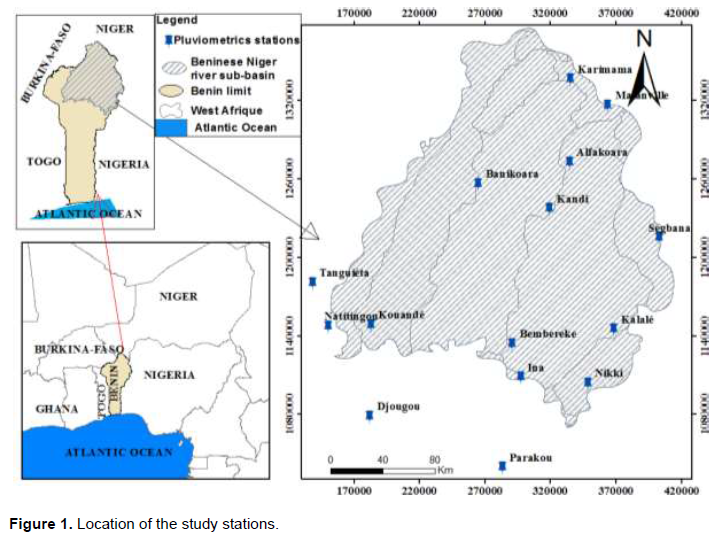
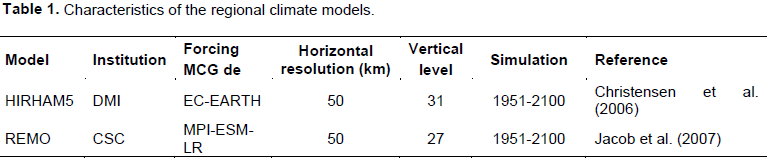
The Beninese Niger River Basin is located in the extreme north of Benin (Figure 1). It covers an area of approximately 48,000 km² or 42% of the total area of Benin (114,763 km²). Located between latitudes 10° and 12°30' north and longitudes 1°32' and 3°50' east, it includes the Mékrou, Alibori and Sota sub-basins, and is generally oriented SSW-NNE (Vissin, 2007). The implementation of this research work required the collection of daily rainfall data observed from 1976 to 2019 at 15 rainfall stations (Figure 1) installed around the Beninese basin of the Niger River. These data are collected from the Benin Meteorological Agency (Météo-Bénin) and are complemented by data from the regional climate models DMI-HIRHAM5 (Denmark) and MPI- REMO (Germany) which have produced good results in the area (Badou, 2016). These RCM have a resolution of 50 km each and have been forced by GCM outputs (ECHAM5 for DMI-HIRHAM5 and MPI for MPI-REMO (table 1). These models have, at the daily scale for precipitation, historical simulations over the period 1960-2005 and simulations of RCP4.5 and RCP8.5 scenarios over the period 2006-2100. The future period selected is 2021-2050. For the observations, the period 1990-2019 was chosen as the historical period to evaluate the changes.
Standardized precipitation Index
To analyze the drought in the Beninese Niger River Basin, we use methods derived from the calculation of the Standardized Precipitation Index which was developed by the University of Colorado in 1990 (McKee et al., 1993). For this index, the distribution of precipitation is generally positively skewed, and a transformation is applied to the data to make their distribution normal or Gaussian (Sharma, 1997).
In the present research, the data were transformed according to the Gamma distribution. The calculation of the SPI therefore involves fitting a Gamma probability density function to a given time series of precipitation, whose probability density function is defined as follows (Angelidis et al., 2011).

Where: α>0 is a shape parameter; β>0 is a scale parameter and x>0 is the amount of precipitation.
 : is the gamma function, defined by:

Fitting the distribution to the data requires the estimation of α and β. Using Thom's (1958) approximation, these parameters can be estimated as follows:
where : is the average value of the precipitation amount; n is the precipitation measurement number, and x is the precipitation amount in a data sequence.
The integration of the probability density function with respect to x gives the expression G (x) for the cumulative probability given below:

By substituting t= x / ß, the last equation is reduced to:

It is possible to have several zero values in a sample. In order to take into account the probability of zero values, since the Gamma distribution is not defined for x=0, the cumulative probability function for the Gamma distribution is modified as follows:

Where q is the probability of zero precipitation, calculated using the following equation:

With m: number indicating how many times the precipitation was zero in a temporal sequence of data; and n: number of observations of precipitation in a sequence of data.
Finally, the cumulative probability distribution is transformed into a normal distribution to give the SPI. After the approximate conversion provided by Abramowitz and Stegun (1965), it follows that:
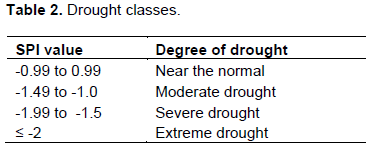
To calculate the SPI, daily, weekly, or monthly records spanning at least 20 to 30 years are ideally available, but 50 to 60 years or more is the optimal time period (Guttman, 1994). Four classes have been defined as shown in Table 2. The 12 and 36 month steps of the SPI were considered for the study.
Considering these four drought classes, the drought risk was estimated by the following formula:

RSi: Drought Risk of an event I; Fi: its Frequency; Fir: its rank considering the 10th centile; and FT: the total frequency.

With RS the Drought Risk,  in near normal drought,
  in Moderate drought,
  in Severe drought and
  in Extreme drought.
Bias correction
The 'Delta change' (DC) method has been used for model data correction. It is the simplest and most widely used bias correction method (Graham et al., 2007; Moore et al., 2008; Sperna Weiland et al., 2010) and consists of scaling the observations to obtain the corrected simulations. It is a modest method in which the parameters are usually corrected with a multiplier or addictive factor. In this method, the factor scaled to a period is applied to each incorrect daily observation in the same period to generate the corrected daily time series (Lafon et al., 2013). Equation 16 is used to correct the precipitation data in this precipitation study.

Where  represents the corrected parameters;
  the observed parameters.
  are respectively the average of the simulated data of the base period and the average of the data of the projection period.
Evaluation of changes
Quantifying the effects of future changes in the extremes of daily climate variables is of great necessity to enable assessment of the vulnerability of hydrological systems to climate change.
In this study, future changes from the baseline period are evaluated using Equation 17. The 2021-2050 projection period was chosen to assess changes in droughts under the RCP4.5 and RCP8.5 scenarios of the REMO and HIRHAM climate models. A sub-period (1990-2019) was chosen as the reference period for assessing changes.

Where  is the average of the hydroclimatic parameter over the considered projection period and
  its average over the reference period. Also, Student's t-test was applied on the hydrometeoro-logical parameters to assess the significance of the quantified changes.
RESULTS
Analysis of the performance of bias corrections on a monthly basis
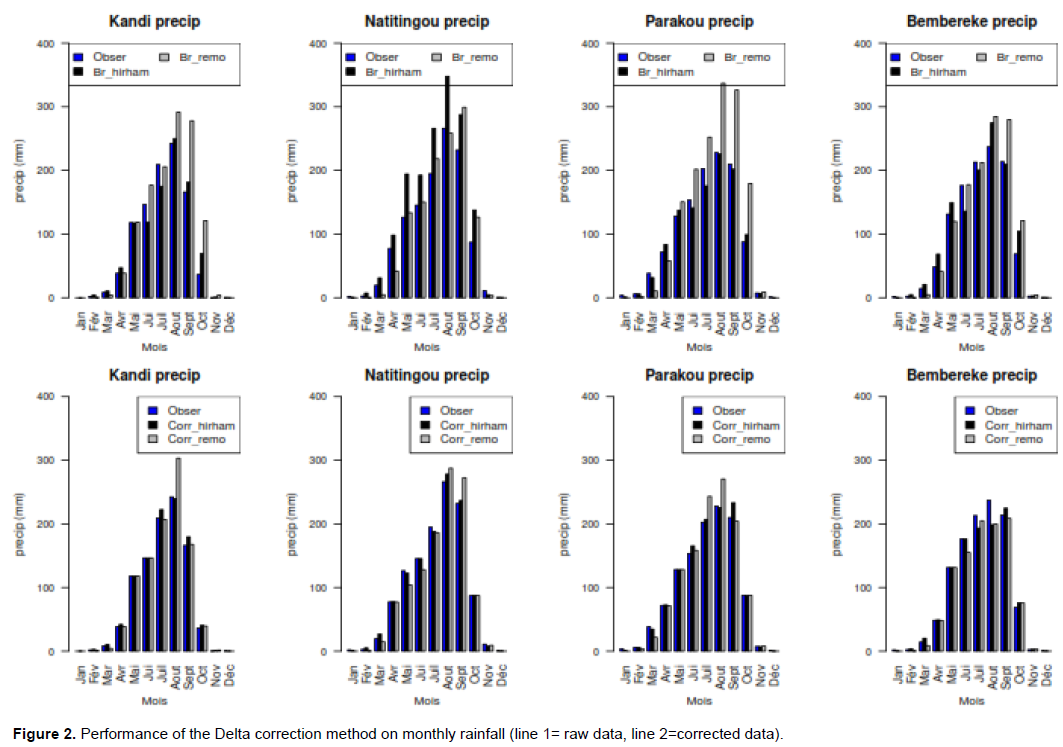
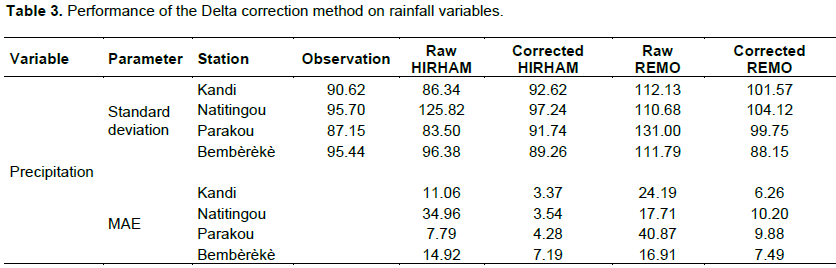
Figure 2 and Table 3 show the performance of the bias corrections method used by considering the monthly averages of precipitation. On one hand, these results show that the Delta method used to correct the data performed well. Table 3 shows a large difference in the mean absolute error (MAE) between the raw data and the corrected data. The corrected data tend to zero. On the other hand, we noticed that the Delta method is more effective in Kandi, Parakou and Natitingou in comparison to Bembereke (Figure 2).
Analysis of historical droughts
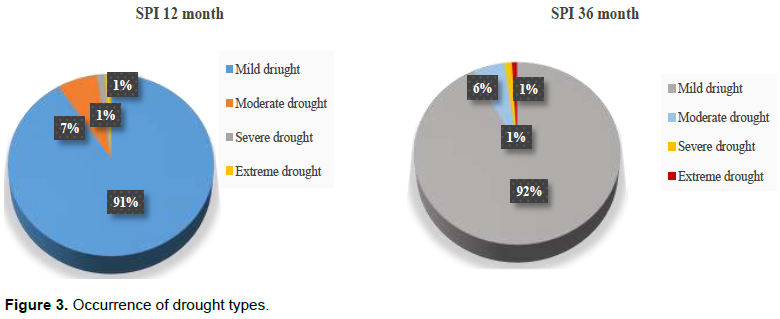
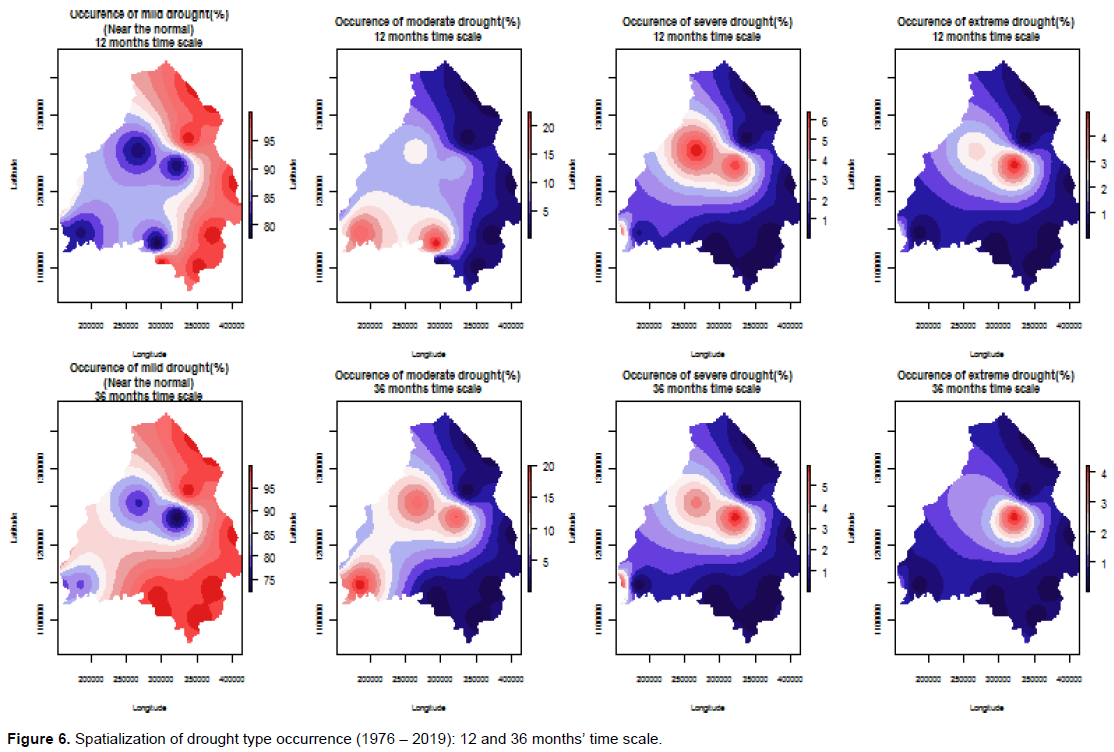
Figure 3 shows the average occurrence of different types of droughts in the Beninese Niger River Basin during the period 1976-2019. At the 12-month scale, the SPI in the Beninese Niger River Basin is characterized by 91% near-normal drought conditions, 7% moderate drought, 1% severe drought and 1% extreme drought (Figure 3). On the other hand, at the 36-month scale, 92, 6, 1 and 1% of droughts are respectively near-normal, moderate, severe and extreme (Figure 3). For these two steps of the SPI, during 1976-2019, near-normal droughts occurred more frequently. This is followed by moderate, severe, and extreme droughts in succession.
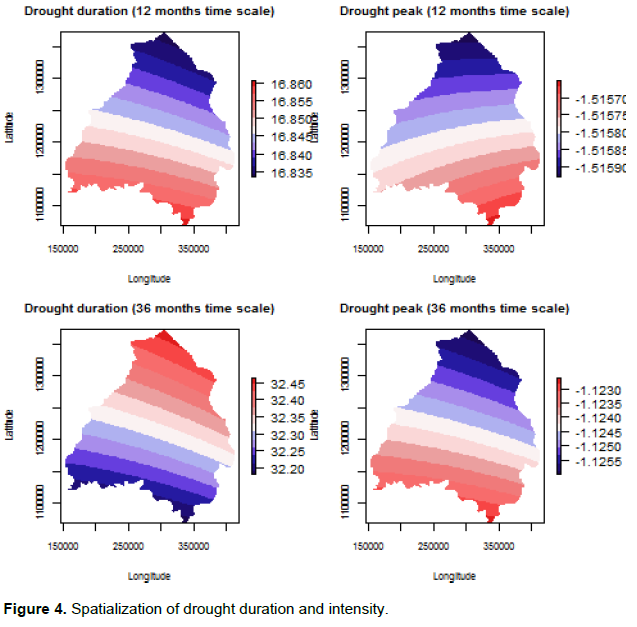
The extent of drought averages 17 months for the SPI-12 months and 32 months for the SPI-36 months in the study basin (Figure 4). There is a decrease in the durations of the 12-month SPI with increasing latitude, while the opposite is observed with the 36-month SPI (Figure 4). The mean intensity of the 12-month SPI is -1.52, whereas the 36-month SPI is -1.12 (Figure 4). Both SPI windows show intensities that decrease with increasing latitude (Figure 4).
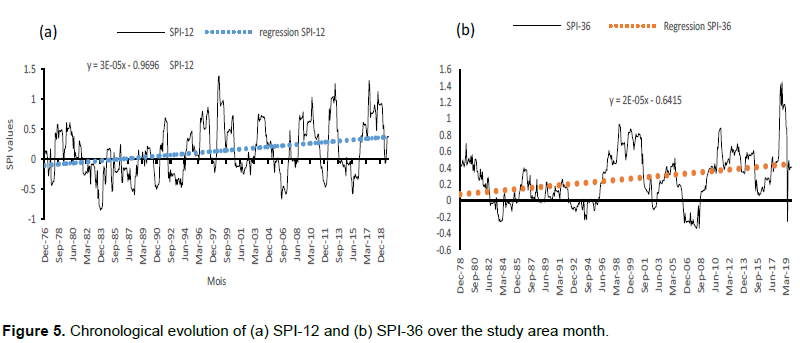
On the other hand, the 12- and 36-months SPI over the basin show very weak increasing trends time series (Figure 5). This trend reflects an increase in rainfall amounts over the sub-study period.
On a 12-month SPI scale, severe and extreme droughts occurred more in the central part of the basin than in other parts (Figure 6). In contrast, the south experienced more moderate droughts and the east of the basin experienced near-normal droughts (Figure 6). At the 36-month SPI scale, the same observation, as in the case for the 12-month SPI level, is made for extreme, severe and near normal droughts (Figure 6). However, moderate drought has its highest values in the western part of the basin with the 36-month SPI (Figure 6).
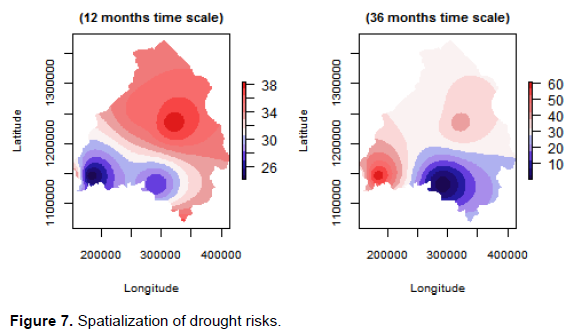
Drought risks based on frequencies of occurrence and ranks of drought events for the 12 and 36-month SPI windows are shown in Figure 7. At the 12-months SPI scale, drought risk increases with increasing latitude. In contrast, at 36-month SPI, the risk of drought is highest in the southwest and lowest in the southeast of the basin (Figure 7).
Projected drought analysis
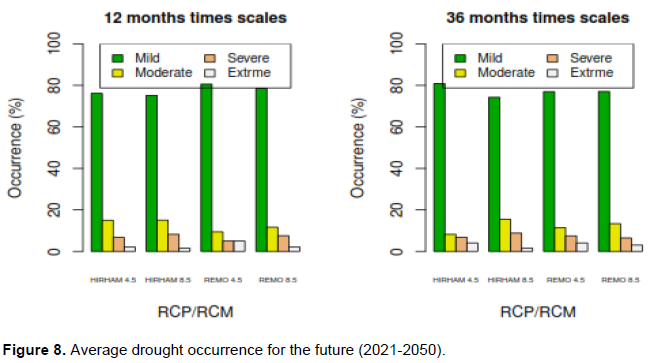
The average occurrences of the different types of droughts for each SPI window and for each scenario of each model for the future (2021-2050) in the Beninese Niger River Basin are presented in Figure 8. At the 12-month scale, the SPI is characterized by 78 to 80% of near- normal drought conditions for both models (Figure 8); moderate droughts for their part vary between 10 and 18%, then severe droughts for this window vary between 5 and 10% and finally extreme droughts vary between 2 and 5% (Figure 8). It should be noted that with the HIRHAM model, the moderate droughts are more pronounced than with the REMO model, whereas the opposite is observed with the near-normal droughts (Figure 8). On the other hand, at the 36-month scale of the SPI, variations between 78 and 82%, between 20 and 17%, between 5 and 10% and between 1 and 4% are observed for near-normal, moderate, severe and extreme droughts respectively (Figure 8).
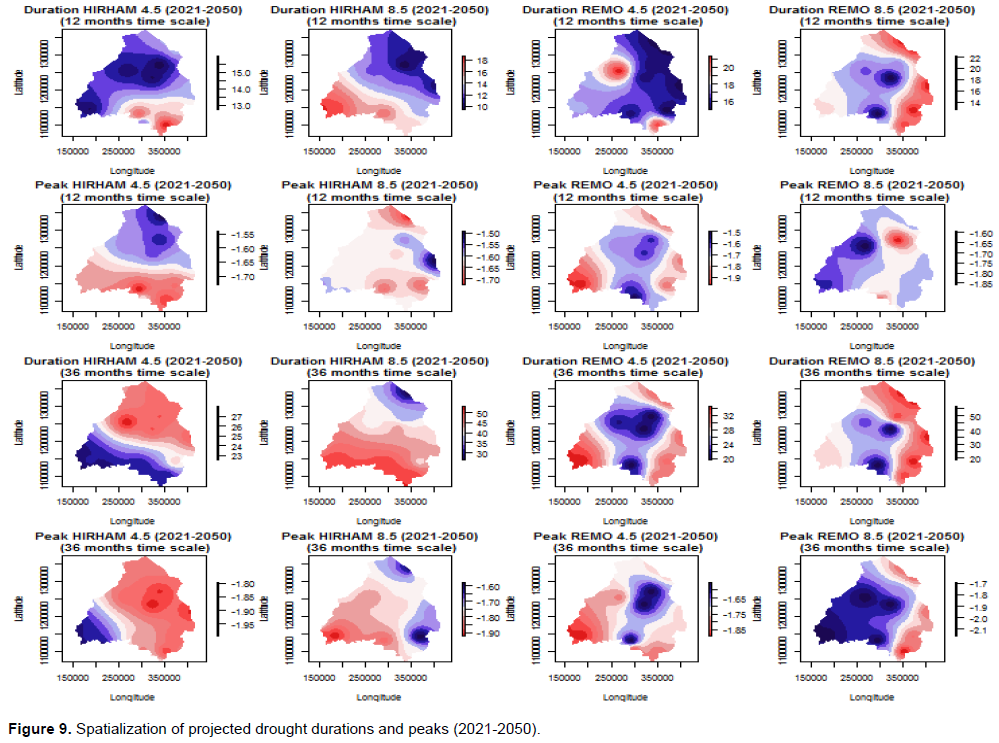
Drought extents and intensities are presented in Figure 9. On average, the 12-month scale drought durations of the SPI in the future (2021-2050) will decrease from the south of the basin to the north for both HIRHAM model RCP4.5 and RCP8.5 scenarios (Figure 9). In contrast, RCP4.5 of the REMO model has the low values of drought durations in the west and south of the basin (Figure 9). The RCP8.5 of the same model will show the low values of drought duration in the center of the basin (Figure 9). The HIRHAM RCP4.5 scenarios show the same variation for drought durations and intensities. For RCP8.5 of the same model, the low intensity values will be located in the east of the basin (Figure 9). At the same time that the REMO RCP4.5 model has the low peak drought values in the center of the basin, the REMO RCP8.5 model has the high peak values (Figure 9). At the 36-month SPI scale, the scenarios show the same variations for drought peaks and durations (Figure 9). For the 12-month SPI, there are average durations of 15, 16, 19, and 18 months with intensities of 1.6, 1.65, 1.7, and 1.75 for HIRHAM's RCP4.5 and RCP8.5 and REMO's RCP4.5 and RCP8.5, respectively (Figure 9). Whereas for SPI-36 months these durations are 26, 45, 30, and 45 with intensities of 1.9, 1.75, 1.7, and 1.8. Historically, the drought extent averages 17 months for the 12-month SPI and 32 months for the 36-month SPI over the study basin during the reference period, whereas the average Intensity of the 12-month SPI is -1.52 and that of the 36-month SPI is -1.12 (Figure 9).
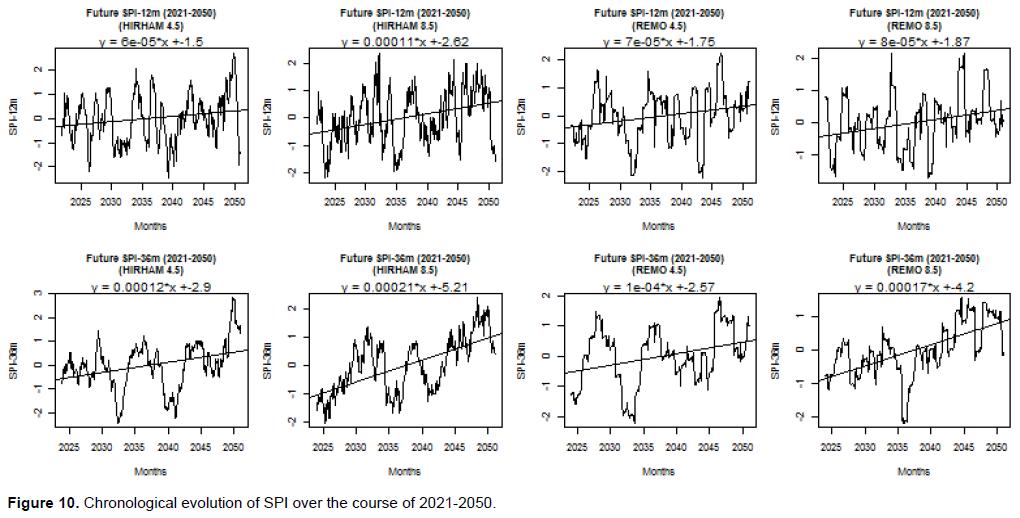
In the Beninese basin of the Niger River, the two climate models used predict very weak chronological increasing trends for the 12- and 36-month SPI through the RCP4.5 and RCP8.5 scenarios (Figure 10). This increase was also very small in the past.
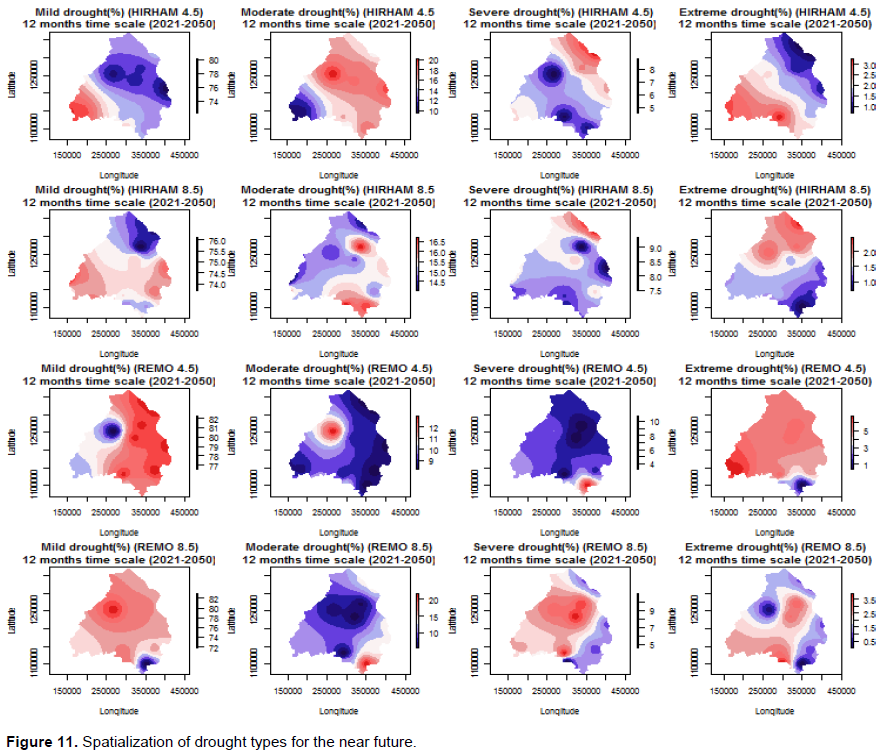
At the 12-month SPI scale, moderate and severe droughts will occur more in the north of the basin with the HIRHAM RCP4.5 scenarios while near-normal and extreme droughts will occur more in the south of the basin (Figure 11). For RCP8.5 scenarios of the same model, near-normal and moderate droughts will be high in the south and severe and extreme droughts will be high in the north of the basin (Figure 11). The REMO model presents through its RCP4.5 scenarios for the near future, near normal droughts in the east of the basin, moderate droughts in the west of the basin, severe droughts in the south and extreme droughts in the north of the basin (Figure 11). With RCP8.5 scenarios of the same model, we notice that near normal droughts occupy all but a portion of the basin, moderate droughts occur only in a small portion of the south, severe droughts occur in the west of the basin, and extreme droughts occur in the center and south of the basin (Figure 11). In contrast, at 36 months SPI, the HIRHAM RCP4.5 scenarios show moderate and extreme droughts in the east of the basin and near normal and severe droughts in the west of the basin (Figure 12). With the RCP8.5 scenarios of the same model, near normal and extreme droughts are found in the south of the basin, moderate droughts in the center and severe droughts in the north of the basin (Figure 12). For the REMO model, RCP4.5 scenarios shows near normal droughts in the north and east of the basin, moderate droughts are shown over all but a small portion of the west. Severe droughts are located in the west and extremes in the east (Figure 12). For RCP8.5 scenarios of the REMO model, near normal and extreme droughts are detected over the entire basin except for a portion in the northwest for extreme drought. Moderate droughts are weak in the north and east while severe droughts occupy these parts of the basin (Figure 12).
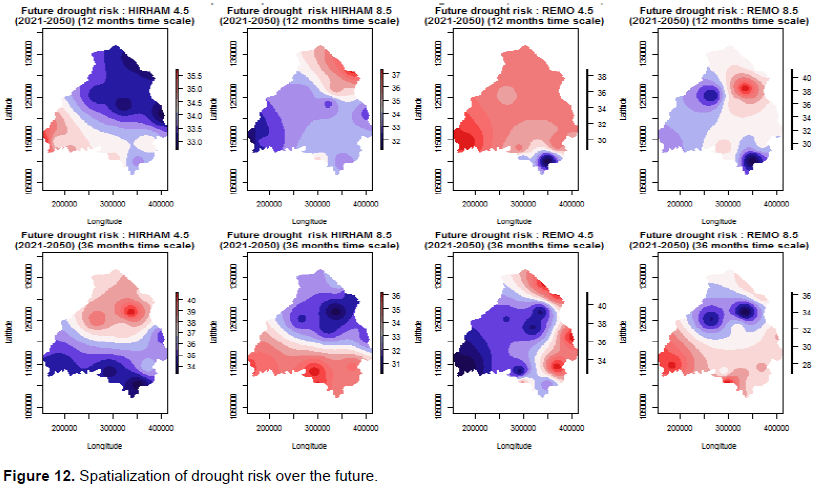
Drought risks are low in the northern part of the basin at 12 months of the SPI, whereas at 36 months they are high in this part of the basin with RCP4.5 scenarios of the HIRHAM model. For the RCP8.5 scenarios of the same model, we notice the opposite effect than the one observed with the RCP4.5 scenarios (Figure 12). With the REMO RCP4.5 scenarios and for the 12-month SPI, the risk is high everywhere except for a small portion of the southern basin (Figure 12). For the 36-month SPI, this scenario has the risk of drought in the north and east of the basin (Figure 12). For the RCP8.5 scenarios of the same model, the risk of drought is localized in the northeast at 12 months of the SPI while at 36 months only the center of the basin is spared (Figure 12).
Evaluation of changes
During 2021-2050, HIRHAM RCP4.5 and RCP8.5 scenarios and REMO RCP8.5 scenarios show average decreases of 4, 5 and 1.5% in near-normal droughts respectively for the 12-month SPI compared to the baseline period, while for REMO RCP4.5 scenarios these droughts changes are around 0.5% (Figure 13). Moderate droughts are around 3.1 and 3.2% respectively with HIRHAM RCP4.5 and RCP8.5 scenarios compared to the baseline period, while they are about 2.4 and 0.2% respectively with REMO RCP4.5 and RCP8.5 scenarios (Figure 13). Severe droughts for the 12-month SPI during2021-2050 are predicted to increase by 1.2, 2.7, and 2% with HIRHAM RCP4.5 and RCP8.5 scenarios and REMO RCP8.5 scenarios, respectively, relative to the baseline period. Meanwhile, REMO's RCP4.5 predicts severe droughts down by 0.5% from the baseline period (Figure 13). During this period, extreme droughts will decrease by 0.4, 1, and 0.4% from the baseline period with HIRHAM RCP4.5 and REMO RCP8.5 scenarios, respectively, and increase by 2.5% with REMO RCP4.5 scenarios (Figure 13).
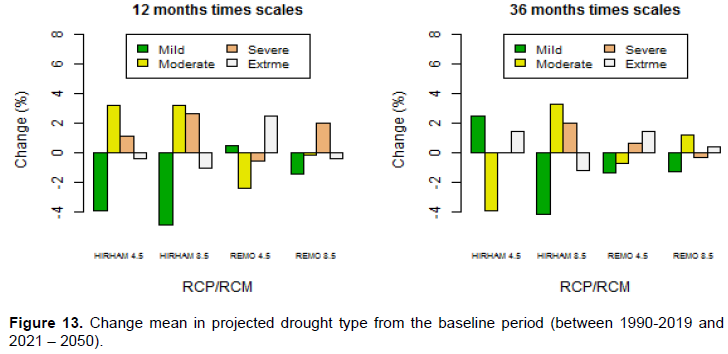
For SPI-36 months during 2021-2050, REMO RCP4.5 and HIRHAM RCP8.5 will show average decreases of 4.1, 1.4, and 1.3% in near-normal droughts relative to the baseline period, respectively, while for HIRHAM RCP4.5 these droughts are projected to increase by 2.5% (Figure 13). Moderate droughts will decrease by 3.4 and 0.7% respectively with the RCP4.5 of both models compared to the baseline period while they will increase by 3.3 and 1.2% respectively with the RCP8.5 of both models (Figure 13). Severe droughts for the 36-month SPI during 2051-2080 are predicted to increase by 0.03, 2.02, and 0.7% respectively by the HIRHAM RCP4.5 and RCP8.5 scenarios and the REMO RCP4.5 scenarios relative to the base period, while the REMO RCP8.5 scenarios predicts them to decrease by 0.32% relative to the base period (Figure 13). During this period, extreme droughts for the SPI-36 months will increase by 1.4, 1.4 and 0.4% from the baseline period with the HIRHAM RCP4.5 scenarios and REMO RCP4.5 and RCP8.5 scenarios respectively and decrease by 1.2% with the HIRHAM RCP8.5 scenarios (Figure 13).
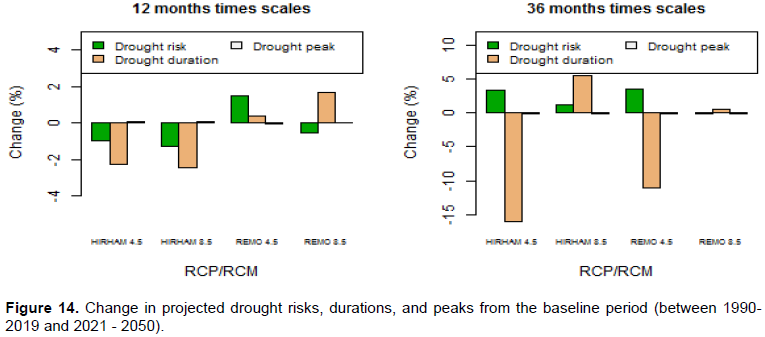
Regardless of the scenario, variations around -0.2 and 0.2 for drought peaks relative to the baseline period are noted across Figure 14. During 2021-2050 and for the 12-month SPI, drought risks will decrease by 1, 1.3 and 0.5 respectively with HIRHAM RCP4.5 and REMO RCP4.5 and RCP8.5, while they will increase by 1.5 with HIRHAM RCP8.5 scenarios (Figure 14). During the same period and for the same SPI window, dryness durations increase by 0.4 and 1.7 months with REMO RCP4.5 and RCP8.5 scenarios respectively and decrease by 2.3 and 2.5 months with HIRHAM RCP4.5 and RCP8.5 respectively (Figure 14). At 36 months of SPI, the durations will decrease during 2021-2050 by 16 and 11.1 months respectively with RCP4.5-HIRHAM and RCP4.5-REMO while increases of 5.6 and 0.5 months are observed with RCP8.5-HIRHAM and RCP8.5-REMO (Figure 14). For the same time period and SPI step, drought risks increase on average by 1.96 for all models (Figure 14).
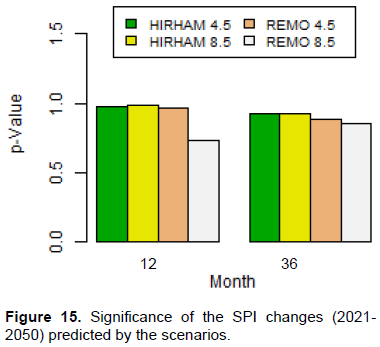
From Figure 15, we can see that none of the changes observed in the SPI indices are significant according to the Student's test (p-Value > 0.05) applied to the 95% confidence interval.
DISCUSSION
A non-significant temporal increase in SPI is projected over the period 2021-2050 in comparison to the baseline period. This reflects that the wet conditions observed during the baseline period will continue for the next 30 years. Furthermore, in the past, 90% of the droughts observed in the basin are near-normal droughts. For the projections, whatever the period, droughts which are close to normal represent about 78% of cases. This implies an increase in the other drought classes (moderate, severe and extreme). If we consider the average of the two scenarios of the two regional climate models used in the present study, the droughts based on the SPI 12 and 36 months, for the period 2021-2050 will increase as well as the drought lengths and some drought peaks and this situation exposes the basin to drought. Furthermore, it should be noted that these predicted drought variations from all investigated models will impact the primary activities of the basin and therefore the economy of the study region. These results on future droughts appear to be global. For example, Zhao et al. (2020) predicted increases in extreme droughts for many regions of the world and the risk is sometimes tripled in some regions. In Zhao et al. (2019), northern America should expect severe droughts for the next 100 years. Spinoni et al. (2020) also reached this last conclusion but added that if only precipitation is considered to predict droughts, the latter will decrease in North America, Amazonia, Central Europe and Asia, Horn of Africa, India and Central Australia. However, if temperatures are taken into account, the droughts will increase.
Regarding the duration of drought, it will vary greatly compared to the reference period. These variations will reach 15 months of decrease for certain models. However, it should be noted that these drought durations will be accompanied mostly by low drought intensities. For Somsubhra et al. (2017), the durations (lengths) of meteorological droughts will be slightly less than or equal to those of the historical period in Kentucky at the same time that drought intensities will decrease in the same area. These results were also obtained since 1995 for the countries sharing the Gulf of Guinea by Paturel et al. (1995). Koudamiloro et al. (2015) also showed that the Oueme at Beterou Watershed in Benin is characterized by droughts to varying degrees.
CONCLUSION
The two scenarios of the two climate models show increasing trends in the standardized precipitation indices calculated at the 12 and 36 months’ time step for the two study periods (1976-2019 and 2021-2050). These variations are very small (not significant) and oscillate around 1 per millennium, that is, very close to zero (0). Nevertheless, it should be noted that the droughts for the periods will probably be more extensive with low incidences than compared to the base period. This situation will impact the availability of water in the basin and predispose it to the risk of flooding, and therefore to environmental degradation and reduced agricultural yield, not to mention the degradation of transport infrastructure.
CONFLICT OF INTERESTS
The authors have not declared any conflict of interests.
REFERENCES
|
Abramowitz M, Stegun IA (1965). Handbook of Mathematical Formulas, Graphs, and Mathematical Tables. Dover Publications (eds): New York 361 p. |
|
|
Angelidis P, Maris F, Vlassiois N (2011). Computation of drought index SPI with alternative distribution functions. Water Resources Management 26(9):2453-2473. |
|
|
Badou DF (2016). Multi-model evaluation of blue and green water availability under climate change in four-non sahelian basins of the Niger River Basin, A thesis submitted in fulfilment of the requirements for the degree of Doctor of Philosophy (PhD), Bénin, 155p, (2016) |
|
|
Chappell A, Agnew CT (2004). Modelling climate change in West African Sahel rainfall (1931-90) as an artifact of changing station locations. International Journal of Climatology: A Journal of the Royal Meteorological Society 24(5):547-554. |
|
|
Christensen OB, Drews M, Christensen JH (2006). The HIRHAM regional climate model version 5. DMi Technology Report 06-17:22. |
|
|
Dai A, Trenberth KE, Qian T (2004). A global dataset of Palmer Drought Severity Index for 1870-2002: Relationship with soil moisture and effects of surface warming. Journal of Hydrometeorology 5(6):1117-1130. |
|
|
Food and Agriculture Organisation (FAO) (1996). La planification des stratégies contre les effets de la sécheresse. juillet 1996. |
|
|
Faye C (2013). Évaluation et gestion intégrée des ressources en eau dans un contexte de variabilité hydroclimatique: cas du bassin versant de la Falémé. Thèse de Doctorat, UCAD, FLSH, Département de Géographie 309 p. |
|
|
Graham LP, Andréasson J, Carlsson B (2007). Assessing climate change impacts on hydrology from an ensemble of regional climate models, model scales and linking methods-A case study on the Lule River basin. Climate Change 81(S1):293-307. |
|
|
Guttman NB (1994). On the sensitivity of sample L moments to sample size. Journal of Climate 7(6):1026-1029. |
|
|
ILWAC Project (2013). Gestion intégrée de la terre et de l'eau pour l'adaptation à la variabilité et au changement climatique au mali, Guide Méthodologique Cartographie de la vulnérabilité face aux risques climatiques 39 p. |
|
|
Jacob D, Bärring L, Christensen OB, Christensen JH, Hagemann S, Hirschi M, Kjell- Ström E, Lenderink G, Rockel B, Schär C, Seneviratne SI, Somot S, van Ulden A, van den Hurk B (2007). An inter-comparison of regional climate models for Europe: model performance in present-day climate. Climatic Change 81(1):31-52. |
|
|
Koudamiloro O, Vissin EW, Sintondji LO, Houssou CS (2015). Effets socio-économiques et environnementaux des risques hydroclimatiques dans le bassin versant du fleuve Ouémé à l'exutoire de Bétérou au bénin (Afrique de l'ouest), XXVIIIe Colloque de l'Association Internationale de Climatologie, Liège 6 p. |
|
|
Lafon T, Dadson S, Buys G, Prudhomme C (2013). Bias correction of daily precipitation simulated by a regional climate model : a comparison of methods. International Journal of Climatology 33(6):1367-1381. |
|
|
Layelmam M (2008). Calcul des indicateurs de sécheresse à partir des images NOAA/AVHRR, Projet de Mise en place d'un Système d'Alerte précoce à la Sécheresse dans trois pays de la rive Sud de la Méditerranée: Algérie, Maroc, et Tunisie LIFE05 TCY/TN/000150 38 p. |
|
|
Mahe G, Lienou G, Bamba F, Paturel JE, Adeaga O, Descroix L, Mariko A, Olivry JC, Sangare S, Ogilvie A, Clanet JC (2011). Le fleuve Niger et le changement climatique au cours des 100 dernières années, Hydro-climatology: Variability and Change. Proceedings of symposium J-H02 held during IUGG2011 in Melbourne, Australia, July 2011) (IAHS Publ. 344, 2011). |
|
|
Mckee TB, Doesken NJ, Kleist J (1993). The relationship of drought frequency and duration to time scales. In Proceedings of the 8th Conference on Applied Climatology 17(22):179-183. |
|
|
Moore K, Pierson D, Pettersso K, Schneiderman E, Samuelsson P (2008). Effects of warmer world scenarios on hydrologic inputs to Lake Mälaren, Sweden and implications for nutrient loads. Hydrobiologia 599:191-199. |
|
|
Nicholson SE, Some B, Kone B (2000). An analysis of recent rainfall conditions in West Africa, including the rainy seasons of the 1997 El Niño and the 1998 La Niña years. Journal of Climate 13(14):2628-2640. |
|
|
WMO (2006). Suivi de la sècheresse, progrès et enjeu futur. |
|
|
Ozer P, Hountondji YC, Niang AJ, Karimoune S, Laminou Manzo O, Salmon M (2010). Désertification au Sahel: historique et perspectives. Bulletin de la Société Géographique de Liège 54:69-84. |
|
|
Paturel JE, Dlawara A , Siou LKA, Talin E, Ferry L, Mahe G, Dezetter A, Muther N, Martin D, Rouche N, L'Aour-Cres A, Seguis L, Coulibaly N, Bahire-Kone S, Koite M (2010). Caractérisation de la sécheresse hydropluviométrique du Bani, principal affluent du fleuve Niger au Mali, Global Change: Facing Risks and Threats to Water Resources (Proc. of the Sixth World FRIEND Conference, Fez, Morocco, October 2010). IAHS Pub!. 340 p. |
|
|
Paturel JE, Servat E, Kouame B, Boyer JF (1995). Manifestations de la sécheresse en Afrique de l'Ouest non sahélienne. Cas de la Côte d'Ivoire, du Togo et du Bénin, SECHERESSE, Note originale, Sécheresse 6(1) :95-102. |
|
|
Sarr MA (2009). Évolution récente du climat et de la végétation au Sénégal (cas du Ferlo). Thèse de l'Université Jean Moulin - Lyon 3, 410 p. |
|
|
Sharma TC (1997). Estimation of drought severity on independent and dependent hydrologic series. Water Resources Management 11(1):35-49. |
|
|
Somsubhra C, Dwayne RE, Yao Y, Hamidisepehr A (2017). An assessment of climate change impacts on future water availability and droughts in the Kentucky River Basin. Environmental Processes 4(3):477-507. |
|
|
Sow AA (2007). L'hydrologie du Sud-Est du Sénégal et de ses confins guinéo-maliens : les bassins de la Gambie et de la Falémé. Thèse de Doctorat d'État, UCAD, FLSH, Département de Géographie 1232 p. |
|
|
Sperna Weiland FC, van Beek LPH, Kwadijk JCJ, Bierkens MFP (2010). The ability of a GCM-forced hydrological model to reproduce global discharge variability. Hydrology and Earth System Sciences 14(8):1595-1621. |
|
|
Spinoni J, Barbosa P, Bucchignani E, Cassano J, Cavazos T, Christensen JH, Christensen OB, Coppola E, Evans J, Geyer B, Giorgi F, Hadjinicolaou P, Jacob D, Katzfey J, Koenigk T, Laprise R, Lennard CJ, Kurnaz ML, Li D, Llopart M, Mccormick N, Naumann G, Nikulin G, Ozturk T Panitz HJ, Da Rocha RP, Rockel B, Solman SA, Syktus J, Tangang F, Teichmann C, Vautard R, Vogt JV, Winger K, Zittis G, Dosio A (2020). Future global meteorological drought hot spots: a study based on CORDEX data. Journal of Climate 33(9):3635-3661. |
|
|
Vissin EW (2007). Impact de la variabilité climatique et de la dynamique des états de surface sur les écoulements du bassin béninois du fleuve Niger, Thèse De Doctorat 310 p. |
|
|
Zhao C, Brissette F, Chen J, Martel JL (2019). Frequency change of future extreme summer meteorological and hydrological droughts over North America, Journal of Hydrology 11 p. |
|
|
Zhao C, Brissette F, Chen J, Martel JL (2020). Evolution of future extreme drought frequency in two climate model large ensembles, EGU General Assembly 2020, Online, 4-8 May 2020, EGU2020-11449, |
|
Copyright © 2024 Author(s) retain the copyright of this article.
This article is published under the terms of the Creative Commons Attribution License 4.0


