Full Length Research Paper

ABSTRACT
This study applied Log-Pearson Type III probability distribution to model time series annual peak flow records of River Niger recorded at Lokoja gauging station. This was necessitated by the need to provide reliable data for safe and economic hydrologic design for security of lives and property at downstream of river Niger basin. Though several methods have been adopted in the study area for flood mitigation, however, it has become apparent that these measures are inadequate and no attempt has been made to apply statistical approach for provision of sustainable solution. Though flood cannot be prevented but the impact can be reduced by applying adequate counter measures. Therefore, this study shows the result of flood frequency analysis based on annual peak flow measurement covering a period of 18 years (1995-2012) carried by National Inland Water Ways (NIWA) at Lokoja gauge station. The probability distribution function was applied to return periods (T) of 2, 5, 10, 25, 50, 100 and 200 years. The predicted discharges corresponding to these return periods are 18886.065, 22425.127, 24889.683, 28145.456, 30670.104, 33281.363 and 35997.757 m3/s, respectively. This study also revealed that the return period of 2012 flood is over 50 years. The predictive model which relates the expected discharge to return period is given by X = 3679.7 In(R) + 16381 where X is the expected discharge and R is the return period.
Key words: Flood, return periods, discharge, prediction, hydrologic design.
INTRODUCTION
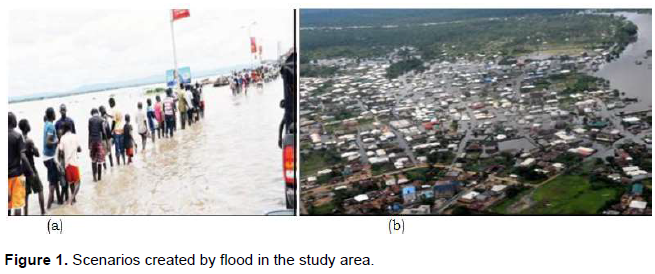
Flooding is one of the major environmental crises one has to contend of within the century. Flooding is defined as a large amount of water covering an area that was usually dry (Emmanuel and Ojinnaka, 2015). Daniela et al. (2018) reported that flood take place when the river exceeds its storage capacity and the water excess over flows the banks and ï¬lls the adjacent low-lying lands. Mukoro et al. (2015) argued that flooding is considered the worst global hazard in terms of magnitude, occurrence, geographical spread, loss of life and property, displacement of people and socio-economic activities. Pedro et al. (2019) also noted that river flooding is a specific worldwide type of hazard responsible for considerable human and material losses. Apart from overflows of the rivers, floods maybe caused by failure of some hydraulic structures such as dams or sudden release of huge amount of water as the case of 2012 flood in Nigeria that hits Lokoja in Kogi State which was partly attributed to the release of water from Lagdo Dam in Cameroon. It caused enormous damages to lives and property in many states bordering river Niger Benue basin and was considered as the worst event in the study area and the entire Nigeria since over half a century. Figure 1a and b shows scenarios created by 2012 flood in the study area. However, Lin et al., (2019) reported that flooding is a common type of natural hazard caused by intense rainfall. Knowledge of time of arrival of flood events improves safety and is important for a variety of planning. It allows precautionary measures to be taken and people to be warned so that they can be prepared in advance for flooding conditions. Since man do a lot of activities on the flood plain, it is important that he predict flood and protect his environment in other not to be caught unawares. Though the occurrence of future flood cannot be prevented but the magnitude of impact can be reduced by developing opposite flood counter measures. In the past, some of the structures used to control flood within the study area include levees, reservoir and channel improvement. With the current situation, it has become clear that these methods are in-adequate therefore the need for a more reliable approach. As much of the hydrologic data like flow rate (discharge) and rainfall are statistical in nature, statistical methods are most frequently needed to be used with the goal of fitting a statistical distribution to the data (Prasuhn, 1992). For economic and efficient design of these measures, discharge has to be estimated with some level of accuracy. Once accurate prediction of flow of certain magnitudes is made, an ideal solution can then be proffered by a hydraulic Engineer (Haan, 1977; Okonofua and Ogbeifun 2013). Hydrological data such as rate of flow and rainfall are used to design engineering structure to mitigate flood as structures which are not design to withstand major events might be destroyed by them (Ibrahim and Isiguzo, 2009). Design flood is the discharge selected for the design of a hydrological structure (Izinyon and Igbinoba, 2011). The time between floods of similar size is the return interval. Its procedure only works well for basins that have long enough stream flow records to warrant statistical analysis. The objective of frequency analysis of hydrologic data is to relate the magnitude of extreme events to their frequency of occurrence using probability distributions. The frequency or probability of a flood usually is described by assigning a recurrence interval to the flood at each gauging station. This is accomplished by statistically evaluating long-term annual peak stream flows at that station. For example, a 100-year flood-recurrence interval means that, in any given year, a flood of a specified stream flow magnitude has a 1-in-100 chance of happening. Flood frequency analysis is generally taken to denote a statistical analysis of flood, their magnitudes and their frequencies (occurrence rates in time). Whereas, structures like culverts, storm drainage systems can be designed for relatively small floods (more frequent floods), structures such as dams, spillways, retention ponds, etc., which cause huge loss of life and property are designed for relatively more severe floods which have relatively longer return periods. Therefore, to select a design flood, which is not likely to occur during the life of a hydrologic structure, the design return period (T) should be much greater than the estimated life of the structure, that is, the difference between the design return period and the estimated life of the structure should be quite large (Izinyon and Igbinoba, 2011). Because flood risk estimation is an inherently statistical problem, to derive the risk of occurrence of any flood event, the frequency distribution which can best describe the past characteristics of the magnitude and the possibility of such flood must be known and this requires determination of the most appropriate flood frequency model which can be fitted to the available historical data or record. Whole group of models such as simple linear regression, Gumbel (EV-1), Normal, Log normal, Pearson Type III, Log-Pearson Type III, Weibull equation, etc., have been suggested in literature for the prediction of extreme flood events however, this study adopted Log-Pearson Type III probability distribution because it is widely suggested in literature as the most suitable method.
Significance of the study
Whenever disasters of great magnitudes occur in a country, efforts are usually made to prevent future occurrences where possible, or at least minimize the impacts through various preventive programs and mechanisms. Although Lokoja is regularly, under the influence of flash flood due to its location in the valley of the confluence of River Niger and Benue but the unprecedented 2012 flood event has been describe is the worst in over half a century. Some parts of the area inundated for more than four days during the episode with an average water height of 3 m. Some of the existing structures used to control flood in the study area are leaves, reservoir and channel improvement yet, the problems are unabated. Therefore, it has become apparent that these measures are inadequate to handle the situation. However, for any method to be effective, return periods of extreme flood events and data for designing of such hydraulic structures must be known and provided. In general, flood frequency analysis provides appropriate data for sustainable planning in flood-prone areas.
Aim and objectives
The aim of this study is to carry out flood frequency analysis at Lokoja gauge station using Log-Pearson Type III distribution.
Objectives
To predict discharge for the following return periods (T= 2, 5, 10, 25, 50, 100 and 200 years). To provide data for construction of hydrologic structure at Lokoja for protection of life and property during flood disaster. To estimate the return interval of 2012 flood hazard.
Study area
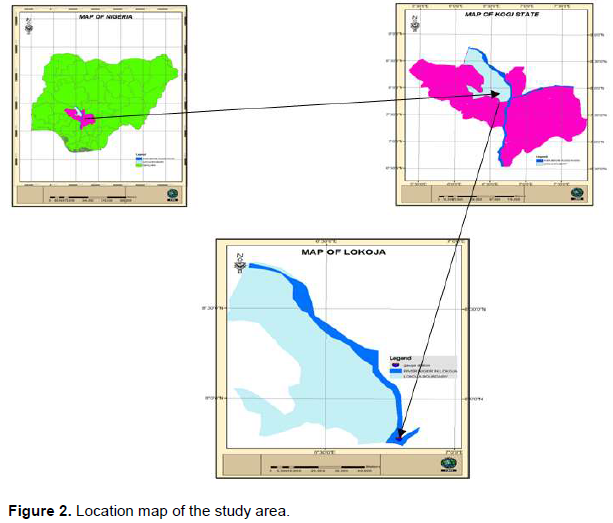
The gauging station from which the data for this study was collected is located along River Niger in Lokoja. Geographically, it is located at latitude 07°52’ 12.68979’’N and longitude 06°46’ 29.74729’’E. Lokoja is the capital city of Kogi State in the north central part of Nigeria and is also a Local Government area in kogi State. It measures approximate 3180 km² with a population of 195,261 based on the 2006 census. Lokoja drives its name from two Hausa words, a tree and a color. “Loko” which means Iroko and “Ja” which means “Red” so the word Lokoja means Red Iroko tree. The area enjoys both wet and dry seasons with a total annual rainfall between 1000 and 1500 mm. Mean annual temperature is about 27.7°C and a relative humidity of 30% in dry season and 70% in wet season. Average daily wind speed is 89.9 km/h. Wind speed is usually at its peak in March and April. The most important hydro-geological features are River Niger and the confluence of River Niger and Benue. The largest river in Nigeria (river Niger) flows through Lokoja but it is under-utilized for transportation even irrigation (Figure 2).
Statistical background
Pearson (1930) proposed a general formula that fits many probability distribution including the normal, beta and gamma distribution. A form of the Pearson probability distribution called the Pearson Type III has three parameters that include the skew coefficient, as well as the mean and standard deviation (Izinyon and Igbinoba, 2011). The Log-Pearson Type III distribution is a statistical technique for modeling hydrological data. Once the past hydrological events are properly modeled, and the required statistical information calculated for the river site, a frequency distribution can be constructed. The probabilities of floods of various magnitudes can be predicted from the resultant discharge frequency curve. The Pearson Type III distribution is represented by Equation 1.

where (k) is frequency factor determined from tables. The model parameters, that is, the mean  , standard deviation (∂) and the Skewness coefficient (CS) is computed from (n) observations of (X) with the following formulas:
However, the Log-Pearson Type III distribution of X which was adopted in this study has been widely adopted to reduce skewness. It is equivalent to applying Pearson Type III to the transformed variable log X (Jagadesh and Jayaram 2009; Wurbs and James 2009,).It is represented by Equation 5:
METHODOLOGY
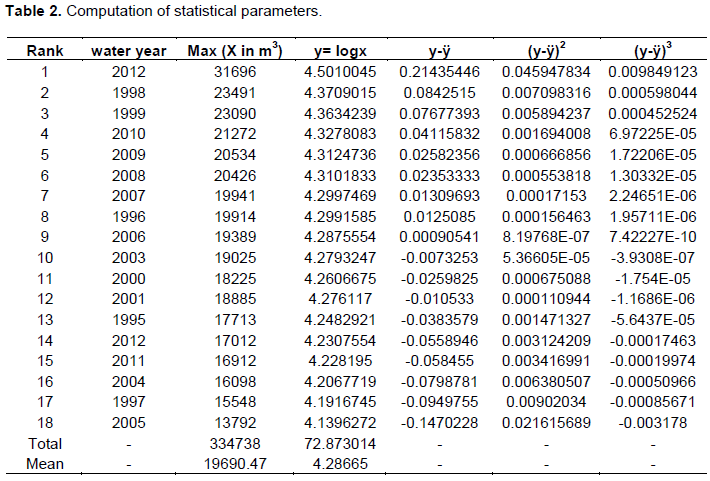
In this study, Log-Pearson Type III probability distribution was used to model the annual peak discharges of River Niger for the period of 1995 to 2012 based on river flow measurement carried out by National Inland Waterways Authority (NIWA) at Lokoja gauging station. Time series annual flood peaks covering a period of 18 years were arranged in a descending order of magnitude (Table 1). The dataset was subjected to statistical study and basic statistical parameters (mean, standard deviation and skewness coefficient) needed from these historical records were computed using Equations 6, 7 and 8. The numeric values of these statistics were used to construct a flood frequency table using Equation 5 and discharges for various return interval were estimated. In Equation 5, X is the flood discharge value of some specified probability,  is the average of the log x values, that is, discharge values, K is a frequency factor, and
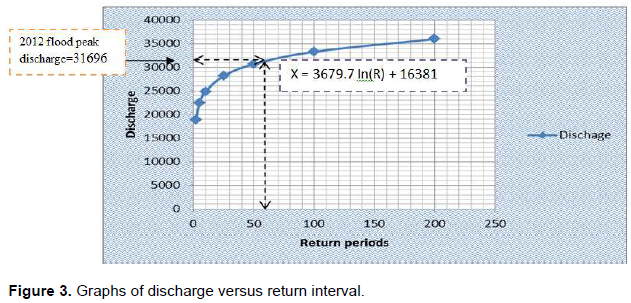
  is the standard deviation of the logx values. The frequency factor is a function of the skewness coefficient and return period and was reduced using frequency factor table. In carrying out the flood frequency analysis using Pearson Type III distribution, annual flood (x) time series data were assembled and logarithms of the dataset were calculated as y = logx. Progressively, the mean (y), the standard deviation (δ) and skewness coefficient (Csy), of the logarithm (y) were calculated. Flood discharges (X) for various probability levels (return periods) were obtained by taking antilogarithm of Logx values. A graph of the predicted discharge against return interval was produced and the return interval of the 2012 flood was scaled out. From the equation of the curve fit, that is, X = 3679.7 In(R) + 16381; other discharge for return periods not included in the series can be estimated. Where R is return interval.
RESULTS
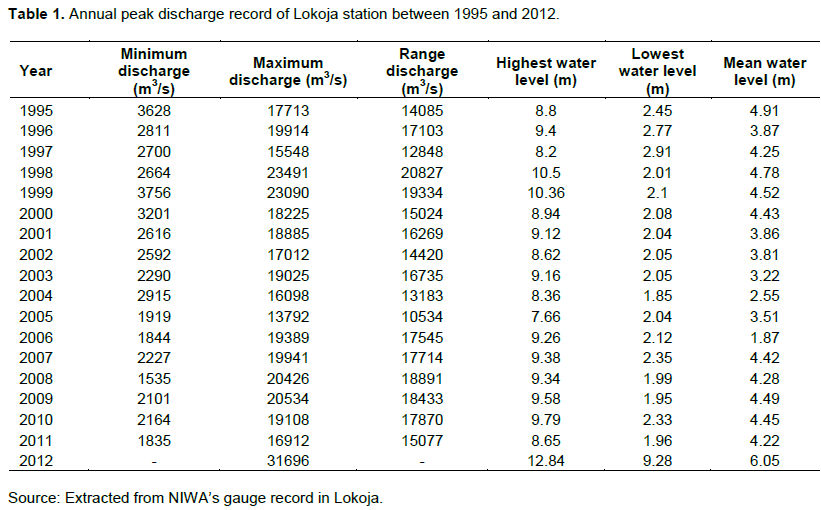
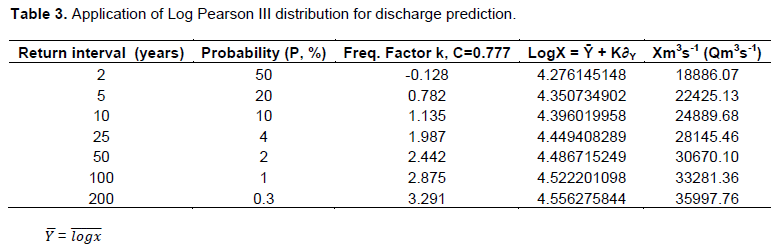
The peak and minimum annual discharges of River Niger between 1995 and 2012 based on daily discharge measurement carried by national inland ways (NIWA) at Lokoja gauging station is shown in Table 1. The various statistics (mean, skewness, standard daviation) from the analysis of the peak discharge data as noted in the methodology are statistically derived from Table 2. Table 3 reveals the application of Log-Pearson Type III statistical model for discharge prediction. Figure 3 shows the graph of the predicted discharges versus the corresponding return periods (Frequencies). From the graph, the 2012 flood return period and the predicted equation were estimated.
DISCUSSION
The annual flow records of River Niger obtained from the analysis of daily discharge measurement from 1997 to 2012 by National Inland Water Ways (NIWA) is presented in Table 1. The statistical paramaters, that is, mean  , coefficient of skewness, (Cs ) and standard daviation (∂) of the time series hydrological data are 0.079475301, 0.777 and 4.28665, respectively. These statistics were estimated from Table 2 using Equations 6, 7 and 8, respectively. Table 3 contains the result of the food frequency analysis. Column 1 contains the return intervals (frquency of occurence) and column 5 contains the corresponding expected discharge. As can be seen in the table, the expected stream discharges for return periods (frequencies) of 2, 5, 10, 25, 50, 100 and 200 years are 18886.07, 22425.13, 24889.68, 28145.46, 30670.10, 33281.36, and 35997.76 m3s-1 respectively. It can be seen that smaller flows has higher possibility of occurrence than larger ones. For example, Table 3 shows that flows of magnitudes 18886.071 and 35997.76 m3s-1 have the possibilities of occurring once (frequency) in every 2 and 200 years, respectively. These statistical derivatives are invaluable when selecting design flood for the construction of hydrologic structure and when designing other structures that may be affected by flood within the study area. From the time series hydrological records in Table 1, it can be seen that values of discharge (31696 m3/s) and water level (12.84 m) in 2012 which resulted to flooding was very alarming. It is also the highest in the data series therefore the need to estimate its return period. Figure 3 is a plot of return periods versus predicted discharges. From the graph, it can be seen that the return interval of 2012 flood is above 50 years. The model which relates the expected discharge (X) to return period (R) in the catchment is given by X = 3679.7 In(R) + 16381. With this model, the discharge for other return periods not covered in this paper can be estimated. These results are useful in the engineering design of hydrologic structures in the catchment for flood mitigation.
CONCLUSION
The paper shows the result of flood frequency analysis based on annual peak flow measurement covering a period of 18 years (1995-2012) carried out by National Inland Water Ways (NIWA) at Lokoja gauge station. We are aware that heavy discharges into the water channels often generate pressure on Dams and other hydrological structures resulting to their collapse when poorly designed and constructed. Based on the available hydrological records, future discharges of various magnitudes and their frequencies were statistically estimated in this study. The plot (Figure 3) also gives the relationship between the anticipated flows (discharge) and return period as: X = 3679.7 In(R) + 16381. With this statistical model other discharge of return period not included in this study can be estimated. These and other values obtained are invaluable for engineering design of hydrological structures such as levees, retention pond, storm water drains, culverts and reservoirs for protection of life and properties downstream of the catchment. It also serves as a guide when designing and constructing structures that might be affected by flood within the study area.
RECOMMENDATIONS
It is recommended that adequate attention be given to the acquisition of hydrological data in rivers for accurate hydrological modeling; besides the use of digital recording equipment is recommended to reduce human errors in hydrological data capture. It is also recommended that information derived from this research be used for effective design of hydrological structures within the study area and also for precautionary measures as this will minimize the impact of flood disaster within the study area. Besides, similar studies should be carried in other catchments in Nigeria as a flood disaster reduction measure.
CONFLICT OF INTERESTS
The authors have not declared any conflict of interests.
REFERENCES
|
Daniela R, Usman TK, Costas A (2018). Flood Risk Mapping Using GIS and Multi- Criteria Analysis: A Greater Toronto Area Case Study. Geosciences 8(8):275. |
|
|
Emmanuel UA, Ojinnaka OC (2015). Flood Hazard Analysis and Damage Assessment of 2012 Flood in Anambra State using GIS and Remote Sensing Approach. American Journal of Geographic Information System 4(1):38-51. |
|
|
Haan CT (1977). Statistical Methods in Hydrology. Lowa State University Press Iowa pp. 87-101. |
|
|
Izinyon OC, Igbinoba E (2011). Flood Frequency Analysis of Ikpoba River Catchment at Benin City using Log Pearson Type III Distribution. Journal of Emerging Trends in Engineering and Applied Sciences 2(1):50-55. |
|
|
Ibrahim MH, Isiguzo EA (2009). Flood Frequency Analysis of Guara River Catchment at Jere, Kaduna State, Nigeria. Scientific Research and Essay 4(6):636-646. |
|
|
Jagadesh TR, Jayaram MA (2009). Design of bridge Structures. 2nd Edition. PHI Learning PVT Ltd, New Delhi India. |
|
|
Lin L, Zening W, Qiuhua L (2019). Urban flood susceptibility analysis using a GIS‑based multi‑criteria analysis framework. Natural Hazards 97(2):455-475. |
|
|
Mukoro EE, Agunbiade S, Yakubu M (2015). Hydraulic Relationships of the Ikpoba River for Flood Studies. Civil and Environmental Research 7(7):61-66. |
|
|
Okonofua S, Ogbeifun P (2013). Flood Frequency Analysis Osse River Using Gumbel's Distribution. Civil and Environmental Research 3(10):55-59. |
|
|
Prasuhn A (1992). Fundamentals of Hydraulic Engineering. Oxford University Press New York. |
|
|
Pedro PS, Eusébio R, Susana P, Mónica S (2019). A flood susceptibility model at the national scale based on multicriteria analysis. Science of the Total Environment 667:325-337. |
|
|
Wurbs RA, James WP (2009), Water Resources. Engineering, PHI Learning Private Ltd. New Delhi, India |
|
Copyright © 2024 Author(s) retain the copyright of this article.
This article is published under the terms of the Creative Commons Attribution License 4.0


