Full Length Research Paper

ABSTRACT
Concentrated animal feeding operations (CAFOs) contain large quantities of dairy cows and therefore have the potential to contribute significant amounts of harmful waste products to the environment. Although previous studies have used geospatial tools to assess potential contaminant runoff, the results from these studies are dependent on the unique geographical characteristics of specific regions. This study incorporated geographical characteristics unique to California to: 1) characterize the distribution of dairy CAFOs in California; and 2) determine and compare the potential for dairy CAFOs in high vs. low runoff potential regions in subject counties to contaminate surface water. The CAFOs were grouped by their location in either high or low runoff potential regions characterized by Curve Number (CN) grids. The potential for the CAFOs in either group to contaminate surface water was determined by calculating the proportion of CAFOs with runoff that intersected with surface water. Among the CAFOs in high runoff potential regions, 180 out of 193 facilities had the potential to contaminate surface water. This proportion was found to be significantly different from the proportion of CAFOs in low runoff potential regions (p=0.023), indicating validity of the CN grids used to approximate runoff potential.
Key words: Concentrated animal feeding operation (CAFO), dairy, water pollution, geographic information system (GIS), curve number (CN) grids
INTRODUCTION
Concentrated animal feeding operations (CAFOs) contain large quantities of livestock and therefore have the potential to contribute significant amounts of waste products to the environment (Environmental Protection Agency, 2010). California has the highest number of dairy CAFOs out of all 50 states (Sherman, 2008). Moreover, dairy CAFOs in California pose a threat because they are clustered (Sherman, 2008). This raises a public health concern to the communities surrounding the clusters, as numerous studies indicate that contaminants present in the excrement of dairy cows housed in CAFOs are harmful to humans. Escherichia coli, estradiol, and nitrogen compounds in particular have been associated with gastrointestinal illness, breast cancer, and hyperthyroidism, respectively (Cabelli et al., 1982; van Maanen et al., 1994; Bendrik and Dabrosin, 2009).
Agricultural use of dairy cow excrement as fertilizer may contaminate runoff from rain events. This runoff can then contaminate surface waters including lakes, rivers, streams, estuaries, reservoirs, and swamps. Manure is often applied to crop or pasture land as the primary disposal method for CAFO farmers. Farmers report that moving manure from the facilities to an adequate landfill is a financial burden (Aillery et al., 2005). The use of dairy cow excrement as an agricultural fertilizer increases the likelihood of surface water contamination, as farmers do not typically assess risk factors such as slope and proximity to surface water when applying manure (Kolpin et al., 2002). Individuals may then be exposed to the contaminants through accidental ingestion in recreational and occupational settings (Aillery et al., 2005; Mitloehner and Calvo, 2008). Children and elderly living in close proximity to the CAFOs are at higher risk of exposure (Burkholder et al., 2007).
The health consequences of exposure can be severe, so it is important to understand the mechanisms of surface water contamination. Studies have shown that slope and proximity influence the degree of surface water contamination (Dabrowski et al., 2002; De Winnaar et al., 2007). This is not surprising, as runoff flows from high to low elevation, and a shorter distance between a CAFO and the receiving surface water will likely decrease the amount of movement-impairing factors such as vegetation and residential housing that the runoff may come in contact with (De Winnaar et al., 2007).
Soil content may also affect the degree of surface water contamination. Common contaminants present in dairy cow excrement, such as E. coli, estradiol, and nitrogen compounds, have all been shown to be affected by soil content in terms of both quantity and toxicity. For example, estradiol degrades faster in soils with higher organic carbon content and loses its ability to bind to the soil. This decreased soil absorption increases the amount of free estradiol that can contaminate nearby surface water. A similar relationship is applicable to E. coli and nitrogen compounds (Noborio et al., 2003; Karthikeyan et al., 2005; Khanal et al., 2006; Semenov et al., 2009; Hamid and Eskicioglu, 2012).
Mitigation through regulatory action
Despite increasing evidence of surface water contamination by CAFOs, risk management strategies have been imposed with minimal success. The final CAFO rule was enacted in 2003 by the United States Environmental Protection Agency (EPA) to require more CAFOs to secure National Pollutant Discharge Elimination System (NPDES) permits unless they could demonstrate they had no potential to discharge as a “point source” of pollution (Centner, 2007). However, in the Water keeper Alliance, Inc. v. Environmental Protection Agency (2005) case, the Court of Appeals (D.C. Circuit) found that the Clean Water Act (CWA) grants the EPA jurisdiction to regulate and control actual discharges, but not facilities that have the potential to discharge (Centner and Newton, 2011). In response, the EPA rewrote its provision to address the proposals to discharge determined by the design, construction, and operation of a CAFO, but this was objected to again in National Pork Producers Council v. EPA (2011) on the basis that the EPA exceeded the authority given to them by the CWA (Centner and Newton, 2011).
Many studies have used Geographic Information System (GIS) tools to determine if runoff has the potential to contaminate water bodies (Tong and Chen, 2002; De Winnaar et al., 2007). A common approach includes inputting digital elevation, land cover, and soil data to generate Curve Number (CN) grids that depict runoff potential (De Winnaar et al., 2007; Shukur, 2017). However, the results from studies that used this method are derived from unique geographical characteristics of specific regions and therefore cannot be generalized to California. Furthermore, to our knowledge, no study has used CN grids to measure the potential for dairy CAFOs to contaminate surface water bodies.
This study used GIS tools and California county-level geography data to determine if elevation, proximity, land cover, and soil content surrounding dairy CAFOs in California present a risk to the state’s surface water bodies. Due to lack of available soil data for the entire state, counties with the highest density of dairy CAFOs and sufficient soil data were identified and their respective CN grids were created using the Hydrologic Modeling System (HEC-HMS) 4.2.1 extension designed by the United States Army Corps of Engineers (USACE). The CAFOs were grouped according to their location in either high or low runoff potential regions using the HEC-HMS extension in ArcMap 10.5.1 (Esri, Redlands). The potential for the CAFOs in either group to contaminate surface water was assessed by calculating the proportion of CAFOs with runoff that intersected with surface water. The two proportions were tested for statistically significant difference as a test of the validity of the HEC-HMS extension using Fisher’s exact chi-square test. The aim of this study was to assess the severity of the threat that runoff from dairy CAFOs in California presents to the state’s surface water bodies, and to promote the implementation of more stringent regulations to protect individuals who may come in contact with contaminated surface water.
METHODS
Geocoding
Dairy CAFO addresses (N=1,334) were acquired from the California Department of Public Health (CDPH). The address list was converted to coordinate points using the Geocode tool in ArcGIS Pro 10.2 (Esri, Redlands) which utilizes the Esri World Geocoding Service (WGS). One facility in France with a permit held by a company in the United States was removed from the study. Out of the 73 locations with low match statistics score (≤ 77), 27 were randomly picked and checked for accuracy in Google Earth Pro (Google, Mountain View). Two of the checked locations and three other visibly inaccurate locations were determined to be erroneous and the appropriate coordinates were manually obtained using Google Earth Pro. The remaining facilities were projected in WGS_1984_Web_Mercator_Auxillary_Sphere in ArcMap 10.5.1 on top of a California county boundaries layer obtained from the MAF/TIGER database of the United States Census Bureau and were visually verified to be located in California.
Dairy CAFO hotspots
The distribution of dairy CAFOs shown in the previous report from the California Department of Food and Agriculture (CDFA) pointed to the existence of hotspots (areas that have significantly high dairy CAFO densities) (California Department of Food and Agriculture, 2016). The Kernel Density tool was used in ArcMap 10.5.1 to identify counties in California that may be characterized as dairy CAFO hotspots. In kernel density, each point site is given a surface value that is highest at the location of the point and diminishes with increasing distance from the point. The density at each output raster (grid) cell is calculated by adding the values of all the surfaces where they overlay. Visually, the resulting map depicts hotspots of dairy CAFOs in California. Dairy CAFOs in the counties part of a hotspot were grouped according to their respective counties using the Clip tool in ArcGIS 10.5.1.
Classification of CAFOs by runoff potential region
To classify the different runoff potential regions in each county, SCS CN grids were generated using the HEC-HMS 4.2.1 extension designed by the USACE. The HEC-HMS extension considers the relationship between slope, land cover, and hydrologic soil group to create CN grids that depict the degree of surface runoff in a given area (Schulze et al., 1992; Gangodagamage 2001). Curve numbers vary from 30 to 100, where greater curve numbers represent a greater potential for surface runoff (Schulze et al., 1992; Stuebe and Johnston, 2007).
The underlying Digital Elevation Model (DEM) data for the CN grids were obtained through the National Map Viewer made available by the United States Geological Survey (USGS). All the DEM data used in the study had a resolution of 10 m (last updated in 2016).
County-level soil data were obtained from the Web Soil Survey of the United States Department of Agriculture (USDA). The Soil Data Viewer extension built by the USDA was used in ArcMap 10.5.1 to extract hydrologic soil group data from the original dataset. Each hydrologic soil group dataset consists of regions classified into groups A, B, C, or D, where each letter denotes the hydrologic soil group they belong to. Each hydrologic group is associated with different soil content and degree of runoff. Groups A, B, C, and D have low, moderately low, moderately high, and high runoff potential, respectively (Mockus, 2007).
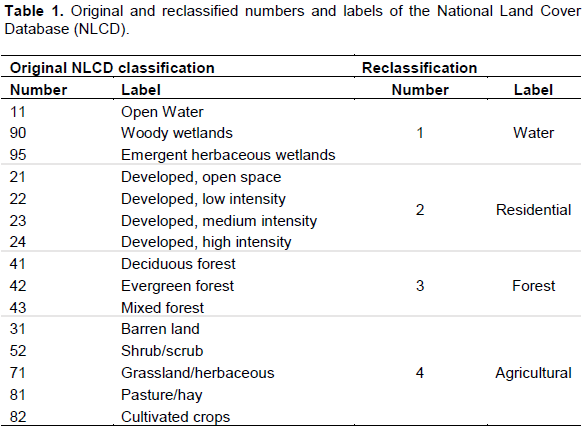
The National Land Cover Database (NLCD) 2011 with a resolution of 30 m was obtained from the Multi-Resolution Land Characteristics (MRLC) Consortium. The national-level data were reduced to county-level data using the Clip Raster tool in ArcMap 10.5.1. The original data consisting of regions classified into 15 NLCD classifications were simplified into four reclassified regions: 1=water, 2=residential, 3=forest, or 4=agricultural (Table 1) (Merwade, 2012). The reclassified raster data were then converted to polygons using the Raster to Polygon tool to conform to the data requirements of ArcGIS 10.5.1 Spatial Analyst tool.
A lookup table that assigned each hydrologic group to different percentages of the four land cover classifications was used to link the soil data with the land cover data (United States Department of Agriculture, 1986). The DEM, soil content, and land cover data along with the lookup table were inputted into the HEC-HMS extension to generate the final CN grids for the subject counties. Merced County, one of the four counties chosen for analysis from Kernel Density, was eliminated from the study due to lack of soil data.
In order to determine which of the CAFOs were located in regions with high or low runoff potential, the CN grids were reclassified to low, moderate, and high runoff potential regions based on their curve numbers. The cutoff curve numbers were determined by using natural breaks classification in ArcGIS 10.2.1. The natural breaks classes are based on natural groupings inherent in the data distribution and maximize the differences between classes. Because there is no established cutoff value for different degrees of runoff, the use of natural breaks allowed for the best estimation of the cutoff curve numbers. All three CN grids (one per county) produced breaks to create three ranges: 30-72, 72-83, and 83-100. There were small variations in the decimal values of the ranges, so the cutoff values were manually set to 72 and 83 in order to eliminate small differences between the three counties.
The reclassified CN grids were converted to polygons in order to spatially join them with the CAFOs. The spatial join counted the number of CAFOs that were located in low, moderate, or high runoff potential regions for each county. The CAFOs were classified by runoff potential region and the proportion of CAFOs located in either high or low runoff potential regions was recorded.
Proportion of CAFOs with the potential to contaminate
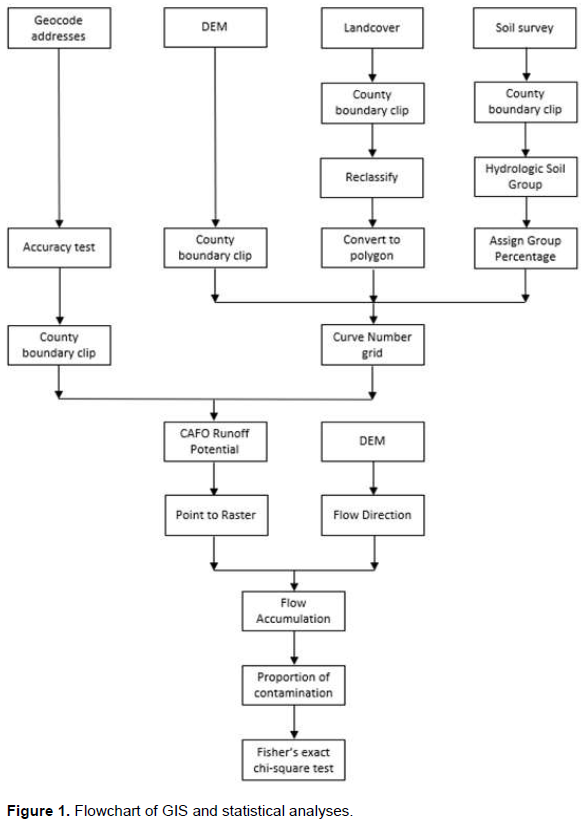
Dairy CAFOs in high or low runoff potential regions were used as the starting points in the Flow Accumulation tool in ArcGIS 10.2.1. The Flow Accumulation tool calculates the accumulated weight of all cells flowing into each downslope cell in the output. The exact direction of flow was determined using the DEM data to create Flow Direction layers (Figure 1). The resulting areas of concentrated flow represented runoff from the individual CAFOs.
All runoffs were overlaid with a California surface water layer obtained from the National Hydrography Dataset Plus Version 2 (NHDPlusV2) dataset maintained by the EPA in partnership with the USGS. The original layer, which covered the entirety of California in a resolution of 30 m, was converted and clipped to separate county boundaries. For each of the subject counties, potential runoff from dairy CAFOs in either high or low runoff potential regions was assessed by calculating the proportion of CAFOs with runoff that intersected with surface water. A cumulative proportion was then recorded for both groups of CAFOs from the proportions calculated for each of the subject counties. Because the unit of analysis was not on the county-level, it was appropriate to combine the proportions calculated from each county. In this study, county boundaries were used as arbitrary boundaries identified by the Kernel Density tool and did not affect the research question.
Test for statistical significance
A table consisting of two variables “Runoff potential region - high/low” and “Intersection - yes/no” (N=243) was created in Microsoft Excel (Microsoft, Redmond WA) and read into Stata 15 (StataCorp, College Station) to test for a statistically significant difference in the proportion of CAFOs, in either high or low runoff potential regions that had the potential to contaminate surface water. Expected values for each cell were calculated to test for eligibility for Pearson’s chi-square test. One of the cells did not meet the criteria (N>5) so Fisher’s exact chi-square test was used instead. A probability value (p) of 0.05 was used to determine statistical significance.
The test was conducted to check for the validity of the HEC-HMS extension used to classify the CAFOs by the type of runoff potential region they were in. The absence of a statistically significant difference would indicate that the high and low runoff potential regions generated by the HEC-HMS extension were inaccurate and did not differ in runoff potential.
RESULTS
Dairy CAFO hotspots
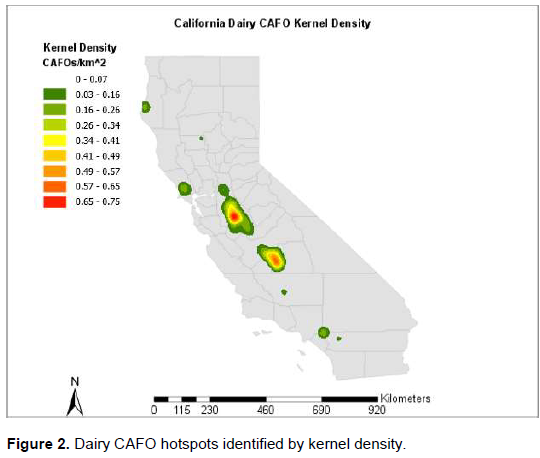
Two prominent hotspots were identified from the Kernel Density analysis. One hotspot stretched over Stanislaus and Merced Counties with a range of 25 to 29 dairy CAFOs per 100 square miles. The other hotspot stretched over Tulare and Kings Counties with a range of 22 to 25 dairy CAFOs per 100 square miles (Figure 2). There were seven other hotspots over Sonoma, Marin, Humboldt, Sacramento, Glenn, Kern, San Joaquin, Riverside, Los Angeles, Orange, and San Bernardino Counties. These hotspots had a significantly lower range (three to nine) of dairy CAFOs per 100 square miles and were omitted from the study.
Classification of CAFOs by runoff potential region
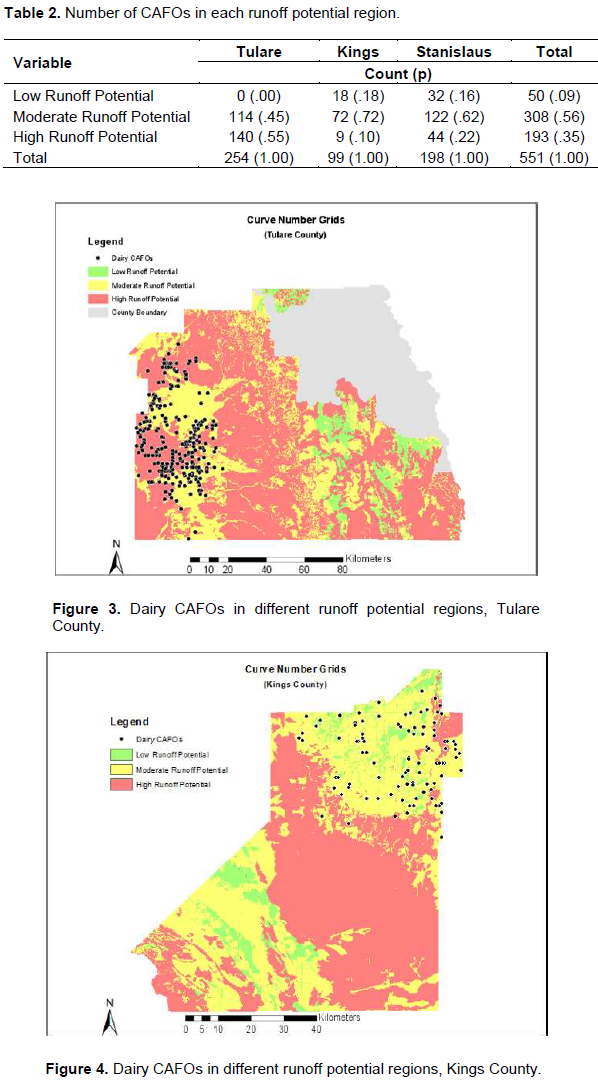
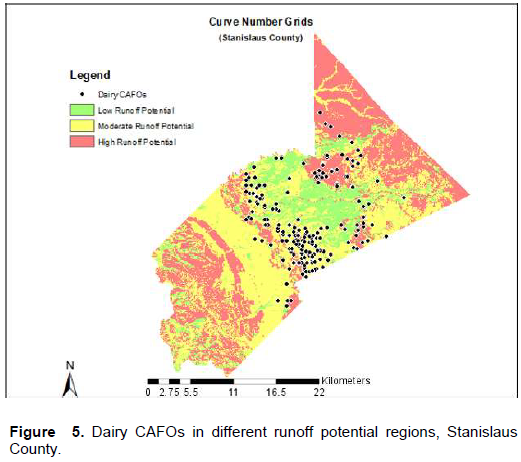
Out of the three counties with the highest density of dairy CAFOs, Tulare County had the highest number (N=140) and proportion (0.55) of dairy CAFOs in high runoff potential regions (Table 2). All CAFOs were located in the western half of Tulare County where low runoff potential regions did not exist (Figure 3). This was different in the other two counties, where the majority of the CAFOs were found to be located in low or moderate runoff potential regions. In Kings County, 18, 72, and nine CAFOs were located in low, moderate, and high runoff potential regions, respectively. These counts led to proportions of 0.18, 0.72, and 0.10 (Figure 4) (Table 2). Stanislaus County had a similar distribution with lower proportions of CAFOs in low and moderate runoff potential regions (Figure 5) (Table 2).
Proportion of CAFOs with the potential to contaminate
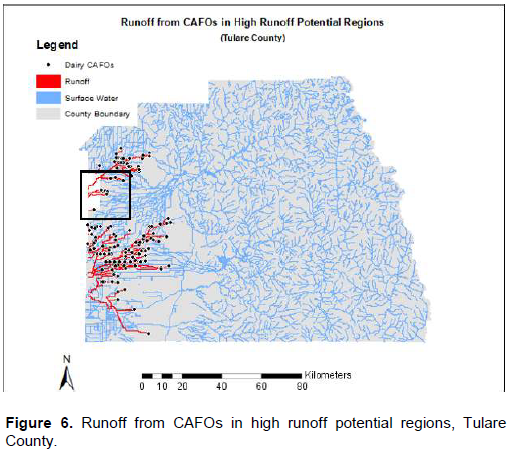
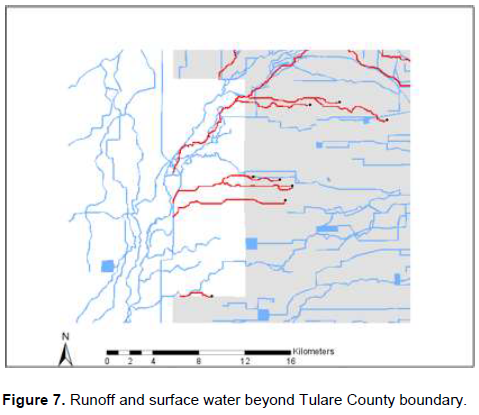
The dairy CAFOs in either high or low runoff potential regions in all three counties were exported separately and assessed for potential runoff. There were no CAFOs in low runoff potential regions in Tulare County. Out of the 140 CAFOs in high runoff potential regions, 131 had the potential to contaminate surface water (Figure 6). There was a small number of CAFOs (N=7) with runoff that flowed beyond the county boundary and the surface water beyond the boundary had to be considered to test for intersection (Figure 7). All of these CAFOs had runoff that intersected with surface water and were included as part of the 131 potentially contaminating facilities (Table 3).
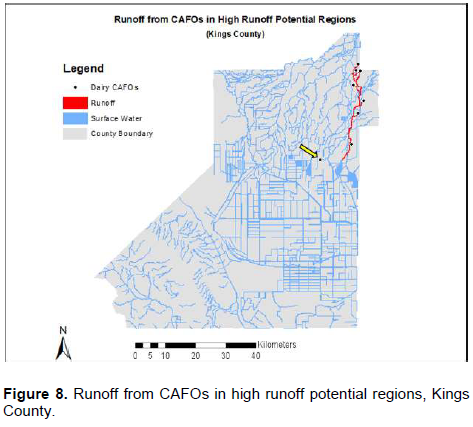
All of the runoff originated from CAFOs in high runoff potential regions in Kings County combined (Figure 8). Eight of the nine CAFOs (marked yellow in Figure 8) had the potential to contaminate surface water (Table 3).
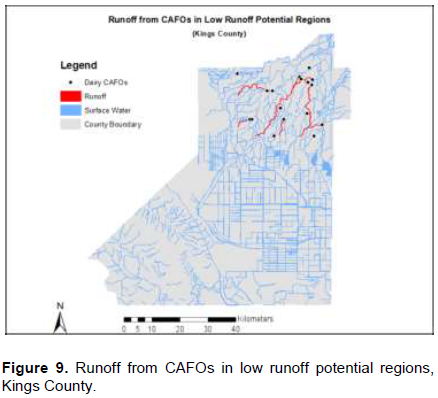
Runoff originating from CAFO in low runoff potential regions in Kings County did not always combine with one another (Figure 9). Out of the 19 CAFOs, 14 had the potential to contaminate surface water (Table 3).
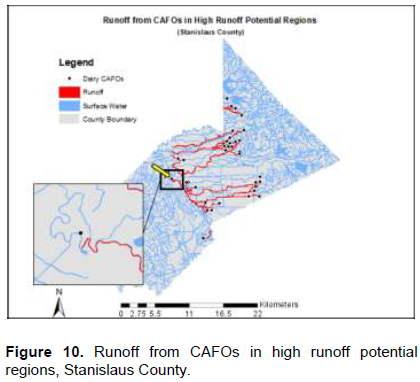
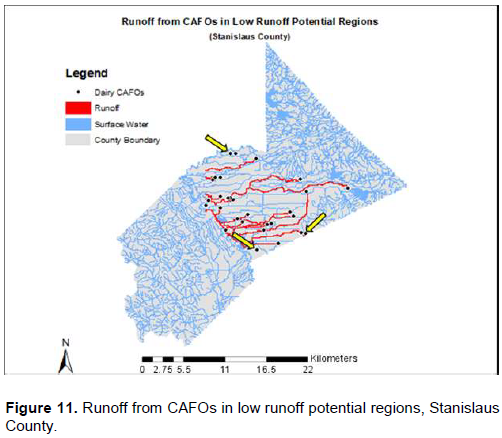
In Stanislaus County, the majority of the CAFOs located in high or low runoff potential regions were in the central region of the county where the surface water was relatively sparse compared to the upper and lower halves of the county. Among the CAFOs located in high runoff potential regions, 41 out of 44 had the potential to contaminate surface water (Table 3). One CAFO had runoff that did not fully emerge until approximately half a mile away from the facility (marked yellow in Figure 10). Among the CAFOs located in low runoff potential regions, 27 out of 32 had the potential to contaminate surface water (Table 3). Three facilities had runoff that did not intersect with surface water (marked yellow in Figure 11).
Test for statistical significance
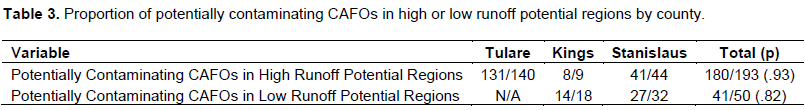
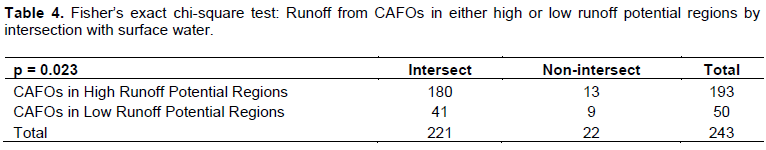
Fisher’s exact chi-square test was used to test for statistically significant difference in the proportion of potentially contaminating CAFOs located in either high or low runoff potential regions. In total, 180 out of 193 (93%) CAFOs in high runoff potential regions had the potential to contaminate surface water, whereas 41 out of 50 (82%) CAFOs in low runoff potential regions had the potential to contaminate surface water (Table 3). The difference in the two proportions was statistically significant with a p-value of 0.023. (Table 4)
DISCUSSION
The high proportion of potentially contaminating CAFOs in the high runoff potential regions was expected, but the proportion for CAFOs in the low runoff potential regions was surprisingly high and concerning. This high proportion may have resulted because surface water bodies in the subject counties were abundant and densely packed, causing many CAFOs with short distances to a surface water body to have the potential to contaminate surface water despite being in a low runoff potential region. The statistically significant difference in the proportion of potentially contaminating CAFOs located in either high or low runoff potential regions was indicative of the validity of the HEC-HMS.
Hotspot counties were identified first for two reasons: 1) soil data required to make the CN grids were not available statewide; and 2) The computational power and data required to process hydrologic models on a statewide level are not readily available. Although the CDFA posts annual data on dairy farm counts per county, these counts include smaller facilities that do not meet the definition of a CAFO and are not reliable indicators of CAFO hotspots. Identification of hotspots using dairy CAFO coordinate points allowed for a more accurate identification of hotspot counties. This knowledge also allowed for the use of smaller county-level data to run in-depth analyses that were not computationally possible with larger state-level data.
Previous studies have used similar methods to generate CN grids as indicators of runoff potential. De Winnaar et al. (2007) used CN grids along with distance to homes and crops to locate optimal runoff harvesting sites in the Thukela River Basin, South Africa, that would supplement water availability (California Department of Food and Agriculture, 2016). Although the methodology used to create the CN grids is similar, the aforementioned article directly used the CN grids to obtain the outcome. This study used the CN grids to group the CAFOs according to the type of runoff potential regions where they were located. The groups of CAFOs were then used to assess the outcome. Having an outcome (CN grids) that did not require prior knowledge of the location of the CAFOs was crucial in this study to understand what kind of runoff potential regions the CAFOs were located. Moreover, the outcome of interest in De Winnaar et al. (2007) involved specific sites to which the runoff ended up. This was in contrast to this study where the outcome was a proportion.
A similar study was undertaken by Lee et al. (2015) to predict estrogen runoff from swine Animal Feeding Operations (AFOs). Although AFOs have lower animal numbers than CAFOs, the concept of incorporating CN grids to study animal excrement-containing runoff supports the use of CN grids in this study. However, the CN grids in Lee et al. (2015) were a subpart of a Bayesian Network model that was dependent on the physical properties of their chemical of interest – estrogen (Lee et al., 2015). The degree of runoff observed with this approach can only be associated with estrogen and none of the other contaminants present in swine or dairy cow excrement. This study differed in that the identified runoff was unaffected by the specific physical properties of a single contaminant.
Unique to this study was the incorporation of a validity test. Due to the unique study area and design, there were no compatible comparisons in the current literature in which the validity of the outcomes could be assessed. The observed statistically significant difference in the proportion of potentially contaminating CAFOs increased the likelihood that the high and low runoff potential regions generated by the HEC-HMS extension were accurate and significantly differed in runoff potential.
A limitation of this analysis is that any potential runoff contaminating surface waters derived in this study were set to originate from the CAFO facilities and not the agricultural farms. Although the exact locations of the agricultural farms owned by CAFO owners are unknown, it is possible that some of the farms where manure is applied are distant from the CAFOs. Therefore, the results from this study cannot be linked to the concerns raised by agricultural reuse of dairy cow excrement as fertilizer unless the majority of manure-applied agricultural farms can be verified to be in close proximity to the dairy CAFOs. On the other hand, manure overflow from the CAFOs would minimize this concern. An additional study would be required to determine if an increase in runoff volume affects the proportion of dairy CAFOs with the potential to contaminate surface water, and if those CAFOs contribute higher concentrations of contaminants.
CONCLUSIONS
The CN grid results indicated that numerous high runoff potential regions exist in Tulare, Kings, and Stanislaus Counties. Out of the 551 dairy CAFOs in the three counties, 193 facilities were in high runoff potential regions and 50 facilities were in low runoff potential regions (Table 2). Identification of runoff from the CAFOs in either high or low runoff potential regions showed that 180 out of 193 (93%) CAFOs in high runoff potential regions had the potential to contaminate surface water, whereas 41 out of 50 (82%) CAFOs in low runoff potential regions had the potential to contaminate surface water (Table 3). Current legislation forbids the EPA from regulating CAFOs solely on the potential to contaminate surface water (Centner and Newton, 2011). Given the current evidence on the harmful health effects of prevalent contaminants in dairy cow excrement, it is crucial to monitor CAFOs and adjacent surface water bodies to ensure the safety of inhabitants living in close proximity to the facilities who rely on those water bodies as drinking water sources or recreational activity sites. This study presented evidence of the potential for dairy CAFO contaminant runoff in California and may serve as a foundation for future studies that would focus on monitoring the dairy CAFOs with the potential to contaminate surface water. Definitive evidence for contamination could facilitate regulatory action from the state government and encourage other states to consider monitoring of CAFOs relative to their potential to contaminate surface water bodies.
CONFLICT OF INTERESTS
The authors have not declared any conflict of interests.
ACKNOWLEDGEMENTS
The authors thank Heather Amato and Paul English at the California Department of Public Health for the CAFO data and Shruti Mukhtyar at Berkeley’s Geospatial Innovation Facility for technical advice. Many thanks to Elsbeth Sites for constructive comments on the manuscript, and to John Radke for his time and expertise to ensure the methodological validity.
REFERENCES
|
Aillery M, Gollehon N, Johansson R, Kaplan J (2005). Managing manure to improve air and water quality. United States Department of Agriculture. |
|
|
Bendrik C, Dabrosin C (2009). Estradiol increases IL-8 secretion of normal human breast tissue and breast cancer in vivo. The Journal of Immunology 182(1):371-378. |
|
|
Burkholder J, Libra B, Weyer P, Heathcote S, Kolpin D, Thorne PS, Wichman M (2007). Impacts of waste from concentrated animal feeding operations on water quality. Environmental Health Perspectives 115(2):308-312. |
|
|
Cabelli VJ, Dufour AP, McCabe LJ, Levin MA (1982). Swimming-associated gastroenteritis and water quality. American Journal of Epidemiology 115(4):606-616. |
|
|
California Department of Food and Agriculture (2016). California dairy statistics annual. |
|
|
Centner TJ, Newton GL (2011). Reducing concentrated animal feeding operations permitting requirements. Journal of Animal Science 89(12):4364-4369. |
|
|
Dabrowski JM, Peall SKC, Van Niekerk A, Reinecke AJ, Day JA, Schulz R (2002). Predicting runoff-induced pesticide input in agricultural sub-catchment surface waters: linking catchment variables and contamination. Water Research 36(20):4975-4984. |
|
|
De Winnaar G, Jewitt GPW, Horan M (2007). A GIS-based approach for identifying potential runoff harvesting sites in the Thukela River basin, South Africa. Physics and Chemistry of the Earth Parts A/B/C 32(15):1058-1067. |
|
|
Environmental Protection Agency (2010). AFOs and CAFOs. NPDES Permit Writers' Manual for CAFOs. |
|
|
Gangodagamage C (2001). Hydrological modeling using remote sensing and GIS. |
|
|
Hamid H, Eskicioglu C (2012). Fate of estrogenic hormones in wastewater and sludge treatment: A review of properties and analytical detection techniques in sludge matrix. Water Research 46(18):5813-5833. |
|
|
Karthikeyan KG, Kalbasi M, Miller PS (2005). Nitrogen and solution dynamics in soils receiving chemically treated dairy manure. Trans American Society of Agricultural Engineers 48(2):601-610 |
|
|
Khanal SK, Xie B, Thompson ML, Sung S, Ong SK, van Leeuwen J (2006). Fate, transport, and biodegradation of natural estrogens in the environment and engineered systems. Environmental Science and Technology 40(21):6537-6546. |
|
|
Kolpin DW, Furlong ET, Meyer MT, Thurman EM, Zaugg SD, Barber LB, Buxton HT (2002). Pharmaceuticals, hormones, and other organic wastewater contaminants in U.S. streams, 1999−2000: A national reconnaissance. Environmental Science and Technology 36(6):1202-1211. |
|
|
Lee B, Kullman SW, Yost EE, Meyer MT, Worley-Davis L, Williams CM, Reckhow KH (2015). Predicting characteristics of rainfall driven estrogen runoff and transport from swine AFO spray fields. Science of the Total Environment 532:571-580. |
|
|
Merwade V (2012). Creating SCS curve number grid using HEC-GeoHMS. |
|
|
Mitloehner FM, Calvo MS (2008). Worker health and safety in concentrated animal feeding operations. Journal of Agricultural Safety and Health 14(2):163-187. |
|
|
Mockus V (2007). Hydrologic soil groups. Hydrology National Engineering Handbook. |
|
|
Noborio K, Satta N, Koga K, Baba H, Mukaida Y (2003). Nitrate filtered by soil in the grass field with surface-applied dairy cattle manure. In Animal, Agricultural and Food Processing Wastes-IX (p. 1). American Society of Agricultural and Biological Engineers. |
|
|
Schulze RE, Schmidt EJ, Smithers JC (1992). SCS-SA user manual: PC-based design flood estimates for small catchments in Southern Africa. Pietermaritzburg: University of Natal. |
|
|
Semenov AV, van Overbeek L, van Bruggen AHC (2009). Percolation and survival of Escherichia coli O157:H7 and Salmonella enterica Serovar Typhimurium in soil amended with contaminated dairy manure or slurry. Applied and Environmental Microbiology 75(10):3206-3215. |
|
|
Sherman D (2008). CAFOs uncovered. |
|
|
Shukur H (2017). Estimation curve numbers using GIS and Hec-GeoHMS model. Journal of Engineering 23(5):1-1. |
|
|
Stuebe MM, Johnston DM (2007). Runoff volume estimation using GIS techniques. Journal of the American Water Resources Association 26(4):611-620. |
|
|
Tong STY, Chen W (2002). Modeling the relationship between land use and surface water quality. Journal of Environmental Management 66(4):377-393. |
|
|
United States Department of Agriculture (1986). Urban hydrology for small watersheds. |
|
|
van Maanen JMS, van Dijk A, Mulder K, de Baets MH, Menheere PCA, van der Heide D, Kleinjans JCS (1994). Consumption of drinking water with high nitrate levels causes hypertrophy of the thyroid. Toxicology Letters 72(1):365-374. |
|
Copyright © 2024 Author(s) retain the copyright of this article.
This article is published under the terms of the Creative Commons Attribution License 4.0


