Full Length Research Paper

ABSTRACT
This study was conducted to investigate the combined effects of municipal and industrial waste discharges on the quality of the new northern Calabar River in the Niger Delta province (5.317°N, 6.467°E) of Nigeria. Water samples were collected in June 2015 from five regions along the stretch of the river. The five regions comprised three observed pollution sources (abattoir, open market, and noodle factory) and two non-pollution sources at the downstream and upstream sections of the river. Using standard analytical protocols, results showed that the current pollution loads of the river varied significantly (p < 0.05) across the three pollution sources. Over 33% of studied quality indicators of the river including total hardness (1526.19±154 mg/l), biochemical oxygen demand (10.14±4 mg/l), and chemical oxygen demand (57.62±13 mg/l) over time increased beyond their permissible limits due to the disposal of municipal and industrial wastes into the river. The present quality of the river was only fair with a Water Quality Index of 64.71. This result suggests that the water quality is usually protected but occasionally impaired by the wastes discharged into the river, leading to conditions that often depart from permissible levels.
Key words: Pollution loads, water quality index, river, Niger Delta
INTRODUCTION
Surface water is vulnerable to pollution from untreated industrial effluents, municipal wastewater, run-off from agricultural chemical fertilizers and pesticides, as well as spillage of petroleum products in coastal areas (Odokuma and Okpokwasili, 1997). Surface run-off resulting from soil erosion, lumbering activities, forestry operations, dredging activities, and domestic sewage inputs may lead to wide-scale contamination of rivers and other surface water sources (Asuquo, 1989). Increased faecal discharges in surface water also are a problem in developing as well as developed countries (Sinton et al., 1993). This problem is even worse where sanitation systems are lacking, thus posing an increased risk of outbreak of waterborne diseases (Pretorious, 2000).
Surface water may be stagnant or moving. Moving water dilutes and decomposes pollutants more rapidly than stagnant water. Even then, many moving water such as rivers and streams around the world are heavilypolluted (Chandravathi and Resmi, 2013). In developing countries, especially in the rural areas where potable water supply is almost non-existence, most of the dwellers rely solely on surface water such as streams, brooks, rivers, ponds and lakes (Olugbenga, 2006). Concerns over water quality are not limited to the water itself, but also extends to the danger of migration of toxic substances into other ecosystems (Pretorious, 2000; Bezuidenhout et al., 2002). This is because aquatic organisms can be affected by the quality of the water and harmful substances in the water can easily bioaccumulate in the food chain (Alam et al., 2006). The aquatic environment is a complex and important ecosystem that requires careful use to ensure sustainability well into the future (UNEP-GEMS/WP, 2000).
In the Niger Delta province of Nigeria, available records show staggeringly high levels of environmental pollutants in aquatic systems due to industrial activities (Jack et al., 2005). The new northern Calabar River is one of the important sources of surface water in Choba community, near Port Harcourt in the Niger Delta province of Nigeria. Communities adjoining this river are directly dependent on it for their agricultural, recreational, and sometimes, domestic water supplies (Abu, 2008).
Due to high population density and increased industrial activities in areas along the stretch of the river, water and sanitation infrastructure in these areas are now overstretched. As a result, the new northern Calabar River has become a receptacle for all genera of wastes as industries along the stretch of the river now discharge their effluents directly into the River. As a constantly moving water, the new northern Calabar River has potential for pollution dilution and good assimilative capacity for wastes arising from anthropogenic activities. However, this is limited by the amount of biodegradable component in the waste stream.
Therefore, it is essential to regularly monitor the nature of wastes discharged into the river. In the Niger Delta region where more than 60% of the populace depend on aquacultural activities for their livelihood (Francis et al., 2013), it is also pertinent to regularly monitor the pollution loads and assess the effects of pollutants on the quality of vulnerable river bodies including the new northern Calabar River.
In the assessment of the quality of a river body, several physicochemical and biological characteristics of the river are usually considered. These characteristics include (but not limited to) salinity, pH, temperature, turbidity, total hardness, biochemical oxygen demand (BOD), dissolved oxygen (DO), chemical oxygen demand (COD), phosphate, nitrate, and oil and grease (O&G). Salinity of a river, although difficult to define precisely, can be conceptually defined as a measure of the concentration of dissolved salt in the water. The salinity of a river influences both the distribution and population of aquatic organisms in the water and is affected by natural and human influences including wastewater discharges. pH of a river is generally described as a measure of the - log[H+] in the water. It indicates the level of acidity or alkalinity of the water on a scale of 0.0-14.0 and is important because aquatic life can only survive within a narrow range of pH - with most fish surviving between pH ranges of 6.0–9.0 (Dey and Islam, 2015).
Alkalinity is related to hardness because it is increased in the presence of carbonates and bicarbonates, which are the major causes of water hardness. Turbidity results from suspended solids in the water due to industrial waste discharges and may be harmful to aquatic life. Suspended solids in the water absorb heat from sunlight thereby increasing the water temperature. Temperature affects the rates of metabolism and growth of aquatic organisms (Cleveland State University, 2001).
BOD, DO, and COD are among the most common measures of organic pollution in water. DO is the actual amount of oxygen available in dissolved form in the water while BOD is a measure of the amount of oxygen used by microorganisms in the decomposition of organic matter in the water. Thus, when BOD level is high, DO level will decrease because the amount of oxygen available in the water is being used by the microorganisms (Robson, 2002). COD is a measure of the ability of water to consume oxygen during the chemical oxidation of organic matter in the water (Robson, 2002). High concentrations of phosphates in water are associated with eutrophication condition (WHO, 1998), resulting from industrial wastewater discharges (Gasim et al., 2012). Nitrate is a naturally occurring form of nitrogen, which is very mobile in water. River water high in nitrate levels is potentially harmful to human and animal health (Gasim et al. 2005). O&G, including fats and oils and petroleum products cause unpleasant films on water surfaces and negatively affect aquatic life because of their toxicity (Jack et al., 2005).
As stated, the new northern Calabar River is strategic to the health and socio-economic activities of community dwellers, not least because of its proximity to abattoirs, open markets, and a number of industries including a noodle factory and oil services companies. A number of studies have shown that due to persistent dumping of all sorts of wastes in the river by these companies, users of the abattoirs, and traders the quality of the river water has changed significantly (Asuquo, 1989; Odokuma and Okpokwasili, 1997; Odokuma and Ijeomah, 2003; Akaninwor et al., 2007; Abu and Egenonu, 2008). Of these studies, only Asuquo (1989) considered changes due to waste disposal on selected physicochemical characteristics of the river while the other studies focused on the effects of waste disposal on the biological characteristics of the river.
Since the work of Asuquo (1989), there has been a steady increase in industrial and commercial activities near the river. Therefore, studies on the current pollution loads and the combined effects of pollutants arising from municipal and industrial waste discharge on the quality indicators of the river are necessary. The current study aimed to determine the combined effects of municipal and industrial waste discharges on selected quality indicators and evaluate the water quality index (WQI) of the new northern Calabar River.
MATERIALS AND METHODS
Description of the study area
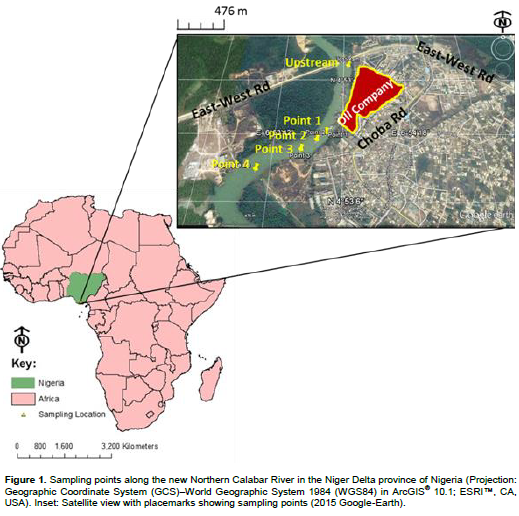
Choba, host to the new northern Calabar River, is located in the Niger Delta province (5.317°N, 6.467°E), Nigeria and has a population of about 12,000 with a total land area of about 1.3 km2. The average temperature of the area is between 24 and 27°C with an annual precipitation of about 1500 to 2500 mm during the rainy season and a relative humidity of over 80 %. The area has two climatic regimes consisting of wet season between March and October and dry season between November and February (Amadi, 2004; Ehirim and Nwankwo, 2010).
Sample collection
Figure 1 shows the points from where we collected water samples along the new northern Calabar River in the Niger Delta province of Nigeria. First, we compartmentalised the river body into 5 regions, namely: abattoir, open-market, noodle-processing, downstream, and upstream. While the first three sampling regions covered the three observed waste discharge points in the river, the fourth sampling region was selected some distances downstream of the third region, and the fifth was the upstream (4°53'46''N, 6°54'02''E) end of the river (Figure 1). Samples collected from the downstream and upstream regions served as the mixed-effluent and control samples respectively. Then using a canoe, wading gear, and 2-m long marine rope of 3-mm diameter, we collected samples against the flow of the water from each region at depths of 30-50 cm under the water surface. Samples were collected between 50- and 70-m distances from the shoreline. At the abattoir, open market, noodle factory, and the downstream regions samples were taken at point 1 (4°53'25''N, 6°53'55''E), point 2 (4°53'21''N, 6°53'53''E), point 3 (4°53'18''N, 6°53'48''E), and point 4 (4°53'13''N, 6°53'38''E), respectively (Figure 1). Samples were collected using 60 ml centrifuge tubes and sealed with a PTFE tape. The samples were preserved in a cooler containing ice blocks for a few hours until shipment to the Microbiology Laboratory, River State University Science and Technology, Port Harcourt for analysis.
Determination of the physicochemical characteristics of the water sample
Salinity, pH, temperature, and turbidity
The HI 9828 Multiparameter Water Quality Meter (Hanna Instruments, USA) was used for the analyses of salinity, pH, temperature, and turbidity of the water sample according to ASTM (2007) method D7315. For the properties of interest, the appropriate sensors were selected and mounted on the probe after initial activation protocols recommended by the manufacturer. Three sensors were used in one analytical run – some sensors measured more than one property in a single run. With the HI 9828 Multiparameter off, the multisensor probe was then connected to the meter after carefully screwing the protection sleeve on the probe for taking measurements or the transparent beaker for calibration. The probe was then immersed into the water sample before turning on the meter. Values for the selected water properties were then read off the graphic display of the meter. The resolution, sensitivity, and accuracy of the HI 9828 Multiparameter for each property of interest are provided in the material safety data sheet of the instrument.
Total hardness
Total hardness was determined by the ethylenediaminetetraacetic acid (EDTA) titrimetric method according to APHA (2013) method 2340C. Using Eriochrome Black-T as indicator, the EDTA formed a colourless stable complex with Ca2+ present in the water sample at pH of 10. The hardness, as CaCO3 in mg/l, was deduced from equation 1.
 (1)
(1)
Where, Cw = hardness (as CaCO3 in mg/l sample); VE = volume (ml) of EDTA used in sample titration; CE = concentration of EDTA solution (g/l CaCO3), and S = original volume (ml) of sample taken for analysis.
Biochemical oxygen demand (BOD), dissolved oxygen (DO), and chemical oxygen demand (COD)
The 5-day BOD and DO were analyzed using Winkler’s method (Bryan et al., 1976), which involved adding two drops of freshly prepared starch to 25 ml of the sample and titrating with 0.0125 ml sodium thiosulphate to obtain a colourless solution. COD was determined by the open-reflux method (Medalia 1951) using a Spectronic–20 spectrophotometer (ThermoFisher Scientific Inc., USA). In this method, 0.4 g HgSO4 was added to 250 ml of water sample in the reactor. Then, 30 ml of concentrated H2SO4 containing Ag2SO4 was slowly added before refluxing for about two hours. After reflux, the mixture was diluted to about twice its volume with deionized water. The cell was then rinsed and filled with the water sample, wiped with a tissue paper, and inserted in the sample compartment. Reading was directly taken from the display screen on the spectrophotometer.
Oil and grease
The determination of oil and grease was done by infrared (IR) spectrometry using an IRPrestige-21 Fourier Transform IR spectrophotometer with standard wavenumber range of 7800 to 350 cm−1 (Shimadzu® Corporation, Japan). The Spectrophotometer is equipped with a Michelson interferometer of 30°C incident angle with a single beam optical system and a potassium bromide (KBr) standard beam splitter. It has a cooling-type ceramic light source and a DLATGS® detector with temperature control system. Its spectral resolution is 0.5 to 16 cm−l around 263 to 8400 cm−l with a signal-to-noise (S/N) ratio of 40,000:1 in the mid-IR range. The method involved adding 30 ml of 1,1,3-trichlorotrifluoroethane (fluorocarbon 113) as eluting solvent to the sample in a bottle and shaking vigorously for 2 minutes before transferring the solution into a separatory funnel. Since we were interested in total oil and grease, the eluate was not contacted with silica gel. The absorbance of the eluate was then measured at the specific wavenumber of 2930 cm-1 (~3413 nm) and compared against the calibration curve developed for the spectrophotometer. The instrument was calibrated beforehand using Bonny light crude-oil. Total oil and grease was deduced using equation 2.

Where R = mass of oil in milligrams in solution determined from calibration plot; D = extract dilution factor used; and V = volume in litres of sample determined by making up sample volume to the calibration line on the vial and correcting for acid addition.
Phosphate and nitrate
Usually, nine variables including dissolved oxygen, faecal coliform, pH, biochemical oxygen demand, temperature change, nitrogen-nitrate, total phosphate, turbidity, and total solids are recommended in literature for calculating WQI, although six of those can typically be used. Therefore, to enable us determine the WQI of the river, phosphate and nitrogen-nitrate were tested in addition. Phosphate determination was done using stannous chloride method. In this method, 50 ml of the water sample in 100 ml volumetric flask was mixed with 2.0 ml ammonium molybdate reagent and 0.2 ml stannous chloride reagent as described in Robinson et al. (1971). The brucine method, as described in Paragas et al. (2014), was used for the determination of nitrate-nitrogen (N-NO3), which was deduced using equation 3:

Where, C = Concentration of N-NO3 in sample (mg/l); A = corrected absorbance for the sample (no unit); and a = molar absorptivity (l/mg/cm).
Determination of WQI of the river
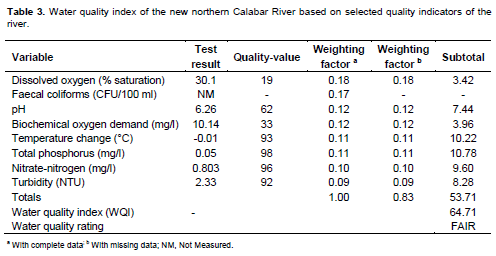
According to several literatures, WQI is a measure of the pollution status of a body of water. To calculate WQI for the river, we used the test results for the selected quality indicators to determine their corresponding Quality-values (Q-values) using the NSF® WQI Calculator. Then the Q-values were multiplied by their respective weighting factors. Weighting factors for water quality indicators are freely available on the internet. Finally, the subtotals were added and the resulting WQI rated on a scale of 0-100 (100 being best) according to the following criteria: 95 ≤ WQI ≤ 100 means Excellent; 89 ≤ WQI ≤ 94 means Very Good; 80 ≤ WQI ≤ 88 means Good; 65 ≤ WQI ≤ 79 means Fair; 45 ≤ WQI ≤ 64 means Marginal; and 0 ≤ WQI ≤ 44 means Poor (CCME 2001). Since we did not have the complete nine variables needed for WQI determination (less by faecal coliform), the WQI we calculated was adjusted for the missing data by dividing the sum of the subtotals by the sum of the weighting factors that have data as recommended in literature. To determine the Q-value for dissolved oxygen, we converted its value from mg/l to % saturation using the DOTABLES Software Version 3.5 (USGS, USA). To determine the temperature change, the upstream temperature was subtracted from the temperature downstream and the corresponding Q-value calculated as described.
Statistical evaluations
To ascertain if the pollution loads, in terms of selected quality indicators, is the same for each of the three studied pollution sources, we treated pollution source as a single factor affecting each indicator and checked the statistical significance of the differences by the analysis of variance (ANOVA) for a one-way classification. Differences were considered significant at p < 0.05. One-way ANOVA was implemented using Excel® 2010 (Microsoft Corp., WA, USA). For each pollution source, three sets of samples were collected, analysed, and results averaged. The standard deviation for each set of measurement including the two control regions (downstream and upstream) was also calculated using Excel® 2010.
RESULTS AND DISCUSSION
Effects of waste disposal on pH and hardness of the river
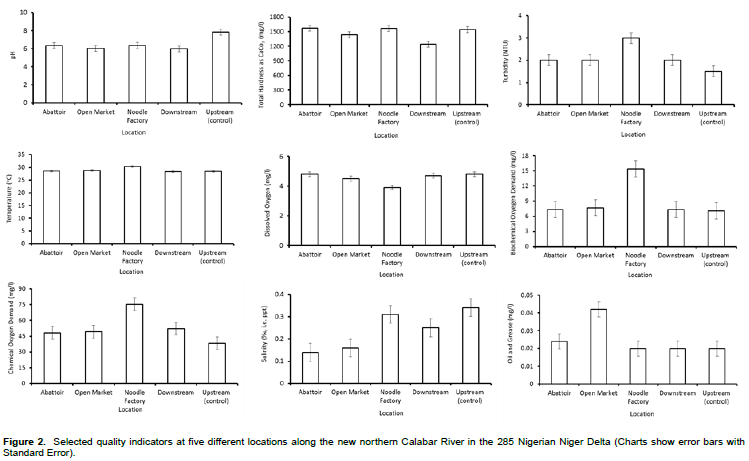
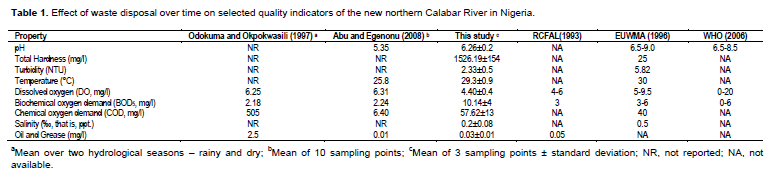
Figure 2 shows the pollution loads measured at five different locations along the new northern Calabar River; whereas the effect of waste disposal over time on the selected quality indicators of the river is shown in Table 1. As can be seen in Figure 2, the pH across the different regions of the river was fairly similar, especially around the three sources of pollution, namely: the abattoir, open market, and noodle factory. Overall, the mean pH of the river increased from 5.35 (Abu and Egenonu, 2008) to 6.26 in the current study (Table 1). The mean pH of 6.26 obtained in this study suggests that the river is only sufficiently basic for some species of aquatic organisms as the pH is within permissible limits (Table 1). Nonetheless, it is apparent from the pH of 7.84 at the upstream region (Table 1) that the pH’s of the undiluted effluents may be somewhat acidic. The ability of the river, which is exposed to 100 % air saturation, to buffer the acidity of the effluents implies that the alkalinity of the river is high. This is explained in part by the relatively high total hardness of the river with a mean value of 1526.19 mg/l (Table 1). Compared with the EUWMA (1996) permissible value of 25 mg/l, the total hardness of the river was over 60 times higher than recommended.
Meanwhile, the literature note that hardness values ranging from 75 to 150 mg/l is optimum for fish survival while hardness values greater than 300 mg/l is lethal to fish life as it increases pH resulting in non-availability of nutrients (Bhatnagar et al. 2004). Thus, the new northern Calabar River is currently overly hard and this may be detrimental to some species of aquatic organisms in the river. This may explain why fishing activities in the river are usually several kilometres away from the upstream and downstream sections of the river.
Effects of waste disposal on turbidity, temperature, and dissolved oxygen of the river
Figure 2 shows that the noodle factory region was the most turbid with 3.0 Nephelometer Turbidity Units (NTU) while the river, as expected, appeared to be clearer at the upstream (control) region with turbidity of 1.5 NTU. Although we could not fairly compare the past turbidity level of the river with the present status because of paucity of information in the open literature, the turbidity of the river was within permissible limits (Table 1). This suggests that the river is presently clear up to a reasonable depth.
However, it is well known that turbidity results from suspended solids in the water, including (but not limited to) industrial wastes, which absorb heat thereby raising water temperature and lowering dissolved oxygen levels. Although the current temperature level of the river was within permissible limits (Table 1), it can be inferred from the increase in the temperature from 25.8°C (Abu and Egenonu, 2008) to 29.3°C (this study) that the turbidity of the river increased over time. This trend, if not properly monitored, portends danger to the survival of aquatic organisms in the river.
Sufficient supply of dissolved oxygen is necessary for the survival of aquatic organisms, which could be the major reason dissolved oxygen is said to be the most important measure of water quality (Peirce et al., 1997). As depicted in Table 1, dissolved oxygen in the river decreased over time, dropping slightly below EUWMA (1996) permissible limits but within WHO (2006) and RCFAL (1993) limits. Overall, the dissolved oxygen of the river was adjudged acceptable since it was within the permissible limits of two out of the three international standards considered in this study. Even then, the drop in dissolved oxygen level over time is obviously unhealthy for the river. As stated, the drop in dissolved oxygen in the river may be attributed to increase in temperature due to increase in turbidity (Table 1). Apart from increase in temperature and turbidity, there is a possible reason for the reduction in the level of dissolved oxygen in the new northern Calabar River. The river is the main navigation channel for sea vessels owned by oil services companies operating near the river. To maintain sufficient depth for the sea vessels, the river is regularly dredged. The added depth slows down the movement of the water body and impedes its mixing ability. A navigation channel has particularly low dissolved oxygen levels (Cleveland State University, 2001). Sustained reduction in dissolve oxygen level in the new northern Calabar River in the years ahead would have dire consequences as anaerobic condition may set in, rendering organisms responsible for self-purification processes in the river ineffective.
Effects of waste disposal on biochemical oxygen demand (BOD) of the river
From several literatures, BOD has been described as a measure of the amount of oxygen consumed by microorganisms in decomposing organic matter in streams and rivers (UNESCO, 1996). As shown in Figure 2, the highest level of BOD was recorded in the noodle factory region. This implies that the effluents from the noodle factory region had the highest input of organic waste to the new northern Calabar River. This further explains why the lowest level of dissolved oxygen was recorded in the noodle factory region (Figure 2). It has been noted in several studies that BOD directly affects the amount of dissolved oxygen in rivers and streams – the higher the BOD, the lower the dissolved oxygen. Table 1 shows that over time there has been an increase in the BOD level of the river. As can be seen in the Table 1, the BOD level of the new northern Calabar River was poor and way beyond permissible limits. The poor BOD status of the river indicates that the river is somewhat polluted with organic matter. If the current trend is not properly monitored, then the river risks being populated by macro invertebrates such as leeches that are more tolerant to lower dissolved oxygen levels and concomitant disappearance of organisms that need higher oxygen levels.
Effects of waste disposal on chemical oxygen demand (COD) of the river
COD is widely used as a measure of the susceptibility to oxidation of the organic and inorganic materials present in water bodies and effluents (UNESCO, 1996). As can be seen in Figure 2, the highest level of COD was recorded in the noodle factory region, suggesting that the factory effluents contributed the highest amount of oxidizable organic materials to the river. This corroborates the reduced dissolved oxygen level recorded in the region. On the average, Table 1 shows that there has been a dramatic fluctuation in the COD levels of the river over time. On one occasion the COD level of the river was reported as 505 mg/l (Odokuma and Okpokwasili, 1997) before it reportedly plummeted to 6.40 mg/l at some other time (Abu and Egenonu, 2008). In this study, the COD level of the river rose to 57.62 mg/l – almost one-and-half times higher than the permissible limit (Table 1). At the moment, we are unable to resolve the cause for the dramatic fluctuation in the COD level of the river. Nonetheless, rising COD levels in river water is widely known to reduce dissolved oxygen levels. As discussed, reduction in dissolved oxygen can lead to anaerobic conditions, which are harmful to higher aquatic organisms.
Effects of waste disposal on salinity of the river
Salinity is generally described as a measure of all the non-carbonate salts dissolved in water. Typical salts that can dissociate into ions in water include NaCl, MgSO4, KNO3, and NaHCO3. As shown in Figure 2, two of the three pollution sources in the river showed a narrow range of salinities; 0.14 (0.01) and 0.16‰ (0.02%) at the abattoir and open market regions respectively. This is indicative of the similarity in the salinities of effluents released into the river. However, the salinity of the effluent from the noodle factory almost doubled the salinities of effluents from the abattoir and open market. Generally, both the industrial and municipal effluents released into the river lowered the salinity from 0.34‰ at the upstream region (Figure 2) to an average of 0.2‰ (Table 1). Albeit, the salinity of the river was within the acceptable value (Table 1) and is typical of freshwater like lakes, rivers, ponds, streams, and aquifers. At the moment, we do not have sufficient information to ascertain how the salinity of the river changed over time. However, from hindsight, there is need to closely monitor the effluent from the noodle factory because of its relatively high (albeit acceptable) salinity. It is important to add that salinity is a major driving factor that affects the density and growth of aquatic organisms’ population (Maucha, 1940).
Often salinity limits vary with the species of organism; fresh and brackish water fish species generally show poor tolerance to large changes in water salinity (Maucha, 1940).
Effects of waste disposal on oil and grease (O&G) of the river
The O&G status of the river is shown in Figure 1. As can be seen in Figure 2, the amount of O&G from the open market region was the highest (0.042 mg/l). There are two potential sources of O&G in the river. One likely source is the oil services company (Figure 1), and the second source is due to the activities of operators of passenger boats, who repair their broken-down outboard engines in the dock at the open market region. This explains the high level of O&G in the open market region compared to the other regions (Figure 2). Overall, the O&G level of the river was within the permissible limit (Table 1).
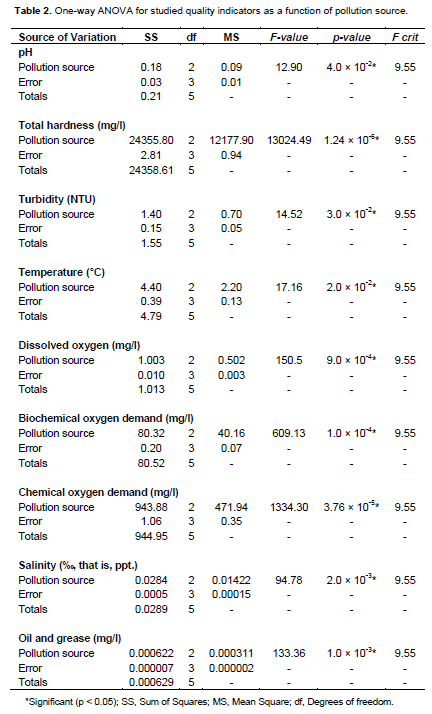
Statistical data analyses
Table 2 shows the result of the one-way ANOVA performed to ascertain if the pollution loads is the same for each of the three studied pollution sources in the new northern Calabar River. As can be seen in Table 2, there were significant differences (p < 0.05) in the quality indicators of the river due to differences in the characteristics of the effluents from the three pollution sources. This suggests that the pollution sources are independent.
Current WQI of the new northern Calabar River
Table 3 shows the WQI of the new northern Calabar River determined using the selected quality indicators of the river. As shown in Table 3, the WQI of the river was 64.71, which ranked the overall quality of the river as fair (CCME, 2001). This implies that the water quality is usually protected but occasionally impaired with conditions sometimes departing from desirable levels (CCME, 2001). Thus, before use either for domestic or agricultural purpose; it is essential that the water is treated.
CONCLUSIONS
In this study, we investigated the combined effects of municipal and industrial wastes on selected quality indicators of the new northern Calabar River and evaluated the WQI of the river. Results obtained support the following conclusions: (1) Over time, 33% of the quality indicators of the river including total hardness (1526.19±154 mg/l), BOD (10.14±4 mg/l), and COD (57.62±13 mg/l) increased beyond their permissible limits due to municipal and industrial wastes discharges in the river; (2) The overall quality of the river was ranked as marginal or average (WQI = 64.71), which suggests that the water quality is usually protected but occasionally impaired by the waste discharges into the river; often leading to the departure of the quality indicators from permissible levels. Consequently, regular monitoring of effluents from the main pollution sources in the river is recommended.
CONFLICT OF INTERESTS
The authors have not declared any conflict of interests.
REFERENCES
|
Abu GO, Egenonu C (2008). The current pollution status of the new northern Calabar River in the Niger Delta region of Southern Nigeria: A survey of antibiogram profiles of its bacterial isolates. Afr. J. Environ. Sci. Technol. 2:134-14. |
|
|
Akaninwor JO, Anosike EO, Egwim O (2007). Effect of Indomie® industrial effluent discharge on microbial properties of new Calabar. River. Sci. Res. Essay. 2:001-005. |
|
|
Alam MN, Elahi F, Didar-UL-Alam MD (2006). Risk and water quality assessment overview of River Sitalakhya in Bangladesh. Acad. Open Internet J. 19:311-316. |
|
|
Amadi PA (2004). Groundwater resource evaluation of the Pot Harcourt area, River State, Nigeria. [Dissertation]. Port Harcourt (Nigeria). University of Port Harcourt. |
|
|
[APHA] America Public Health Association (APHA) (2013). Method 2340C: Standard methods for the examination of water and wastewater. Washington (DC). |
|
|
[ASTM] American Society for Testing and Materials (ASTM) (2007). Method D7315: Standard method for determination of turbidity in Turbidity Unit (TU). West Conshohocken (PA). |
|
|
Asuquo FE (1989). Water Quality of the Calabar River, Nigeria. Trop. Ecol. 30:31-40. |
|
|
Bezuidenhout CC, Mthembu C, Puckree T, Lin J (2002). Microbiological evaluation of the Mhlathuze River, KwaZulu-Natal (RSA). Water SA. 28:281-286. |
|
|
Bhatnagar A, Jana SN, Garg SK, Patra BC, Singh G, Barman UK (. 2004). Water Quality Management in Aquaculture. CCS Haryana Agricultural. Hisar (India). |
|
|
Bryan JR, Riley JP, Williams PJ, Le B (1976). A Winkler procedure for making precise measurement of oxygen concentration for productivity and related studies. J. Exp. Mar. Biol. Ecol. 2:191-197. |
|
|
[CCME] Canadian Council of Ministers of the Environment. (CCME) 2001. Canadian water quality guidelines for the protection of aquatic life: Canadian Water Quality Index 1.0 Technical Report. Can. Environ. Qual. Guidelines. Winnipeg: Canada. |
|
|
Chandravathi PK, Resmi G (2013). Assimilation capacity of a stretch of Periyar River – a case study. Int. J. Adv. Technol. Eng. Sci. 1:1-13. |
|
|
Cleveland State University (2001). Cuyahoga River Water Quality Monitoring Program. Information and Advisory Note Number 22. |
|
|
Dey S, Islam A (2015). A Review on textile wastewater characterization in Bangladesh. Res. Environ. 5:15-44. |
|
|
Ehirim CN, Nwamkwo CN (2010). Evaluation of aquifer characteristics and groundwater quality using geoelectric method in Choba, Port Harcourt. Arch. Appl. Sci. Res. 26:125-132. |
|
|
[EUWMA] European Union of Water Management Associations. |
|
|
Francis S, Sidney N, Betty N (2013). Evaluation of nematode Parasitemia in Oreochromis niloticus from lower new Calabar River, Port Harcourt, Niger Delta, Nigeria. Int. J. Sci. Res. Environ. Sci. 1:263-267. |
|
|
Gasim MB, Azmin WN, Yaziz MI (2012). Land use change and their impact on water quality in the Semenyih River, Selangor, Malaysia. J. Technol. Mineral 2:103-111. |
|
|
Gasim MB, Ismail BS, Wan NA, Muhammad IY, Marlia MH (2005) Water quality assessment of the Semenyih River Basinlangor, Malaysia. J. Biosains. 16:95-102. |
|
|
Jack IR, Fekarurhobo GK, Igwe FU (2005). Determination of hydrocarbon levels in some marine organisms from some towns within the Rivers State of Nigeria. J. Appl. Sci. Environ. Manage. 9:59-61. |
|
|
Maucha R (1940). The graphic symbolization of the chemical composition of natural waters. Hiderol Kozlony. 8:29-34. |
|
|
Medalia AI (1951). Test for traces of organic matter in water. Anal. Chem. 23:1318-1320. |
|
|
Odokuma LO, Ijeomah SO (2003). Tolerance of bacteria to toxicity of heavy metals in the New Calabar River. Global J. Environ. Sci. 2:128-132. |
|
|
Odokuma LO, Okpokwasili GC (1997). Seasonal influences of the organic pollution monitoring of the new Calabar River, Nigeria. Environ. Monit. Assess. 45:43-56. |
|
|
Olugbenga O (2006). An assessment of the impact of abattoir effluent discharge on the water quality of River Illo, Ota. [Dissertation]. Ota (Nigeria). Covenant University. |
|
|
Paragas DS, Salazar JR, Ginez MO (2014). Preparation, characterization and application of rice hull-derived zeolites in water treatment. J. Asian Sci. Res. 4:348-355. |
|
|
Peirce JJ, Weiner RF, Vesilind PA (1997). Environ. Pollut. Control. Butterworth-Heinemann: MA. |
|
|
Pretorious L (2000). An investigation into the effect of various levels of sanitation on surface water quality in a typical developing community. SA Water Bull. 26:10-12. |
|
|
Robinson R, Roughan ME, Wagstaff DF (1971). Measuring inorganic phosphate without using a reducing agent. Ann. Clin. Biochem. 8:168-172. |
|
|
Robson MG (2002). Biological Oxygen Demand. Encyclopaedia of Public Health. |
|
|
Russia Committee for Fisheries and Aquatic Life (RCFAL) (RCFAL) (1993). Maximum Allowable Limits of Water Quality for Fisheries and Aquatic Life. Russia Committee for Fisheries and Aquatic Life. Yekaterinburg: Russia. |
|
|
Sinton LW, Donnison AM, Hastie CM (1993). Faecal streptococci as faecal pollution indicators: a review. II. Sanitary significance, survival, and use. N. Z. J. Mar. Freshwater Res. 27:117-137. |
|
|
United Nations Educational, Scientific and Cultural Organization (UNESCO) (1996). A Guide to Use of Biota, Sediments and Water United Nations Environment Programme Global Environment Monitoring System/Water Programme. (UNEP-GEMS/WP) (2000). Water Quality for Ecosystem and Human Health. National Water Research Institute. Burlington: ON. |
|
|
World Health Organization (WHO) (1998). Guidelines for Drinking-Water Quality, 2nd ed. World Health Organization: Geneva. |
|
|
World Health Organization (WHO) (2006). Guidelines for Drinking-Water Quality: Incorporating First Addendum. 3rd ed. World Health Organization: Geneva. |
|
Copyright © 2024 Author(s) retain the copyright of this article.
This article is published under the terms of the Creative Commons Attribution License 4.0


