Full Length Research Paper

ABSTRACT
Predictions of the impacts of climate change on the intensity, amount, and spatial and temporal variability of rainfall and temperature are required. The aim of this study was to assess the status of climate change and hydrological response to climate change for Gumara River sub-basin. Statistical Downscaling Model (SDSM 4.2) was used to downscale HadCM3A2a and HadCM3B2a predictors into finer scale resolution. To estimate the level of impact of climate change, climate change scenarios of precipitation and temperature were divided into four time windows of 25 years each from 2001 to 2099. The Soil and Water Assessment Tool (SWAT) was used to simulate the hydrological response. The results showed that the SWAT calibration and validation reveals a good agreement with R2 = 0.9 and NSE = 0.89 during calibration and R2 = 0.89 and NSE = 0.86 during validation. Annually, both precipitation and temperature showed increasing trends in all future time horizons in which precipitation increases up to a maximum of 13.7% (2076 to 2099) and temperature increases by 1.010c (2076 to 2099). The change in average flow volume due to climate change mainly corresponds to the change in precipitation. The average annual flow volume for the future increases by 17.8% (2076 to 2099). Overall, it appears that climate change will result in an annual increase in flow volume for the Gumara River. The increase in flow is likely to have considerable importance for local small scale irrigation activities. Since the flow volume increases in small rainy season (Belg) and main rainy season (Kiremit), due attention is also needed to prevent flood hazards. Generally, results presented in this study can provide valuable insight to decision makers on the degree of vulnerability of Lake Tana Basin to climate change, which is important to design appropriate adaptation and mitigation strategies.
Key words: Gumara river, climate change, SDSM, SWAT model.
INTRODUCTION
Climate change associated with rising atmospheric concentrations of greenhouse gases has been recognized in the Earth’s atmosphere and simulations of its possible future course suggest substantial potential consequences for human societies and natural systems (Michael et al., 2004). Intergovernmental Panel on Climate Change (IPCC, 2007) point out that water and its availability and quality will be the main pressures on, and issues for societies and the environment under climate change. Climate change has greater implication on water resources systems. Observational records and climate projections provide abundant evidence that freshwater resources are vulnerable and have the potential to be strongly impacted by climate change, with wide-ranging consequences for human societies and ecosystems (Bates et al., 2008).
Predicting the impacts of climate change on the intensity, amount, and spatial and temporal variability of rainfall and its responses on stream flow regime are required for design and management of water resource systems (Boosik et al., 2007). Climate change effects may include the magnitude and timing of runoff, the frequency and intensity of floods and droughts, rainfall patterns, extreme weather events, and the quality and quantity of water availability and these changes, in turn, influence the water supply system, power generation, sediment transport and deposition, and ecosystem conservation (Tao et al., 2007).
Moreover, according to Chong-Yu (1999) the impacts of future climatic changes will be on changes in regional water availability. Such hydrologic changes will affect nearly every aspect of human well-being, from agricultural productivity and energy use to flood control, municipal and industrial water supply, and fish and wildlife management. The tremendous importance of water in both society and nature underscores the necessity of understanding how a change in global climate could affect regional water supplies.
The heavy reliance of the Ethiopian economy on rain fed subsistence agriculture makes it particularly vulnerable to hydrological variability (Dile et al., 2013). Most climate change studies in Ethiopia have been done at River basin scale (Kim et al., 2008; Elshamy et al., 2008; Taye, 2010; Rizwan et al., 2010; Kigobe and Griensven, 2010) and results from these studies are highly aggregated and have little importance in informing the impact of climate change at smaller catchment scale. This research assesses the impact of climate change for Gumara River, one of the tributaries of the Lake Tana – the source of the Upper Blue Nile River, based on statistical downscaling model (SDSM).
Gumara River and the Lake Tana are important for various socio-economic purposes. However, due to climate change and variability, the water level in the lake fluctuates. The study extended to understand the implications of climate change at the hydrology of Gumara River by applying a process-based hydrological model (ArcSWAT model) with finer temporal and spatial resolution and potentially provide valuable insight to decision makers, planners and stockholders on the local vulnerability of the Gumara River flows and the Lake Tana regarding future change in rainfall and temperature because of climate change.
MATERIALS AND METHODS
General
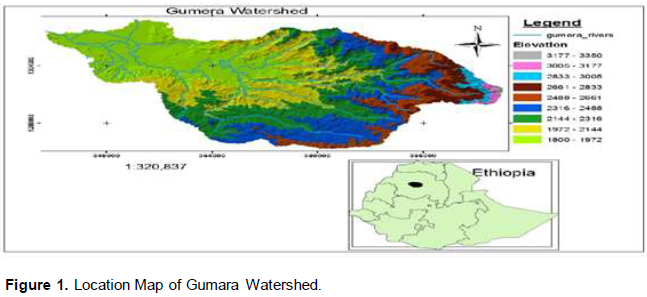
Gumara watershed, drained by Gumara Rivers, is part of the Abay Basin and more particularly part of Lake Tana sub-basin which is situated on the North Eastern side of Lake Tana and contributes significant inflows to the Lake Tana. The climate of the LakeTana sub-basin is dominated by tropical highland monsoon with most of its rainfall (70 to 90% of total rainfall) occurring between June and September (Dile et al., 2013). The major rivers feeding the Lake Tana are Gilgel Abay, Gumara, Rib, and Megech. These Rivers contribute more than 93% of the flow (Setegn et al., 2009). The gauged part of Gumara watershed covers 1394 km2. The geographical location of the watershed is between 11°34’ 41.41” N and 11°56’ 36” N latitude to 37°29’ 30” E and 38°10’ 58” E longitude. The elevation of the watershed ranges from 1800 m.a.s.l. at the lake to 3704 m.a.s.l. at the highlands. Based on the data obtained from Ethiopian Meteorological Agency, the mean annual rainfall is 1528 mm while the maximum (minimum) temperature are 27.02°C(9.51°C) respectively (Figure 1).
Land use land cover
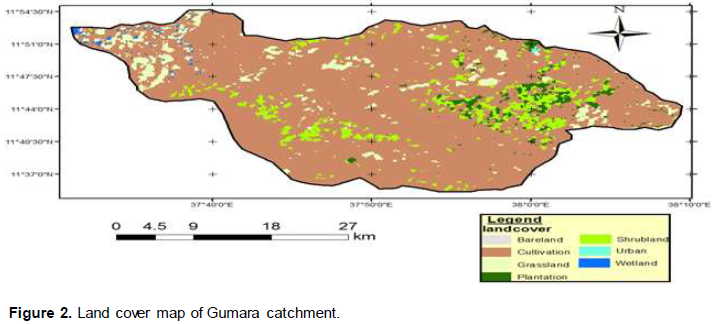
The dominant land use of the watershed is rain fed agriculture and cultivated land is in a various forms including intensively cultivated, cultivated land with scattered trees, cultivated land with trees and shrubs and seasonally cultivated lands. More than three quarter of all land in the watershed has already been brought under cultivation. The major crops grown in the watershed are Teff, maize, Barley, Wheat and other cereals. Teff is the main staple food crop in the area. Bush or shrub land, grazing land, forest/wood land and wetland/swap are other land cover types in the watershed. Wetlands/swamp areas are commonly existent on the lower banks of Rivers, mainly of River and near Lake Tana. As it can be shown in Figure 2, the majority of the catchment is covered by crop land (cultivated), while the remaining are covered by leafy forests, shrubs, grasses and some are bar land and wet land.
Soil type of the study area
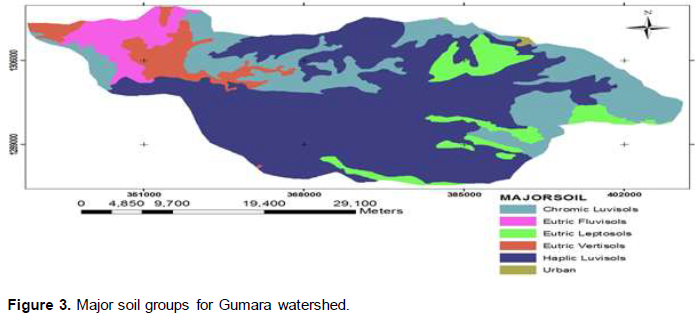
Soil data information as per FAO soil group is available at the Ministry of Water, Irrigation and Energy GIS department. The data was compiled during master plan study of the Abay River basin. Based on the data acquired and as per FAO soil classification, the catchment is dominantly covered by haplic luvisols, eutric vertisols, eutric fluvison, eutric leptosols and chronic luvisols (Figure 3).
Climate of the study area
There are some meteorological stations within the study area and its surroundings such as Bahir Dar, Debre Tabor, Amedber, Woreta, Amde Genet, Nifas Mewucha, Wanzaye and Gassay which are monitored by Ethiopian Meteorological Agency. Out of which Bahir Dar and Debre Tabor are first classes while others are second and third class stations. The annual climate may be divided into two, rainy and dry season. The rainy season may be divided into a minor rainy season in March to May (Belg) and a major rainy season from June through September (Kiremit). The dry season occurs between October and February (Bega). The four wettest months cover largest percent of the total annual rainfall. While the remaining months, being from October to May lowest rainfall. The mean annual rainfall and temperature of the area varies spatially from station to station. Based on the data obtained from Ethiopian Meteorological Agency, the mean annual rainfall is 1528 mm (1976 to 2005) at Debre Tabor station, 1288mm (1992-2008) at Woreta and 1279 mm (1986-2005) at Bahir Dar station while the maximum (minimum) temperature are 27.02oc(9.51oc), 27.5oc(9.6oc) and 27.95oc(11.97oc) at Debre Tabor, Bahir Dar and Woreta stations respectively.
Hydrology
Gumara is one of the major Rivers which contributes significant amount of inflow to Lake Tana. For this reason, the Ethiopian ministry of water, Energy and Irrigation installed gauging station downstream of the River. The gauging station is located at 11°50’ 0” N and 37°38’ 0” E and measures daily instantaneous flows of the River since 1959 and covers the area of 1394 km2. Based on the recorded flow data obtained from Ethiopian ministry of water, Energy and Irrigation, the average daily flow of the River is 34.12m3/s (1976 to 2005).
Modeling approach
Climate change modeling approach
Global Circulation Model (GCM) derived scenarios of climate change were used for predicting the future climates of the study area based on criteria proposed by the Intergovernmental Panel on Climate Change (IPCC). There are different GCM outputs used for impact studies. Using the average outputs of different GCMs can minimize the uncertainties associated with each GCMs and can result in plausible future climates for impact studies (Lijalem, 2006). However, as this study was carried out within a very short period of time, only the HadCM3 model was selected for the impact study.
The HadCM3 GCM output was chosen since the model is widely used for climate change impact assessment in the upper Blue Nile basin (Kim et al., 2008; Rizwan et al., 2010; Dile et al., 2013), and the results of HadCM3 can be easily downscaled using SDSM (Dile et al., 2013). In addition, HadCM3 has the ability to simulate for a period of thousand years, showing little drift in its surface climate (Zulkarnain and Sobri, 2012). A2a (medium-high) and B2a (medium-low) scenarios were used for inter-comparison studies because the computing cost of all scenarios in GCM is too expensive.
GCMs are restricted in their use fullness for local impact studies by their coarse spatial resolution (typically of the order 50,000 km2) and inability to resolve important sub-grid scale features such as clouds and topography (Wilby et al., 2001). Statistical downscaling method (SDSM 4.2) was used to relate large scale atmospheric variables (predictor) to local-scale surface weather (predictands), that is, precipitation and maximum and minimum temperature for this study, based on multiple linear regression techniques.
According to Wilby and Dawson (2007), statistical downscaling methods have several practical advantages over dynamical downscaling approaches in situations where low–cost, rapid assessments of localized climate change impacts are required and it was freely downloaded from http://www.sdsm.org.uk. Further, the SDSM is the first downscaling tool offered to the broader, less specialized climate change com-munity (that is, conservation authorities or private consulting companies). Comparisons between the SDSM and other statistical downscaling methods have demonstrated that the SDSM is a useful downscaling technique, capable of reproducing observed climatic variability. Numerous studies have also assessed the SDSM for downscaling GCM output to be used in many hydrological applications (Khan et al., 2006).
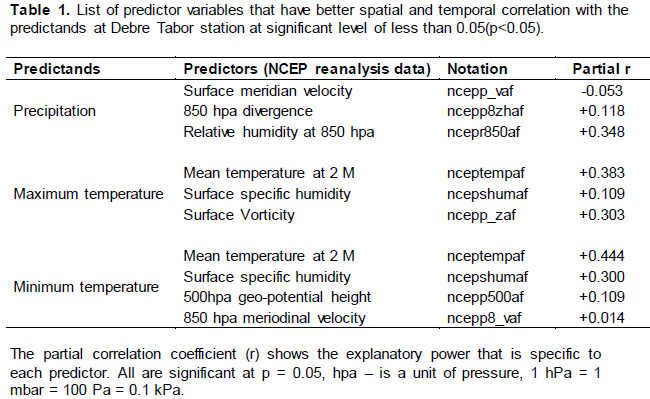
The downscaling of GCMs data using SDSM was done following the procedures suggested by Wilby and Dawson (2007). The required large scale predictor data that represents Gumara watershed were freely downloaded from the African window using the nearest average location of Gumara watershed from the web address of http://www.cccsn.ec.gc.ca/?page=pred-hadcm3. The predictor data files downloaded from the grid of interest consists of NCEP_1961-2001, H3A2a_1961-2099 and H3B2a_1961-2099. The predictand variables used were precipitation and maximum and minimum temperature obtained from the Ethiopian Meteorological Agency. Even though different weather stations are found in and around Gumara watershed, only the precipitation and maximum and minimum temperature at Debre Tabor station were used for downscaling since it has long-term and high-quality data. Moreover, since all stations in the drainage basin are located within the same grid box, the climate projection results from Debre Tabor station were assumed to represent other stations in the drainage basin.
Quality control checks in SDSM were used to identify gross data errors, specification of missing data codes and outliers prior to model calibration. Screening of predictors which have high correlation with the observed precipitation, maximum and minimum temperature at Debre Tabor station was done to select appropriate downscaling predictor variables for model calibration. The Conditional and unconditional processes was specified before the analysis takes place. In case of daily temperature where the predictand-predictor process is not regulated by intermediate process unconditional process was used, whereas for daily precipitation where the amounts depend on the occurrence of wet-day, the conditional process was chosen. Significance value is used to test the significance of predictor–predictand correlations and it was set as the default of (p<0.05 (5%).
The National Center for Environmental Prediction (NCEP_1961 to 2001) reanalysis data were used to calibrate and validate the SDSM model. The station data obtained from Ethiopian Meteorological Agency from 1986 to 1995 were used for calibration whereas from 1996-2000 they were used for validation at a monthly model type in order to see the monthly temporal variations. Though, ensemble sizes of up to a maximum of 100 are possible, the default ensemble size (20) was taken, and the mean of ensemble members were used even though individual ensemble members were equally plausible. The extent to which ensemble members differ depends on the relative significance of the deterministic and stochastic components of the regression models used for downscaling (Wilby and Dawson, 2007).
The regression weights produced during the calibration process were applied to the time series outputs of the GCM model based on the assumption that the predictor-predictand relationships under the current condition remain valid for future climate conditions. Twenty ensembles of synthetic daily time series data were produced for each of the two SRES scenarios for a period of 139years (1961 to 2099). Finally the mean of the ensembles for the specified period were produced for maximum and minimum temperature and precipitation. The period from 1976 to 2000 were considered as a base period against which comparisons were made for future periods (2001 to 2099). The future periods were divided into four time horizons from 2001 to 2025, 2026 to 2050, 2051 to 2075 and 2076 to 2099, and analyses were made for each time periods on seasonal and annual basis.
Bias correction was adapted to compensate for any tendency to over– or under–estimate the mean of conditional processes by the downscaling model. Linear Scaling (LS) method was adapted to correct the model errors due to its simplicity and the objective of the study mainly focuses on mean differences. Precipitation is typically corrected with a multiplier and temperature with an additive term on a monthly basis and the bias behavior of the model does not change with time that is, the transfer function is time independent and thus applicable in the future (Hagemann et al., 2011).
Thus to obtain the bias corrected future precipitation and temperature, the climate signal (difference between future and baseline climates) was first removed before the correction is adjusted. Then the future simulated results were added (temperature) and multiplied (precipitation) with the changing factor obtained in the baseline correction for each month. Then, initially removed climate signal is added back to create a bias corrected precipitation and temperature scenario for the future.
Hydrological modeling approach
Soil water assessment tool (SWAT) model was selected to assess the hydrological responses of climate change on Gumara catchment. SWAT is a River basin scale, continuous time, a spatially distributed model developed to predict the impact of land management practices on water, sediment and agricultural chemical yields in large complex watersheds with varying soils, land use and management conditions over long period of time. The model can be used to simulate a single watershed or a system of multiple hydrologically connected watersheds (Neitsch et al., 2009).
The main reasons for the selection of SWAT model for this study was due to the model’s moderate input data requirement, ability to simulate the major hydrological processes and its availability. The model is physically based, spatially distributed, and belongs to the public domain. SWAT can also simulates hydrological outputs based on a changed climate if the changes in the climate parameters are given as an input to the model. Moreover, SWAT has previously been applied in the highlands of Ethiopia and has given satisfactory results in the Lake Tana basin and upper Blue Nile basin of Ethiopia (Setegn et al., 2009; Easton et al., 2010; Betrie et al., 2011).
The first step in SWAT simulation process is delineating the watershed. Gumara watershed was delineated based on the automatic procedure using 30m digital elevation models (DEM) data into sixteen hydrologically connected sub-watersheds for use in watershed modeling and the final outlets found at the gauging station was used for comparison of measured and predicted flows. After watershed delineation of Gumara watershed was completed, the Hydrologic Response Units (HRU) were defined in ArcSWAT by overlaying soils, land use and slope classes. Hydrologic Response Units (HRU) HRUs are lumped land areas within the sub-basin that are comprised of unique land cover, soil, and management combinations that enables the model to reflect differences in evapotranspiration and other hydrologic conditions for different land covers/crops and soils which increases (Neitsch et al., 2009) the accuracy of load predictions and provides a much better physical description of the water balance.
SWAT requires daily values of precipitation, maximum and minimum temperature, solar radiation, relative humidity and wind speed. The weather data collected from seven stations in the study area have; however, missing data. Among the seven stations, daily rainfall, temperature, wind speed, solar radiation and relative humidity data, from three stations namely Bahir Dar, Woreta and Debre Tabor weather stations were used as an input to calculate statistical monthly weather generator parameters which are calculated by Weather parameter calculator program. Using thus three stations the SWAT model generates representative weather variables for Gumara watershed and fills the missed values.
Surface runoff was estimated using Soil Conservation Service (SCS) curve number method (USDA-SCS, 1972) and Penman-Monteith method was applied for Gumara watershed to estimate potential evapotranspiration. SWAT simulates the runoff for each HRU. Two options are available to route the flow in the channel networks; the variable storage and Muskingum methods. Both are variations of the kinematic wave model. The variable storage method uses a simple continuity equation in routing the storage volume, whereas the Muskingum routing method models the storage volume in a channel length as a combination of wedge and prism storages. For this study variable storage method was selected to rout the flow of water in the channel.
The sensitivity analysis was undertaken by using a built-in tool in SWAT that uses the Latin Hypercube One-factor-At-a-Time (LH-OAT) design method to minimize the number of parameters to be used in the calibration step and select the most sensitive parameters largely controlling the behavior of the simulated process. After running the sensitivity analysis, the mean relative sensitivity (MRS) of the parameters were used to rank the parameters, and their category of sensitivity were also defined based on the Lenhart et al. (2002) classification that is, small to negligible (0≤MRS<0.05), medium (0.05≤MRS<0.2), high (0.20≤MRS<1.0), and very high (MRS≥1.0). Based on these classifications, sensitive parameters with mean relative sensitivity value of medium to very high were selected for calibration of the simulated flows for Gumara River.
The daily River flows at Gumara River gauge station obtained from Ethiopian Ministry of Water, Energy and Irrigation were used for calibration and validation of the simulated flows and climate change impact analysis. Measured Stream flows at Gumara River gage station from 1991 to 2000, were used for calibration of SWAT model including the first two years warm up period. Refsgaard and Storm (1996) distinguished three types of calibration methods: the manual trial-and-error method, automatic or numerical parameter optimization method; and a combination of both methods. According to Refsgaard and Storm (1996) the first method is the most common, and especially recommended for the application of more complicated models in which a good graphical representation is a prerequisite. Automatic calibration on the other hand relies heavily on the optimization algorithm and the specified objective function (Gan, 1988) in which only few optimized parameters may be used for calibration.
For this study, SWAT model was calibrated manually by adjusting sensitive parameters that affect surface runoff which were identified during sensitivity analysis until a satisfactory objective function was achieved (that is, percent difference (D) < 15%, correlation coefficient (R²) > 0.6 and sutcliffe simulation efficiency (ENS) > 0.5). Validation was done with an independent data set without making further adjustments of the calibration parameters. Model validation confirmed the applicability of the watershed-based hydrologic parameters derived during the calibration process. Measured Stream flows at Gumara River gage station from 2001-2005 were used for the validation process to evaluate the model accuracy.
RESULTS
SDSM calibration and validation
The calibration was done at a monthly model type in order to see the monthly temporal variations. Monthly precipitation, maximum temperature, and minimum temperature values were generated based on the selected predictor variables of the NCEP data (Table 1). The first step in the downscaling procedure using SDSM was to establish the empirical relationships between the predictand variables (minimum temperature, maximum temperature, and precipitation) collected from stations and the predictor variables obtained from the NCEP re-analysis data for the current climate. It involves the identification of appropriate predictor variables that have strong correlation with the predicted variable. Predictors with better spatial and temporal correlations are shown in Table 1.
The calibration and validation results of the SDSM showed that the downscaled NCEP precipitation, maximum and minimum temperature have good agreements with the observed values at Debre Tabor station before bias correction as shown in the Table 2. Due to the conditional process (dependent on other intermediate processes like on the occurrence of humidity, cloud cover, and/or wet-days) and high spatial variability of precipitation, the calibration and validation results are comparatively less than the maximum and minimum temperature (Lijalem, 2006; Habtom, 2009; Dile et al., 2013). However, for this study a good agreement between generated and observed precipitation was resulted (Table 2) and this might be due to less spatial variability of precipitation on Gumara watershed.
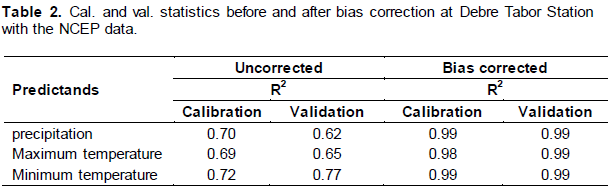
Hence the SDSM model resulted in satisfactory multiple regression equation parameters for precipitation, maximum and minimum temperature. Thus, it may be inferred that the SDSM model is able to generate weather variables which resembles the observed values at the station level and able to generate future scenarios under a given emission scenarios using the assumptions that the predictand-predictor relationship under the present condition are also valid for the future. Even though the correlation results showed good agreements before bias correction, the SDSM model over estimates in some months and under estimate in some other months. To compensate for any tendency to over– or under–estimate the mean of conditional processes by the downscaling model, bias correction was applied and it perfectly matches the observed predicts and with generated values.
The calibrated model was used to generate ensemble members of synthetic daily weather series giving daily atmospheric predictor variables from the HadCM3 A2a and B2a scenarios. The regression weights produced during the calibration process were applied to the time series outputs of the GCM model based on the assumption that the predictor-predictand relationships under the current condition remain valid for future climate conditions.
Climate change projections for the future periods
Maximum temperature
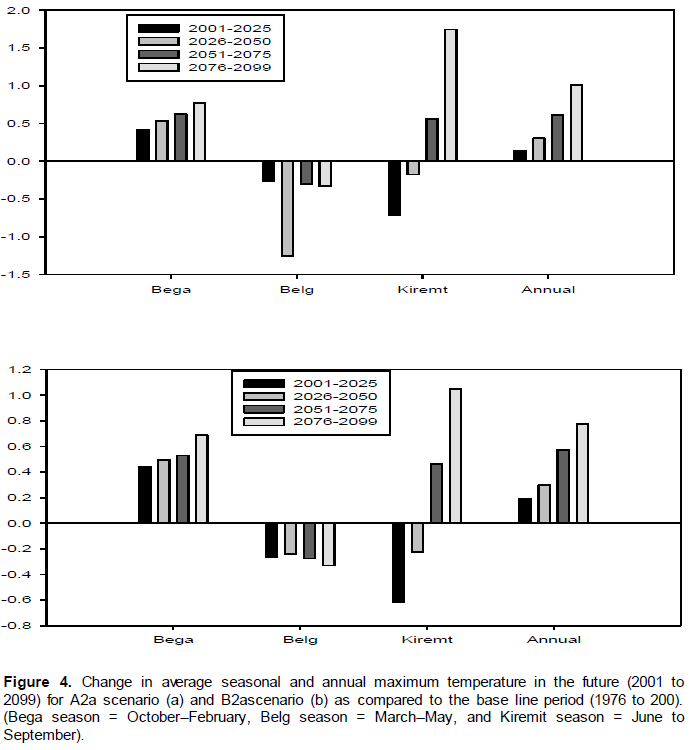
The results of the statistical downscaling model on annual bases for mean maximum temperature showed an increasing trend (Figure 5) for both A2a and B2a scenarios for the future period (2001 to 2099) as compared to the base period (1976 to 2000) in which the increment ranges between 0.14°C (2001 to 2025) and 1.01°C (2076 to 2099) for A2a emission scenarios while for B2a emission scenario, it ranges between 0.2°C (2001 to 2025) and 0.77°C (2076 to 2099). Seasonally, maximum temperature does not show clear trends for both A2a and B2a scenarios. For A2a scenario the maximum increment of maximum temperature reaches up to 1.74°C (2076-2099) in Kiremit (JJAS) season and the maximum reduction reaches up 1.26°C (2026 to 2050) in Belg (MAM) season while for B2a scenario, seasonal increment of maximum temperature reaches up to 1.05°C (2076 to 2099) in Kiremit (JJAS) season and reduced by 0.62°C in Kiremit (JJAS) season (Figure 4).
Minimum temperature
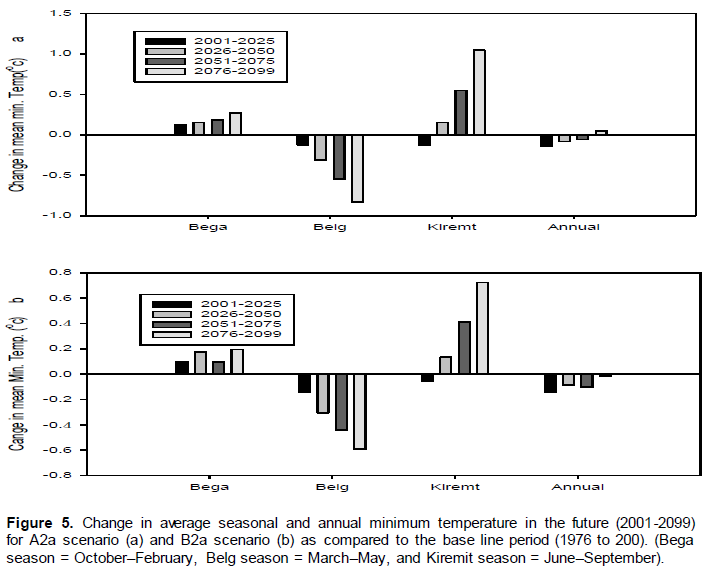
Similar to maximum temperature, seasonal variation of minimum temperature due to climate change does not show clear trends. For A2a scenario, seasonal minimum temperature for the future period increases by a maximum of 1.05°C (2076 to 2099) in Kiremit (JJAS) season and decreases by 0.83°C (2076 to 2099) in Belg (MAM) season while for B2a scenario it increases by a maximum of 0.72°C and decreases by 0.59°C within the same time horizon (2076 to 2099) and season (Belg) as that of A2a scenario. Regarding to the annual temperature, the minimum temperature indicates very minor changes due to climate changes for both A2a and B2a scenario as shown in the Figure 5a and b. Thus, it can be concluded that climate change causes high seasonal variation (increase and decrease) of maximum and minimum temperature in four different time horizons while annually the impact shows clear increasing trend.
Precipitation
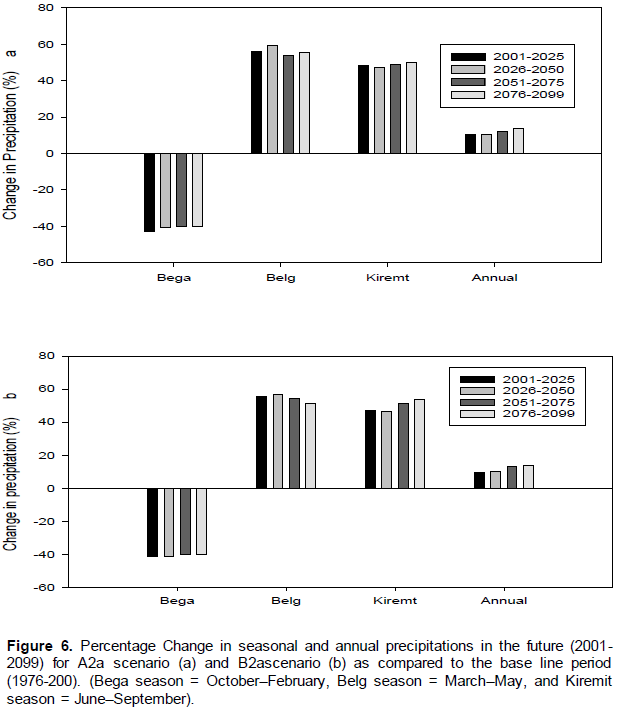
As it can be seen from the Figure 6a and b, the overall results (2001 to 2099) for annual precipitation increases from 10.49 (2001 to 2025) to 13.7% (2076 to 2099) for A2a scenario and for B2a the increment ranges between 6.4 (2001 to 2025) and 13.72% (2076 to 2099). Seasonally, the precipitation increases in Belg (March to May) and Kiremit (June to September) in which the precipitation increases up to a maximum of 59.33% (2026 to 2050) for A2a scenario and 56.6% (2026 to 2050) for B2a scenario. Precipitation decreases in Bega (October to February) season for both scenarios by 43% (2001 to 2025) and 41.2% (2001 to 2025) for A2a and B2a scenarios respectively.
SWAT hydrological modelling
SWAT sensitivity analysis
In SWAT hydrological modeling, identifying the most sensitive parameter that highly influences the surface runoff and ground water flows, calibration and validation of SWAT model applicability and simulating the hydrological responses of Gumara catchment under present and future climatic variables were discussed.
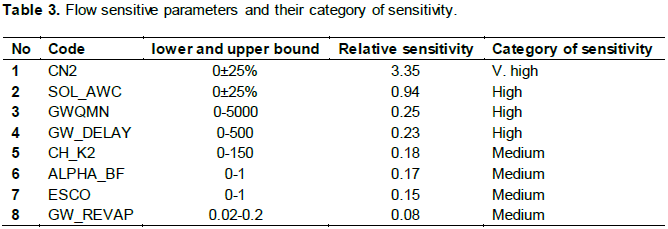
Among twenty six parameters used for the sensitivity analysis, only 8 of them revealed meaningful effect on the monthly flow simulation of the Gumara River. Curve number (CNII), available water capacity (
SWAT calibration and validation outputs
The calibration and validation results (Figure 7a and b) showed that there is a good agreement between the simulated and measured monthly flows. Percent of errors of the observed and simulated monthly flows at Gumara gauge station during the calibration and validation are 1.2 and 6.63% respectively which are well within the acceptable range of ±15%.
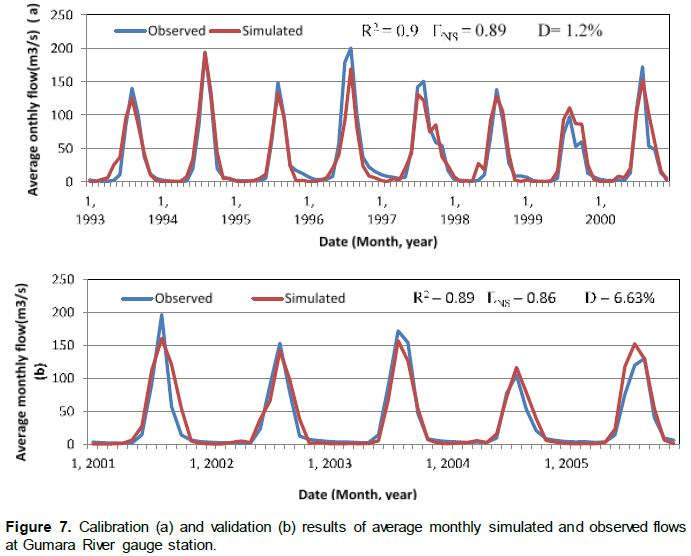
Further a good agreement between observed and simulated monthly flows are shown by the coefficient of determinations (R2=0.9) and the Nash-Suttcliffe simulation efficiency (ENS=0.89) in the calibration period and R2=0.89 and ENS=0.86 during the validation period. Thus, all the model evaluation criteria fulfilled the requirements suggested by Santhi et al. (2001) for R² >0.6 and ENS> 0.5. Hence, the set of optimized parameters used during calibration process can be taken as the representative set of parameter to explain the hydrologic characteristic of the Gumara watershed and further simulations using SWAT model can be carried out by using these parameters for any period of time. Thus, SWAT model was rerun to simulate the hydrological responses of Gumara catchment due to climate change using the predicted future precipitation and temperature as an input and keeping other climatic and land use changes constant.
From the calibration and validation results, it may be deduced that the model represents the hydrological characteristics of the watershed and can be used for further analysis.
Climate change impact on Gumara river flow
Stream flows largely depend on the amount of precipitation falling on the catchment, and the amount of evapotranspiration released from that catchment. The change in the amount of precipitation, minimum and maximum temperature due to climate change obviously changes Gumara River flow volumes. Since the main objective of this study is to get an indicative possible effect of climate change on the stream flow assuming changes only in the two main drivers (Temperature and precipitation), other climate variables such as wind speed, solar radiation, and relative humidity and non-climatic variables (that is, land use changes) were assumed constant throughout the future simulation periods which are not possible in actual case.
The impact of climate change on stream flow was predicted based on conditional temperature and rainfall changes on seasonal and annual basis. The average annual total flow volume for the future four time horizons showed an increasing trend (Figure 8) for both A2a and B2a scenarios as compared to the base period in which the flow volume increases from 13.04% (2001 to 2025) to 17.8% (2076 to 2099) for A2a scenario and for B2a scenario the increment ranges between 12.13% (2001 to 2025) and 17.5% (2076 to 2099). Increase in average total annual flow volume is observed for the periods which show a corresponding increase in mean annual precipitation (Figure 7), and the results of this study confirmed the previous researches (Beyene et al., 2010; Dile et al., 2013).
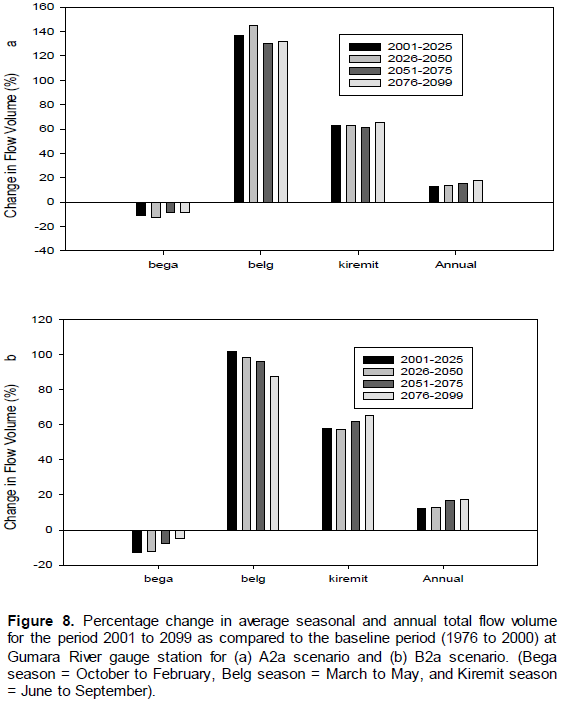
Seasonally, the highest increment is shown in Belg season (MAM) in which the flow volume increases from 130.33 (2051 to 2075) to 144.65% (2026 to 2050) for A2a scenario and from 87.76 (2076 to 2099) to 101.58% (2001 to 2025) for B2a scenario. Significant changes of average total flow volume were also found in Kiremit (JJAS) season in which the flow volume increases from 61.6 (2051 to 2075) to 65.33% (2076 to 2099) for A2a scenario and for B2a scenario the increment ranges between 57.2 (2026 to 2050) and 65.5% (2076 to 2099). In Bega season, the average total flow volume decreases between 8.8 (2051 to 2075) and 12.6% (2026 to 2050) for A2a scenario and for B2a scenario it decreases between 4.7 (2076 to 2099) and 13% (2001 to 2025). The decrease in flow volume in Bega season also corresponds to the decrease in precipitation and this may causes water shortage problems.
DISCUSSION
Understanding the problem is part of the solution and predicting the level of climate change impact on water resources is a prerequisite for planners, decision makers and concerned bodies to reduce prevent and/or to find the possible adaptation measures. Hence, the impact of climate change on Gumara River was carried out to address part of the global problem by showing the possible indicative predictions of climate changes.
The study predicted the conditional impact of rainfall and temperature changes on the hydrology of the Gumara catchment using the HadCM3 GCM A2a and B2a climatic scenarios for the 2001 to 2099 periods. We applied the SDSM statistical downscaling tool to evaluate the GCM outputs. The SWAT model was used to study the consequences of climate change on the hydrology of Gumara catchment. We believe that results presented in this research are representative for a majority of GCM output and therefore our results are plausible estimates of future effects of climate change.
The study confirmed that the Statistical downscaling Model (SDSM) is able to simulate climatic events. The calibration and validation results of SDSM showed that the model is able to simulate the climatic variables (precipitation and temperature) which follow the same trend with the observed one. Even though, the precipitation is a conditional process and high special variability, the overall result from SDSM is well correlated with the observed precipitations. Hence, SDSM can predict the future climatic events under changing conditions based on the assumption that the predictor-predictand relationships under the current condition remain valid for future climate conditions.
On seasonal basis, precipitation and temperature do not show systematic trends for both A2a and B2a scenarios that is, precipitation and temperature increases some season and decreases in some other season. On seasonal basis, the increment of maximum temperature reaches up to 1.74°C (2076 to 2099) in Kiremit (JJAS) season and the maximum reduction reaches 1.26°C in Belg (MAM) season for A2a scenario. For B2a scenario, the maximum mean seasonal increment of maximum temperature reaches up to 1.05°C (2076 to 2099) in Kiremit (JJAS) season and the maximum reduction reaches up to 0.62°C Kiremit (JJAS) season. This implies that seasonal precipitation and temperature will be highly fluctuated due to climate change for the future period and these variations in turn have great impacts on the variation of hydrological responses of Gumara catchment. On the annual basis, both temperature and precipitation shows systematic increasing trend for A2a and B2a scenarios for the future period. Our temperature projection results an increase in mean annual temperature up to 1.01°C (2076 to 2099) for A2a emission scenarios and 0.77°C (2076 to 2099) for B2a scenarios. The annual increment is not worth for both scenarios based on IPCC-TGICA (2007) in which the globally averaged surface air temperature is projected to warm 1.4°C to 5.8°C by 2100.
The SDSM precipitation weather generation satisfactorily replicates the observed precipitation (Table 2). This suggests that SDSM may perform well in simulating the future climatic condition of the study area. As in any type of modeling study the results have to be judged against uncertainties. Even if we cannot quantify these uncertainties in this study it is well known that uncertainty increases along the sequence temperature-precipitation-runoff. Consequently, results have to be viewed in this perspective.
On the other hand, similarity in results with other studies using other approaches corroborates results. In any case, percentage changes’ of different hydro-meteorological quantities as in this study should not be seen as facts but instead as an indication of possible future outcomes with a high degree of uncertainty. In view of the above, the SDSM downscaling indicates that annual precipitation increases up to 13.7% (2076 to 2099) for A2a scenario and 13.72% (2076 to 2099) for A2a scenario. The results of this study was thus in line with the previous researches done on Tana basin, and upper Blue Nile basin (Kim et al., 2008; Taye, 2010). Moreover, researches done by UNFCCC (2007), Siri Eriksen et al. (2008) and Bates et al. (2008) showed that annual mean rainfall increases over parts of Eastern Africa due to climate change.
Seasonally, the precipitation increases (in Belg and Kiremit season) up to a maximum of 59.33% (2026 to 2050) for A2a scenario and 56.6% (2026 to 2050) for B2a scenario and decreases (Bega) by 43% (2001 to 2025) and 41.2% (2001 to 2025) for A2a and B2a scenarios respectively. Beyene et al. (2010), Rizwan et al. (2010) and Dile et al. (2013) on upper Blue Nile basin also showed increasing trends in Kiremit Season. The increment of precipitation in Belg and Kiremit season may have positive implications since these two seasons are the cropping season in Ethiopia.
The results of the hydrological model calibration and validation indicate that SWAT model is able to accurately explain the hydrological characteristic of Gumara watershed. The statistics of the model performance criteria (Nash–Sutcliffe model efficiency (ENS), coefficient of determination (R²) and percentage deviation of simulated mean from measured one (D)) indicates that monthly simulated flow by SWAT corresponded very well with the measured values at Gumara River gauge station.
Following to the calibration and validation, the SWAT model was re-run using the downscaled precipitation and maximum and minimum temperature to predict the impact of climate changes on the hydrology of Gumara River. Results show that average seasonal and annual inflow volume changes mainly corresponding to the change in precipitation. Average Seasonal flow volume increases in Belg and Kiremit seasons and the increment is more significant in Belg season (144.65% for A2a scenario and 101.58% for B2a scenario).
Rizwan et al. (2010) also showed that the runoff increases in the future in the major rainy seasons (June-September) which causes the possibility of flood occurrences in the future due to the extreme runoff. This study also reveals the increment of runoff in Kiremit season in line with Rizwan et al. (2010). Annually, the average flow volume showed an increasing trend in which the flow volume increases from 13.04% (2001 to 2025) to 17.8% (2076 to 2099) for A2a scenario and for B2a scenario the increment ranges between 12.13% (2001 to 2025) and 17.5% (2076 to 2099). As Gumara River is one of the tributary River feeding in to Lake Tana, any change in River flow is likely to affect the Lake. The increased runoff generally improves water supply reliability and contributes significant inflows into the Lake Tana. On the other hand there is a flood prone area in some parts of Gumara catchment near the shore of the lake. Thus, the increased runoff volume in Kiremit season my devastate flood damages and due consideration should be taken to prevent future flood hazards.
In conclusion, the hydrology of Gumara River is highly vulnerable to climate change which causes high temporal variation of flow volumes. This may need serious concerns for food security and water resource sustainability. Therefore, prevention and adaptation strategies in and around the Gumara catchment have to be developed so as to maintain sustainability of available water resources and to prevent extreme events. Generally, Results presented in this study can provide valuable insight to decision makers on the degree of vulnerability of Lake Tana Basin to climate change, which is important to design appropriate adaptation and mitigation strategies.
CONFLICT OF INTERESTS
The authors have not declared any conflict of interests.
ACKNOWLEDGMENT
The authors are thankful to the Ethiopian Ministry of Water Resources and National Meteorological Services Agency which provided the data. Moreover, they would like to thank Madawalabu University for letting them carry out this research without obligating to do extraworks.
REFERENCES
|
Bates BC, Kundzewicz ZW, Wu S, Palutikof JP (Eds.) (2008). Climate Change and Water. Technical Paper of the Intergovernmental Panel on Climate Change, IPCC Secretariat, Geneva 210 p. |
|
|
Betrie G, Mohamed Y Van AG, Srinivasan R (2011). Sediment management modelling in the Blue Nile Basin using SWAT. Hydrol. Earth Syst. Sci. 15:807-818. |
|
|
Beyene T, Lettenmaier DP, Kabat P (2010). Hydrological impacts of climate change on the Nile River Basin: Implications of the 2007 IPCC scenarios. Clim. Change 100:433-461. |
|
|
Boosik K, Jorge AR (2007). Response of Stream flow to Weather Variability under Climate Change in the Colorado Rockies. |
|
|
Chong-yu X (1999). From GCMs to River flow: a review of downscaling methods and hydrologic modeling approaches. Department of Earth Sciences, Hydrology, Uppsala University, Villavägen 16:S-75236 Uppsala, Sweden. |
|
|
Dile YT, Berndtsson R, Setegn SG (2013). Hydrological Response to Climate Change for Gilgel Abay River, in the Lake Tana Basin - Upper Blue Nile Basin of Ethiopia. PLoS ONE 8(10): e79296. |
|
|
Easton ZM, Fuka D, White E, Collick AS, Ashagre BB (2010). A multi basin SWAT model analysis of runoff and sedimentation in the Blue Nile, Ethiopia. Hydrol. Earth Syst. Sci. 14:1827-1841. |
|
|
Elshamy ME, Seierstad IA, Sorteberg A (2008). Impacts of climate change on Blue Nile flows using bias-corrected GCM scenarios. Hydrol. Earth Syst. Sci. Discuss. 5:1407-1439. |
|
|
Gan TY (1988). Application of scientific modelling of hydrological response from hypothetical small catchments to assess a complex conceptual rainfall runoff model. Water Resources Series Technical reports no. 111. Department of Civil Engineering, University of Washington, Seattle, Washington |
|
|
Habtom M (2009). Evaluation of Climate Change Impact on Upper Blue Nile Basin Reservoir. Case Study on Gilgel Abay Reservoir, Ethiopia. MSc thesis |
|
|
Hagemann S, Chen C, Haerter JO, Heinke J, Gerten D, Piani C (2011). Impact of a statistical bias correction on the projected hydrological changes obtained from three GCMs and two hydrology models. J. Hydrometeorol. 12(4):556-578. |
|
|
IPCC (2007). Summary for Policymakers, In: Climate Change 2007: The Physical Science Basis. Contribution of Working Group I to the Fourth Assessment Report of the Intergovernmental Panel on Climate Change [Solomon SD, Qin MM, Chen Z, Marquis M, Averyt KB, Tignor M, Miller HL (eds.),Cambridge University Press, Cambridge, United Kingdom and New York, NY, USA. |
|
|
IPCC-TGICA (2007). General Guidelines on the Use of Scenario Data for Climate Impact and Adaptation Assessment. Version 2. Prepared by Carter TR on behalf of the Intergovernmental Panel on Climate Change, Task Group on Data and Scenario Support for Impact and Climate Assessment 66 p. |
|
|
Khan MS, Coulibaly P, Dibike Y (2006). Uncertainty analysis of statistical downscaling methods using Canadian Global Climate Model predictors. Hydrol. Proc. 20:3085-3104. |
|
|
Kim U, Kaluarachchi JJ, Smakhtin VU (2008). Climate change impacts on hydrology and water resources of the Upper Blue Nile River Basin, Ethiopia. Colombo, Sri Lanka: International Water Management Institute. |
|
|
Kigobe M, Griensven Van A (2010). Assessing hydrological response to change in climate: Statistical downscaling and hydrological modelling within the upper Nile. Int. Environ. Model. Softw. Soc. |
|
|
Lenhart T, Eckhardt K, Fohrer N, Frede HG (2002). Comparison of two different approaches of sensitivity analysis, Physics and Chemistry of the Earth 27 (2002), Elsevier Sci. Ltd. 645-654 pp. |
|
|
Lijalem Z (2006). Climate Change impact on Lake Ziway Watershed Water Availability. MSc Thesis, Cologne, Germany. |
|
|
Michael DD, Daniel RC, Mary KM, Anne EJ (2004). Simulated Hydrologic Responses to Climate Variations and Change in The Merced, Carson, and American River Basins, Sierra Nevada, California, 1900–2099. Clim. Change 62:283-317. Kluwer Academic Publishers. |
|
|
Neitsch SL, Arnold JG, Kiniry JR, Williams JR (2009). Soil and Water Assessment Tool (SWAT) Theoretical Documentation, Version 2009, Grassland Soil and Water Research Laboratory, Agricultural Research Service, Black land Research Center, Texas Agric. Experiment Station. |
|
|
Refsgaard JC, and Storm B (1996). Construction, calibration and validation of hydrological models, Distributed Hydrological Modelling, Kluwer. Academic Publishers pp. 41-54. |
|
|
Rizwan N, Timothy B, Mohamed S, Mohamed E (2010). Blue Nile Runoff Sensitivity to Climate Change. Open Hydrol. J. 4:137-151. |
|
|
Santhi C, Arnold JG, Williams JR, Dugas WA, Srinivasan R, Hauck LM (2001). Validation of the SWAT model on a large River basin with point and nonpoint sources: J. Am. Water Resour. Association. |
|
|
Setegn SG, Srinivasan R, Dargahi B, Melesse AM (2009). Spatial delineation of soil erosion vulnerability in the Lake Tana Basin, Ethiopia. Hydrol. Process 23:3738-3750. |
|
|
Setegn SG, Srinivasan R, Melesse AM, Dargahi B (2009). SWAT model application and prediction uncertainty analysis in the Lake Tana Basin, Ethiopia. Hydrol. Process 24:357-367 |
|
|
Tao J, Yongqin DC, Chong-yu X, Xiaohong C, Xi C, Vijay PS (2007). Comparison of hydrological impacts of climate change simulated by six hydrological models in the Dongjiang Basin, South China. J Hydrol. 336:316-333. |
|
|
Taye MT (2010). Hydrological modeling of climate change impact on selected catchment of Nile River basin. J. Hydrol. Earth Syst. Sci. Discuss. 7:5441-5465. |
|
|
UNFCCC (2007). United Nations Framework Convention on Climate Change. Impacts, vulnerabilities and adaptation in developing countries. Bonn, Germany. |
|
|
USDA Soil Conservation Service (1972). National Engineering Handbook Section 4 hydrology. |
|
|
Wilby RL, Dawson CW (2007). Using SDSM version 4.1 SDSM 4.2; a decision support tool for the assessment of regional climate change impacts. User Manual. Leics, LE11 3TU, UK. |
|
|
Zulkarnain H, Sobri H (2012). Application of Statistical Downscaling Model for Long Lead Rainfall Prediction in Kurau River Catchment of Malaysia. Malaysian J. Civil Eng. 24(1):1-12. |
|
Copyright © 2024 Author(s) retain the copyright of this article.
This article is published under the terms of the Creative Commons Attribution License 4.0


