ABSTRACT
Rainfall is the most important element that limits the productivity of crops. Proper analysis of rainfall trend and understanding of its relationship with land productivity may help in planning purposes. Accordingly, a study was conducted to assess the statistical behavior of monthly, seasonal and annual rainfall in south west Ethiopia (Arba Minch). Furthermore, correlation statistics was employed to explain the relationship between land productivity and the pattern of rainfall for two major crops (teff and maize). The analysis for recent rainfall data (2005 to 2016) showed that the mean annual total rainfall was 962 mm, where the highest was recorded in 2007 (1,141 mm), and the least was in 2009 (638 mm). Similarly, the mean total rainfall for the short and main rainy seasons were 373 and 417 mm, respectively. The main rainy season (June to October) covered nearly 42% of the total rainfall and 39% of the annual rainfall was recorded during the short rainy season (March to May). With respect to the variability of the rainfall record, the short rainy season was more unpredictable than both (which had 34% coefficient of variation), the main rainy season and the total annual rainfall (26 and 15% in their respective orders). The nature of the variability is in agreement with the rest locations in the country, where in most cases, the total annual rainfall is expectable. The correlation analysis revealed that maize productivity had strong positive relationship with the rainfall record of the main and short rainy season, while teff negatively correlated with the distribution of the rainfall during 2011 and 2016. Similarly, rainfall during the month of June had high correlation (0.76) with the yield of teff, while for the same crop, the total rainfall for the month of September had equal negative correlation with the productivity (0.78).
Key words: Coefficient of variation, correlation, land productivity, rainfall, trend.
Food security endeavors are being challenged globally because of the threat posed by the ongoing climate change and global warming effects caused by the ever-increasing population growth and its increased dependence on the limited availability of land resources. Extreme weather and climatic events such as drought, floods and pest infestation also directly affect agricultural production.
The seasonal characteristic of rainfall is an important climatic element that affects the productivity and production potential of crops in the subsistence agricultural systems. With the current climate change threat, slight variabilities in the availability of rainfall can lead to a significant impact on crop yields (Velma, 2014).
Availability of soil moisture is one of the major factors that play a significant role in the productivity of rainfed agriculture. In smallholder rainfed farms, seasonal rainfall variability will determine the productivity and production potential of land resources. The production capacity of crops will also be determined based on the availability of water in the soil from planting to the harvest stages of crops. In line with this, the soil type, temperature and nutrient availability together with other factors will also impact on rainfed and irrigated way of crop production at a considerable level as the natural capitals of our environment are interrelated to each other. The pattern and intensity of precipitation have a direct relationship with the growth and development of crops, pests and disease outbreaks that eventually affect the yield potential of crops (John et al., 1992).
Higher amount of rainfall usually correlates with increased yield as well as lower variability in yield. A study conducted in sub-Saharan Africa, however, showed that there is a wide range of yield from the same amount of rainfall across locations, whereby 500 mm of rainfall yielded about 1.5 t ha-1 in East Shewa of Ethiopia, whereas the same amount of rainfall yielded about 10 t ha-1 in Kroonstad, South Africa. Hence, factors like soil texture and structure will influence the water holding capacity of the soil since clayey soils for instance will hold more water as compared to sandy soils (Harvest Choice, 2010).
Crop water requirement and growth stages also have an impact on the availability of soil moisture and productivity. Crops like chickpea are known to grow in moisture deficit areas, while maize requires a substantial amount of water if the production of the crop has to be maximized. Crops have different rate of water requirement across their growth stage, the highest demand being at the flowering and grain filling as compared to other vegetative growth stages. The availability of water during critical growth stages will have a direct impact on the production potential of a given area; therefore, under-standing these factors will help to deploy appropriate land management practices that can help increase the productivity of an area if the effect of rainfall variability and droughts is to be minimized.
In sub-Saharan Africa, agricultural activities play lead role in the overall growth and development of many nations. Ethiopia’s economy for instance, is largely dependent on agriculture. Agriculture is the main stay of livelihoods for more than 85% of the country’s population. The sector also accounts for 43% of the gross domestic product (GDP) and 90% of the country’s exports (USAID, 2016). Ethiopia’s agriculture is heavily dependent on natural rainfall, with irrigated land accounting for less than 1% of the total cultivated land (MEF, 2015). In Ghana, on the other hand, agriculture contributes 38% of the country’s GDP, accounts for about 75% of the export earnings, and provides over 90% for the food needs of the country (Francis and Tsunemi, 2013).
Low level of modern technologies utilization, strong reliance on rainfall and low levels of productivity characterizes Ethiopia’s agricultural systems. As previously pointed out by Woldeamlak (2009) and Befekadu and Berhanu (2000), rainfall is the most important climatic variable which impact the growth and development of field crops since water serves as a medium for the transport of nutrients in crop growth and development. Hence, shortage of water supply can directly inhibit the growth of crops and productivity. Von (1991) mentioned that, a 10% decrease in seasonal rainfall amount could cause a 4.4% decrease in food production.
Adugna (2005) attempted to show patterns of rainfall and provide insight which could help in the preparation of an early warning system in the country. The degree of total yield and productivity variability over time is not only caused by the amount of rainfall, but also by the pattern and frequency of rainfall cycle. Mean annual rainfall is often the only index of rainfall quoted for a place in view of rainfall-yield relationship analysis. For agriculture, however, the main issue is how often a given area receives too little, enough or too much of rain for a particular form of productive and sound crop production pattern. Station level rainfall data from 1954 to 1994 and agricultural production data of major cereal crops from 1980 to 1994 for four provinces of Ethiopia were used. Time series analysis techniques, auto-regressive moving average (ARMA) and vector auto-regressive (VAR) models were used to show the pattern of rainfall and response of yield to rainfall as well as to previous yield shocks.
The farming systems of south-western Ethiopia are largely dependent on short and erratic rainfalls that make the production systems and overall livelihoods of the community vulnerable for rainfall variability. Hence, any change in the rainfall amount and intensity is directly related to the survival of the people.
In line with this, in the context of the south-west, statistical analysis of the relation/correlation of rainfall with the overall crop production system is very meager and has not been thoroughly explored. This article therefore, aimed to examine the monthly, seasonal and annual rainfall statistics with respect to the productivity of two major cereals in the south west of the country in Arba Minch District (AMZDOA, 2017).
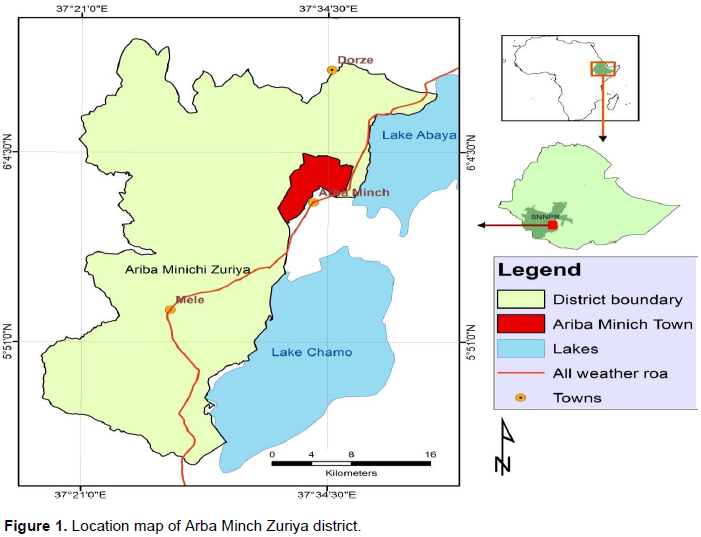
Description of the study area
The study area, Arba Minch Zuriya district is situated in Gamo Gofa zone of the Southern Nations and Nationalities Peoples’ Regional State of the Federal Democratic Republic of Ethiopia. The district is located 505 km south west of Addis Ababa and has a total of 29 kebeles (the smallest administration unit in the country). Agro ecologically, 4 kebeles are highlands, 15 are at mid altitude and the remaining 10 are found in the low land zone. The district has a total population of 74,879 in Arba Minch City and 164,529 in Arba Minch Zuriya District (Figure 1). The altitude of the district ranges from 1200 to 3300 masl with a rainfall amount of 800 to 1200 mm per annum while the temperature also ranges from 16 to 37°C. There are two cropping seasons, namely, Belg (short rainy season) and Meher (main rainy season). The short rainy season starts from March to May, while the main rainy season is from June to September. The district is also surrounded by the two Rift Valley lakes namely Chamo and Abaya that have a great economic as well as ecological value to the area (FDRE-PCC, 2008).
Data collection and analysis
Monthly total rainfall data for Arba Minch was obtained from the Meteorological Agency of Ethiopia (2005 to 2016). The statistical behaviours of the data were explained using simple statistical procedures and hence the average, standard deviation, kurtosis and skewness of the data were analysed. For the years between 2012 and 2016, correlations statistics was developed for the productivity of two important crops (kg ha-1) with the rainfall record of the district, monthly total, short rainy season (March to May), main rainy season (June to October) and the total annual rainfall.
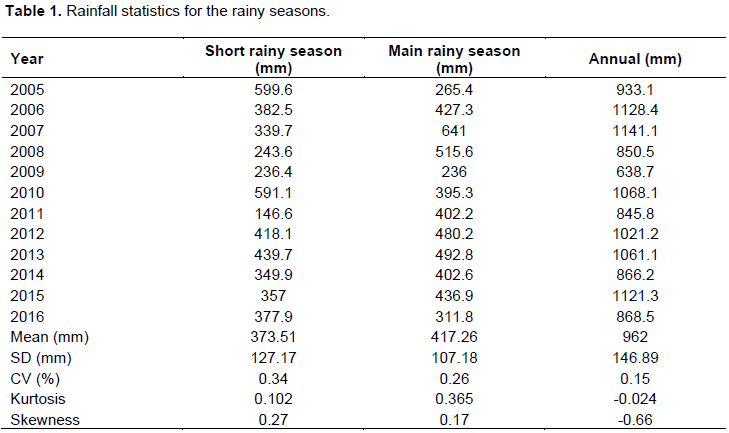
The seasonal rainfall statistics of the rainy season is presented in Table 1. According to the analysis results for the period between 2005 and 2016, the mean annual total rainfall was 962 mm where the highest was recorded in 2007 (1,141 mm), and the least was in 2009 (638 mm). Similarly, the mean total rainfall for the short and main rainy seasons was 373 and 417 mm, respectively. The main rainy season (June to October) covered nearly 42% of the total rainfall while 39% of the annual rainfall was recorded during the short rainy season (March to May), according to the mean statistics of the ten years’ data. The remaining 18% might have been linked to intermittent rain days out of the cropping seasons in the study area. With respect to variability of the rainfall record, the short rainy season was more unpredictable than both (which had 34% coefficient of variation), the main rainy season and the total annual rainfall (26 and 15% in their respective orders). The nature of the variability is in agreement with the rest of the locations in the country, where, in most cases, the total annual rainfall is expectable.
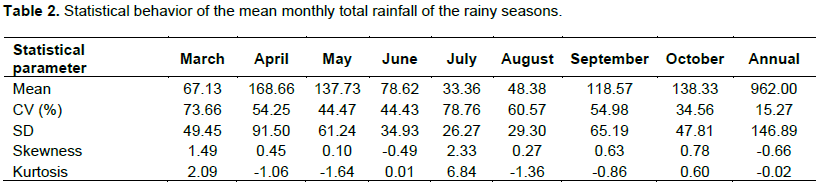
The highest mean monthly total rainfall was recorded in April (167 mm) and the minimum in March (67 mm) for the short rainy season (Table 2). During the main rainy season (June to October), October appeared to have the highest mean total monthly rainfall of 138 mm with a corresponding minimum mean rainfall of 33 mm recorded in July. As in other parts of the country, the monthly rainfall of the short rainy season varies more as compared to the corresponding main one. The extent of its variability ranged from 44% in May to 76% in March. In the main rainy season, the rainfall in July was less predictable than the rest of the months (78% of coefficient of variation) followed by August (60%) and September (55%). In a more variable rainfall pattern, planning for agricultural practices could be a problem. Hence, proper preparations should be done, for instance in setting the planting dates of crops. Moreover, if water saving practices can be exercised, the impact of temporal rainfall variability can be minimized to a certain extent. For this particular area, the two rainy seasons seem to merge, and if one can conserve soil moisture from the short rainy season, planting as early as June or July can help in obtaining good crop yield and the moisture during the late season could help in growing pastures for feeding animals that may be kept in the farm.
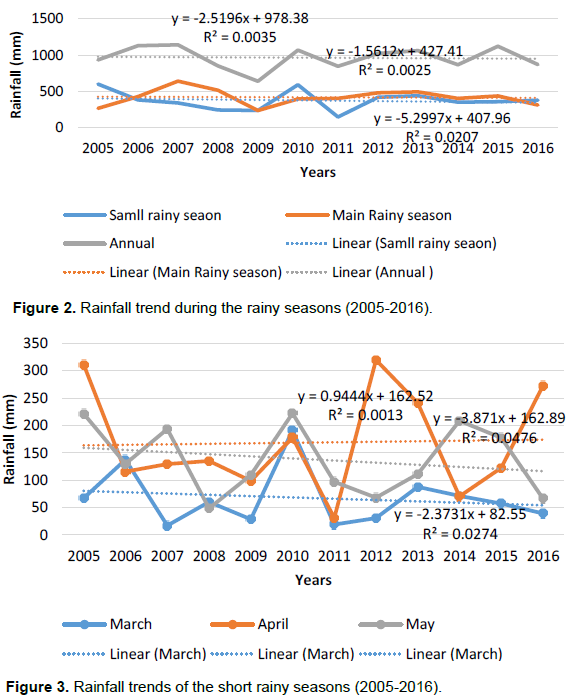
A selected trend in the rainfall record of the rainy seasons is presented in Figures 1 and 2. Analysis of the results showed that there was a decreasing trend in total rainfall for the two seasons and the annual total as well. The highest declining trend was for short rainy season, followed by the main rainy season and the total annual, respectively. As the study area is in the low land parts of the country where a decreasing trend of rainfall has also been observed, it can be linked to one of the effects of climate change in recent years.
A selected trend in the rainfall record of the rainy seasons is presented in Figures 2 and 3. Analysis of the results showed that there is a decreasing trend in total rainfall for the two seasons and the annual total as well. The highest declining trend was for short rainy season followed by the main rainy season and the total annual, respectively.
As shown in Figure 3, the rainfall trend for the months of short rainy season showed that only the month of April had an increase in trend, while the two months (March and May) showed declining trend. The rainfall peak for April was observed in 2012 (319 mm), and the least in 2014 (30 mm). In the period between 2006 and 2010, the temporal rainfall distribution for this particular month was more uniform than the rest of the periods. Agricultural planning during these years might not have been affected as the rainfall occurred in a more stable way. In the year 2012, there was a sharp increase to 319 from only 30 mm in 2012. It again sharply decreased the following year (2013) to 70 mm in 2014, and increased to 272 mm in 2016.
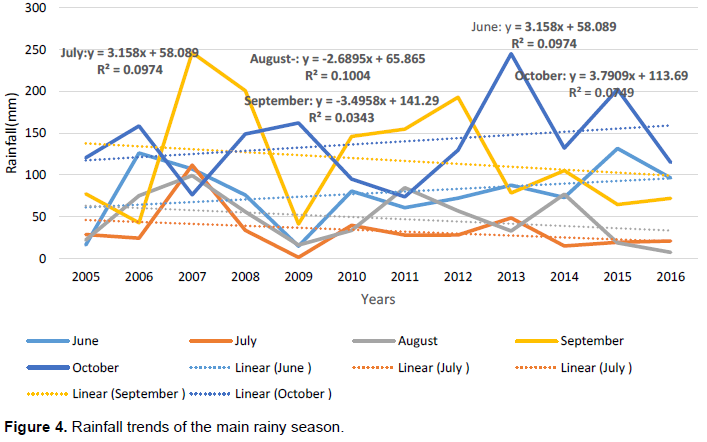
Similarly, the rainfall trend for the months of the main rainy season showed that all months except August and September had an increasing trend (Figure 4). In the month of June when the main rainy season is commonly expected to start, the highest peak rainfall was recorded in 2006 (126 mm) and the lowest was in the previous year (22 mm). Again, the rainfall trend for this month had a stable pattern during 2010 and 2014 which could allow smooth planting of common crops in the area.
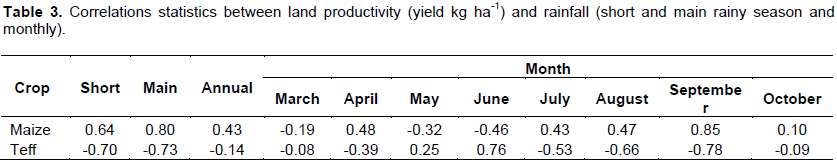
The nature and extent of dependence of the crop productivity of the study area on the total rainfall was also investigated. The results of the correlation analysis showed that maize productivity had strong positive relationship with the rainfall record of the main and short rainy season, while teff negatively correlated with the distribution of the rainfall that occurred during 2011 and 2016 (Table 3). Similarly, the rainfall during the month of June had high correlation (0.76) with the yield of teff while for the same crop, the total rainfall for the month of September had equal negative correlation with the productivity (0.78). As shown in Figure 2, the total rainfall showed an increasing trend for June; the positive correlation between the yield of maize and rainfall might be due to the event and the reverse may be true for September (the rainfall declined). As mentioned by Von (1991), a 10% decrease in seasonal rainfall amount could cause a 4.4% decrease in food production. Further, rainfall is the most important climatic variable which impacts the growth and development of field crops since water serves as a medium for the transport of nutrients in crop growth and development (Woldeamlak, 2009; Adugna, 2005; Befekadu and Berhanu, 2000). The negative correlation of teff productivity with increasing rainfall can be due to the fact that the amount may be surplus to its requirement, if other growth factors have not already affected the productivity. Researchers of this paper suggest that further investigation be done for better understanding of the negative correlation between the increasing rainfall and productivity of teff in the study area, for instance, use of improved varieties, planting dates and other agronomic practices that the farmers used during those periods.
The trend analysis of the recent climate (2005 to 2016) showed that the mean annual rainfall record of the study area was 962 mm, while the short and main rainy season had 373 and 417 mm, respectively. The annual and two rainy seasons showed a general decreasing trend while three months (June, July and September) from the main rainy season and April from the short rainy season had an increasing trend. With respect to the relation of the productivity of the crops included in this study, maize had strong positive relationship with the rainfall record of the main and short rainy season, while teff negatively correlated with the distribution of rainfall during 2011 and 2016. Similarly, the rainfall during the month of June had high correlation (0.76) with the yield of teff while for the same crop, the total rainfall for the month of September had equal negative correlation with the productivity (0.78). The positive correlation between the yield of maize and rainfall might due to this event and the reverse be true for September (the rainfall declined), while negative correlation of the productivity of teff with the increasing rainfall can be due to the fact that the amount may be surplus to its requirement, if other growth factors have not already affected the productivity. Furthermore, critical analysis of the temporal distribution of rainfall record on daily or weekly basis is highly recommended in order to understand the relationship between productivity of this crop (Teff) and rainfall behaviour of the study area.
The authors declare that there is no conflict of interest.
REFERENCES
|
Adugna L (2005). Rainfall Probability and Agricultural Yield in Ethiopia. Eastern Afr. Soc. Sci. Res. Rev. 21:57-96.
Crossref
|
|
|
|
AMZDOA (Arba Minch Zuriya District Office of Agriculture) (2017). Annual Report on the Productivity of the Major Crops in the District. Arba Minch, Ethiopia.
|
|
|
|
|
Befekadu D, Berhanu N (2000). Annual report on the Ethiopian economy, 1999/2000. Ethiopian Economic Association, Addis Ababa. (Report).
|
|
|
|
|
FDRE-PCC (Federal Democratic Republic of Ethiopia, Population Census Commission) (2008). Summary and Statistical Report of the 2007 Population and Housing Census. Addis Ababa, Ethiopia.
|
|
|
|
|
Francis N, Tsunemi W (2013). Rainfall Variability and Crop Production in Northern Ghana: The Case of Lawra District. Kochi University of Technology, Ghana.
|
|
|
|
|
John CD, David WH, Walter RB (1992). Soil, water and crop management alternatives in rainfed agriculture in the Sahel: an economic analysis. Agric. Econ. 7(3-4):267-287.
Crossref
|
|
|
|
|
HC (Harvest Choice) (2010). Rainfall Variability and Crop Yield Potential. International Food Policy Research Institute, Washington, DC., and University of Minnesota, St. Paul, MN. Available online at
View.
|
|
|
|
|
MEF (Ministry of Environment and Forest) (2015). Ethiopia's Second National Communication to the United Nations Framework Convention on Climate Change (UNFCCC). Addis Ababa, Ethiopia.
|
|
|
|
|
USAID (2016). Agriculture and Food Security in Ethiopia. Addis Ababa, Ethiopia.
|
|
|
|
|
Velma IG (2014). Impact of Climate Change on Water and Health. CRC Press Taylor & Francis Group 6000 Broken Sound Parkway NW.
|
|
|
|
|
Von BJ (1991). A Policy Agenda for Famine Prevention in Africa. Food Policy Statement No.13. IFPRI, Washington DC.
|
|
|
|
|
Woldeamlak B (2009). Rainfall Variability and Crop Production in Ethiopia Case study in the Amhara region. Proceedings of the 16th International Conference of Ethiopian Studies, ed. by Svein Ege, Harald Aspen, Birhanu Teferra and Shiferaw Bekele, Trondheim 2009.
|
|


