Full Length Research Paper

ABSTRACT
INTRODUCTION
Egypt has been pressed into the development of Sinai Peninsula, which has high potentials in mineral resources, tourism, and agricultural development. So it is indispensable to evaluate the potential groundwater resources for the development. In this work we outline a research project to study the Eocene aquifer, which is considered to be an important carbonate aquifer in the area of study.
In fractured aquifers, fluid may occur predominantly in an interconnected network of fractures while most of the fluid storage takes place in the relatively low permeability matrix blocks.Flow in fractured aquifers may be described
by either explicitly or implicitly accounting for the discrete fractures. Groundwater movement in such an aquifer is influenced by many factors that lead to highly spatially variable velocity field. These factors include variable fracture network geometry, small and large-scale roughness of the fracture walls, presence of fracture filling material. This study aims to verify the fracture zones and its continuities.
Few geological, geophysical and hydrogeological studies has been carried out on this area led to drilling few water wells. Water of these wells differs in quality and quantity due to different reservoir. So, it was considered to study the physical properties of subsurface succession. Since the fractured limestone aquifer is the main aquifer in that area, the research was focused to delineate the fractured zones both laterally and vertically. Although the primary flow pathways in the limestone aquifer are through a network of discrete fractures, these can be delineated through following the fractured zones from of the physical properties such as resistivity. Traditionally the hydrogeology of the limestone has been understood in terms of its representation as an "Equivalent Porous Medium" (EPM) comprises lower resistivity. So, following the direction of these fractures will be able to capture the heterogeneous properties that govern flow within the rock.
Study area
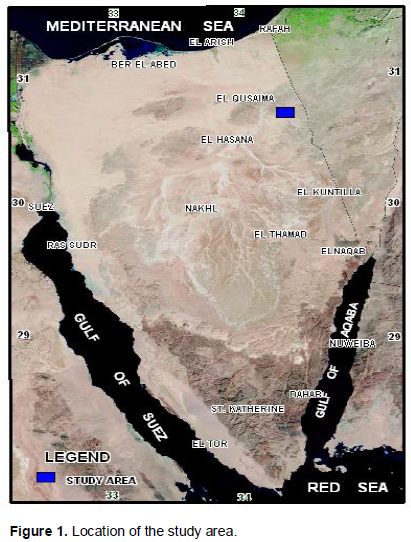
The area of study is located in the northeastern part of Sinai Peninsula, between longitudes 34 15 and 34 20 E and latitudes 30 30 and 30 45 N (Figure 1). It comprises the most populated area in central Sinai near Qussiema, Sabha and Hasana villages, where the main need of water in such area for drinking, domestic and agriculture.
GEOLOGY OF THE AREA
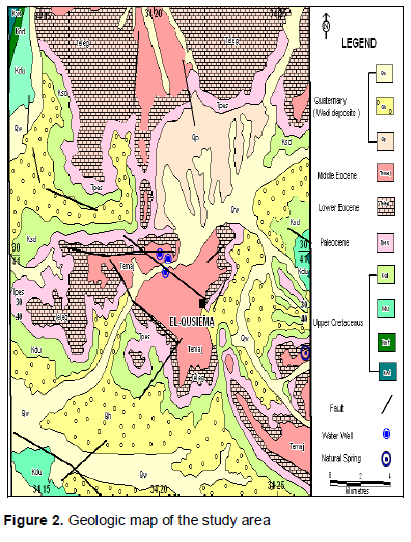
Very meager geological studies were done before, probably because of inaccessibility of the area. The present information came from publications of Sadek (1921), Hume (1962), Said (1962) and Issawi et al. (1994) in addition to the lithological information of the water wells drilled by water resources research institute in the late eighties. According to the Egyptian Geological Survey (EGSMA, 1993) the geology of the Sinai area ranges from Precambrian basement rocks to the Quaternary deposits. The Quaternary sediments cover most the area of study especially the central and northern parts where the thickness of the wadi deposits increase while they decrease in the southern part and the tertiary sediments began to appear and represented by the carbonate rocks of great thickness.
Few individual geological and hydrogeological studies were carried out on the area. Dealing with the geology of the area some regional and local studies were done, from which the works of Geophsica (1963). Some previous distributed studies were carried from these studies the works of Water Resources Research Institute (WRRI, 2006). Limited geophysical studies were carried on the study area.
The surface geology of the study area is described from the geological map of Sinai 1:: 500,000 : shown in Figure 2 executed by the Geological Survey of Egypt (1993). Most of the study area was covered by Pleistocene and Paleocene deposits. Pleistocene deposits are composed of alluvium deposits while Paleocene deposits which so called Esna shale formation is composed of marly shale. The eastern part of the study area is covered by Lower Eocene and Upper Cretaceous rock units. The Lower Eocene is represented by Egma Formation of chalky limestone. The Upper Cretaceous was represented by Sudr, Duwi, Matulla and Wata formations. Sudr Formation is mainly chalk of Maastrichtian age. Duwai formation is composed of alternated carbonate and clastic of Campanian age. Matullah formation is composed of limestone of Conician - Santonian age. Wata formation is composed of dolomitic limestone of Conician- Turonian age.
Field observations, measurements and techniques
The basic principles of the geoelectrical resistivity techniques have been discussed by many authors among them. Flathe (1976), Parasnis (1979), Zohdy et al. (1974), Telfordet et al. (1990) and Apparao (1991). Dobrin (1976) and Zohdy et al. (1974) have considered that, in making resistivity surveys a direct or low frequency current is introduced into the ground via two electrodes (current electrode). The potential difference is measured between a second pair of electrodes (potential electrode). If the four electrodes are arranged in any of the several possible patterns, the current potential measurements may be used to calculate resistivity. The electrical potential (V) at any point (P) caused by a point electrode emitting an electric current (I) in an infinite homogeneous and isotropic medium of resistivity is given by:

The derivation of the expression for the potential at the surface and presented in details by Koefoed (1979).
Hence

Where G is called the geometric factor of the electrode arrangement In case of Schlumberger: 
R= half current electrode spacing, r= half potential electrode spacing.
In case of Wenner: 
a=equaled electrode spacing
If the measurement of r is made over a semi-infinite space of homogeneous and isotropic material, the value of r computed from Equation (2) will be the true resistivity of that material. However, if the medium is inhomogeneous and/or anisotropic then, the resistivity computed from Equation (2) is called apparent resistivity (ra) (Zohdy et al., 1974).
Theoretically, it is well known that the hard massive limestone comprises higher resistivity values than the fractured. So, calibration of previously saturated fractured area with apparent and true resistivity can help in delineating and mapping the fractured zones and the direction of its extension.
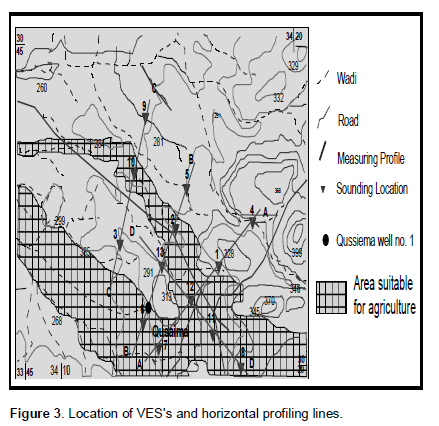
In this study, the Direct Current (DC) geolectrical method was applied for delineation the variation of apparent resistivity of sedimentary units. This succession acts as a conduit for groundwater accumulation depends on the degree of fractures and cavities. The Vertical Electrical sounding (VES) technique was applied to detect the physical properties of the rock sequence laterally and vertically. Schlumberger configuration of electrode array was applied for about 10 measuring points. These measuring points were arranged to cover the study area where the Eocene limestone aquifer is expected to be found at depth of about 100 m. Also, the Wenner configuration was applied to delineate the lateral extension of fractures after assuming a resistivity model for the lithologic succession from the vertical sounding technique. The electrode spacing in Wenner array was chosen according to the expected fractured zones of lower resistivity values that reflected from the VES.
Electrical resistivity measurements were applied using ABEM-AC Terrameter SAS equipment. Using Schlumberger and Wenner electrode array, ten VES-stations were conducted depending on the topographic accessibility in the surveyed areas. The sounding locations were chosen to cover the selected area and the existed wells. Also, horizontal profiling was done along the same profiles connecting VES's. Figure 3 shows the location of VES's and profiles.
Data processing and interpretation
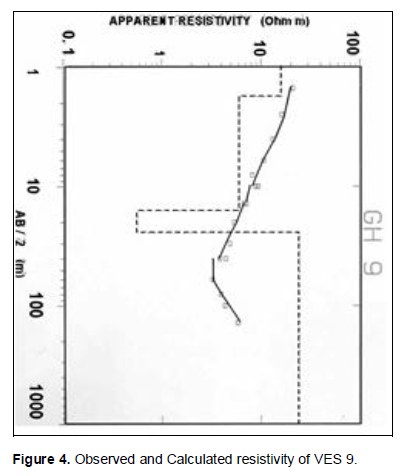
The best fitting of the observed and calculated curves which is the first step of data processing are shown in Figure 4. The data was processed using 1-D (one-dimensional) modeling program (RESIX-P, 1996). Processing of 1-D initiated first with forward modeling using an initial model based on a simple resistivity-depth transformation of the raw data and geological information from the available boreholes. Then and for getting a better fit, the inverse modeling has been iteratively processed. Inspection of the calculated VES curves reveals that, the number of the interpreted layers varies from three to five layers through at the study area.
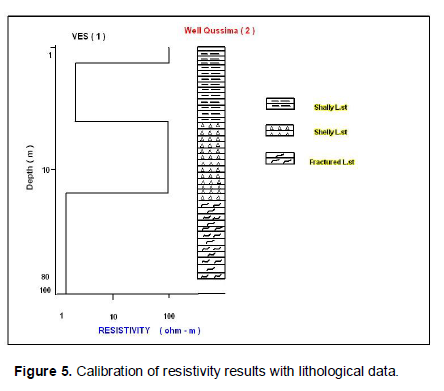
Initially, the true resistivity curve for one VES was correlated to lithologic control from the adjacent boreholes (Figure 5). The correlation indicated that relatively lower resistivities (less than 10 Ωm) characterize the topmost dry friable surface cover consists of sand, loam, some gravel and shaley limestone; the higher resistivity values corresponds to the dolometic limestone (non-Fractured) which represents the depth from 7 to 15 m. Another fractured zone extends downward from depth of 15 to 80 m and comprises lower resistivity values as shown in the Figure. Also, these lower resistivity values reflect that the salinity of this zone may be high.
Another calibration was done in the field through Wennermeasurements taken place for some clearly observed fractured areas at which true resistivity was measured with definite array and configuration. These measurements helped in feeding and application of a digital linear filter for transforming vertical electric sounding data (Das and Kumar, 1979), for calculating the number of fractures per unit area. This process was repeated at the different sites to verify the density and the direction of fractures. Analysis of these data and correlating with the resistivity of fractured zones helped in estimating the true resistivity of representative rock at its site location. Results of such analysis were represented in geoelectric sections and iso-resistivity maps.
RESULTS AND DISCUSSION
Qualitative and quantitative interpretation of resistivity data help estimating the smooth and layered model for profiles. A total number of 4 geoelectric cross-sections were constructed, (Figures 6, 7, 8 and 9). These sections each VES. These models were used to construct a number of geoelectric cross sections along measuring indicated that the investigated interval reached about 150 m and was consist of five main geoelectric units reflecting different geologic layer, these units were represented in all cross section as follow:
The first unit: Comprises high resistivity values and thickness varies between 0.5 to 2.5 m. It consists of sands, gravel and loam and the high resistivity values reflect dry, friable sandy layer.
Second unit: It reflects lower resistivity values than the overlaying unit ranging between 2.2 and 22 Wm and thickness ranges between 3 and 15 m. It represents an extension of the above dry layer but with some shally intercalations. Calibration of the resistivity values of this layer with the borehole date indicated that this unit doesn’t contain groundwater along all sections.
Third unit: Comprises higher resistivity values ranges from 79 to 165 Wm and thickness ranges from 10 to 50 m. Calibration of resistivity data with lithologic information indicated that this unit is considered as hard, dry limestone layer.
Fourth unit: This unit is represented by lower resistivity values ranges from 1.4 to 17 Wm and great thickness. It is the base of the investigated interval at the site of VES's 1, 5, 6, 7, 9, and 12, while, at VES 4 it has a thickness of about 30 m only. The lower resistivity values of this unit reflect that it is a fractured, water bearing unit of limestone.
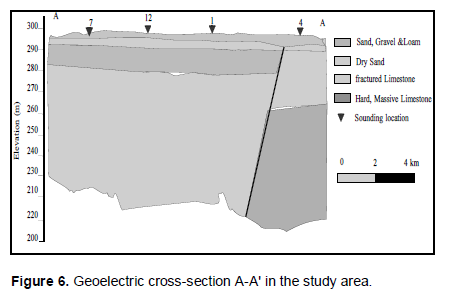
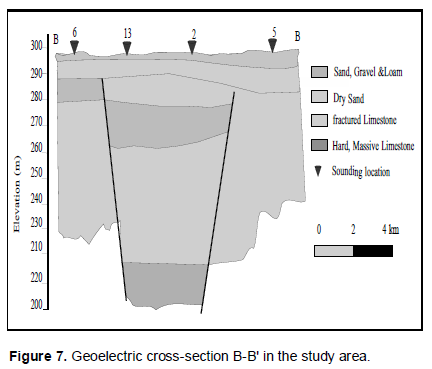
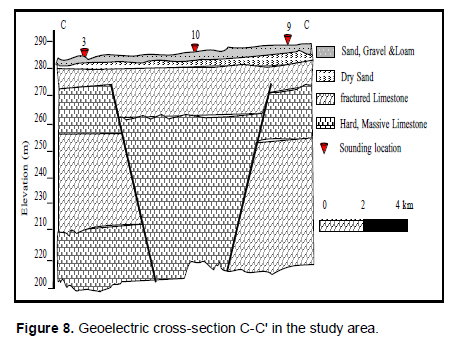
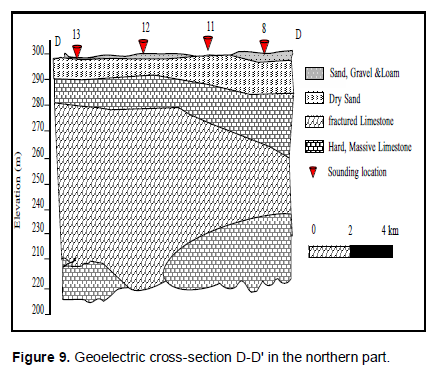
Fifth unit: This unit is considered the base of the investigated interval at the sites of VESs 2, 3, 4, 8, 10, 11 and 12 comprises very high resistivity values (600 Wm). This high resistivity value may be due to the absence of fractures, as confirmed from the calibration with lithologic information. Calibrating the VES data with the available lithological information and well represented from Wenner results at constant depths of 15 and 50 m indicated two fractured zones; the first is shallow at depth of about 15 m and extends in the northeastern and southwestern parts; the second is deep at depth of about 60 m extends in the central part of the area from east to west and considered the main aquifer in the area.
Iso- parametric maps
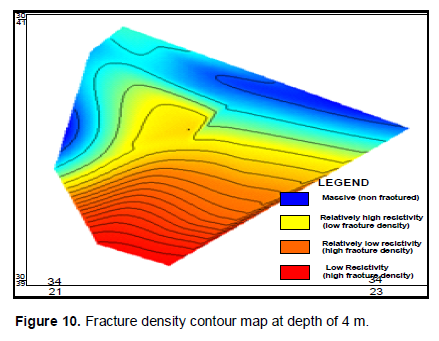
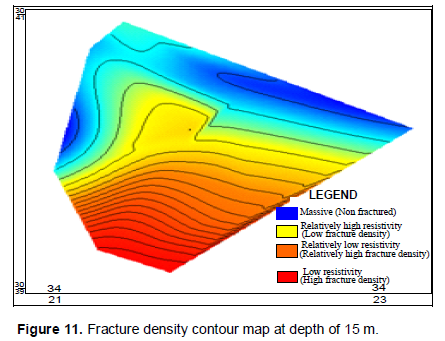
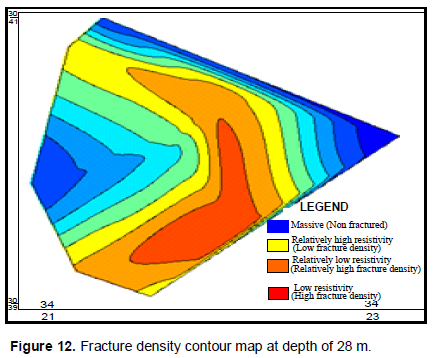
The iso-parametric maps are subsurface contour maps constructed on the available geologic information that can be deduced from the geoelectric cross-sections, boreholes and hydrogeologic data. The purpose of such maps is their use in deduction of the extension and density of fractures at the interested location. The maps are constructed based on the measured apparent resistivity and mainly show the lateral changes of resistivity at different depths. Here, where the purpose of this study is to delineate the direction and density of fractures, these maps were constructed according to the results of calibration of true resistivity data and the intensity of fractures at definite areas where it was exposed
Fracture density contour map at depth 4 m
This map is constructed to show the direction of fractures along the area at depth of about 4 m. It indicates that the intensity of fractures increases from the southeast to the northwest with some discontinuities at the middle of the area. This discontinuity may be due to structures (faults). To the south of the area, the intensity of fractures decreases to less than 3 fractures per each square meter (Figure 10).
Fracture density contour map at depth 15 m
This map reflects the density of fractures at depth 8 m. It indicates that the fracture density increases in the northern half of the area and decreases in the southern half. Generally, there is a gradual increasing in fractures from south to north at this depth. Comparison of this map with the previous one, it was clearly noticed that in the northwestern part, the fractures continue downwards with the same density while in the northeastern part, the density increased. This was clearly confirmed by the resistivity results (Figure 11).
Fracture density contour map at depth 28 m
At the depth of about 28 m, this map reflects different distribution of fractures where the western and eastern edges of the area is still comprising high fracture density , while there is an elongated zone of low density in the central part of the area. This may be due to the effect of the main fault passing through this part of the area as indicated from the geologic map of central Sinai (Figure 12).
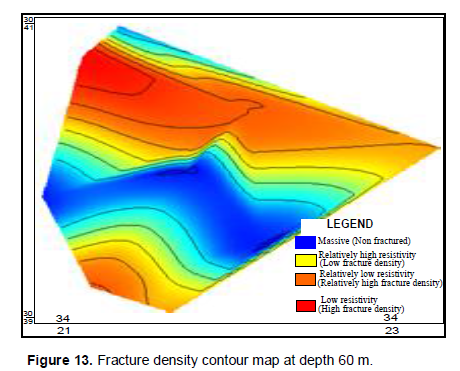
Fracture density contour map at depth of 60 m
The map in Figure 13 shows the fracture density distribution at depth of about 60 m where the main groundwater aquifer in the study area is present and most of the productive wells are existed. It represents a wide area of high fracture intensity at the middle of the area from east to west.
Hydrogeological conditions
Aquifer potentiometry
We can classify the water levels according to the condition of its occurrence into natural flowing and unconfined condition. Two natural springs occur within el Qusiema area. Which are located at the upstream portion of Wadi El Gudeirate and Wadi El-Gaifi. These Wadies insisted their channels in the elevated plateau which represents a huge watershed area. These two springs are developed where a Wadi incised the limestone aquifer to the boundary level between limestone and the underlying Paleocene Esna shale. Under these circumstances the groundwater appears as a natural spring. The unconfined aquifer was found to be different; therefore it is difficult to construct a general potentiometeric surface map. The depth to water varies from 14 to 23 m below ground level. In general the potentiometric surface is in the North West direction.
Hydraulic parameters
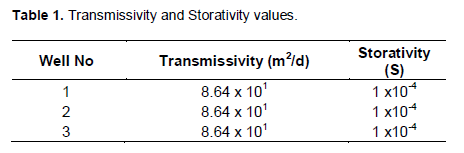
The area of study is characterized by the presence of carbonate aquifer especially limestone which is fissured and cracked, so it is so difficult to determine the hydraulic parameters by normal pumping test analyses, consequently, the analyses give approximate values of the hydraulic parameters of the aquifer. By using Jacob method, the Transmissivity (T) was found to be 19.876 m2/d for well No.1, 172.8 m2/d for well No.2, and 8 m2/d for well No.3 (WRRI and JAICA, 1990). By application of aquifer test v 4.2 software on the three cased wells at the area of study, the Transmissivity and Storativity values were found to be as shown in Table 1. From Table 1 it was found that the Transmissivity and Storativity values were found as the same in the three studied wells due to their occurrence at the same area with the same sedimentary environments and conditions. From the above discussion, it can be concluded that the density of fractures that control groundwater occurrence in carbonate rocks can be delineated through geophysical technique when calibration with real lithologic information is available. Also, verification between the fractured and massive limestone was clearly obtained from the true resistivity.
(1) The general trend of increasing fracture density differs with depth where at shallow depth it increases toward the north and northwest, while at deeper zone the general trend is from north and south to the central part.
(2) As a result of discontinuities downwards in some parts, it is expected to find two different types of water due to different recharge conditions.
CONFLICT OF INTEREST
The authors have not declared any conflict of interests.
REFERENCES
|
|
|
|
Das UC, Kumar R (1979). Transformation of Wenner to Schlumberger apparent resistivity over layered earth by the application of a digital linear filter. J. Can. Soc. Explor. Geophys. (CSEG) 15(1):49-53).
|
|
|
|
|
|
Dobrin MB (1976). Introduction to geophysical prospecting. M.Sc. Graw Hill Book Co. New York.
|
|
|
|
|
|
Egyptian Geological Survey and Mining Authority (EGSMA) (1993). Geologic Map Sinai, Egypt (Scale 1:100 000).
|
|
|
|
|
|
|
|
|
|
|
|
Geological Survey of Egypt (1993). Geological map of Sinai Peninsula, sheet no.5, scale 1:500,000
|
|
|
|
|
|
Geophsica (1963). Final report on investigation of water and soil Resources in North and central part of Sinai Peninsula, submitted to General Development Organization, Cairo, Egypt
|
|
|
|
|
|
Hume WF (1962). Geology of Egypt. Geol. Surv. Egypt. 3(1):712.
|
|
|
|
|
|
Interpex L (1996). RESIX-PLUS, Resistivity data interpretation software, Golden, Clorado USA.2:39.
|
|
|
|
|
|
Issawi B, El Hinnawy M El Khawaga L, Labib S, Anani N (1994). The delineation of Sinai Water Basins by using Lithofacies isopach and structure contour maps. Second International Conference of Arab World, Cairo University, Egypt p. 489.
|
|
|
|
|
|
Koefoed O (1979). Geosounding principles, 1-resistivity sounding measurement. Oxford, p. 276.
|
|
|
|
|
|
|
|
|
|
|
|
Research Institute For Water Resources (WRRI) and JICA (1990). North Sinai Groundwater Recourses, Interim Report, Internal Report, El-Kanater El-Khyria, WRC, Egypt. July 1990.
|
|
|
|
|
|
Research Institute For Water Resources (2006). Water Supply for Bedouin Settlement From village to El-Arish, North Sinai, Final Report., June 2006. Internal report EL-Kanater EL-Khyria, WRC, Egypt.
|
|
|
|
|
|
Said R (1962). The geology of Egypt, Elsevier Publ. Co., Amsterdam, New York.
|
|
|
|
|
|
|
|
|
|
|
|
Zohdy AR, Eaton GP, Mabey DR (1974) Application of surface geophysics to groundwater investigations. USGS techniques of water-resources investigations. Book 2 Chap. D1, 116 pp.
|
|
Copyright © 2024 Author(s) retain the copyright of this article.
This article is published under the terms of the Creative Commons Attribution License 4.0


