ABSTRACT
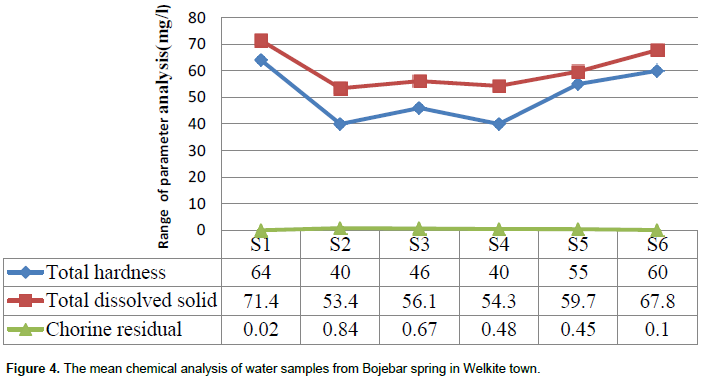
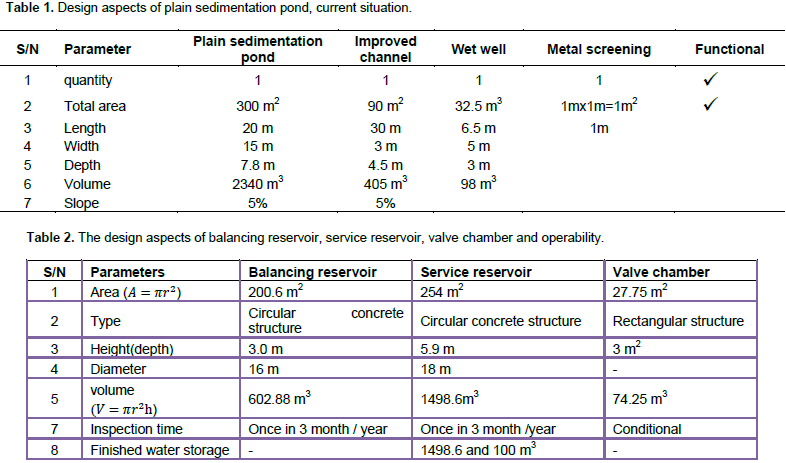
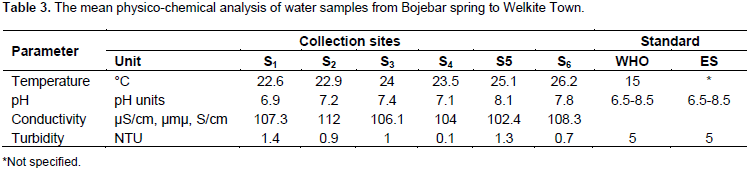
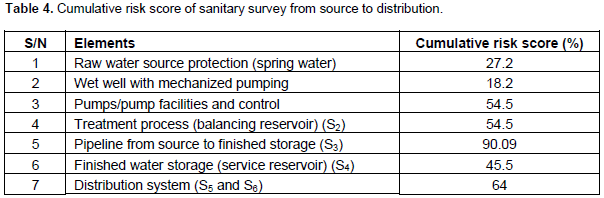
Water supply systems provide consumers with drinking water that is adequately free of microbial pathogens to prevent waterborne diseases. The key to produce water of such desired quality is to implement multiple barriers, which control microbiological pathogens and chemical contaminants that may enter the water supply system. The objective of this study was to evaluate bacteriological and physicochemical quality of water supply system in Welkite Town, southwest Ethiopia. The water samples were examined on site for total coliform and thermo tolerant coliform using membrane filtration method. Raw water samples were positive for total coliform and thermo tolerant coliform, and there was high bacteriological load in Bojebar spring source which is total coliform: 16 cfu/100 ml, thermo tolerant coliform: 8 cfu/100 ml and in balancing reservoir, there was no detection for both total coliform and thermo tolerant coliform, whereas total coliform and thermo tolerant coliform were detected in the pipeline (counted as 6 and 1 cfu/100 ml, respectively). Similarly, in the service reservoir, the result indicated 9 and 1 cfu/100 ml for both total coliforms and thermo tolerant coliforms, respectively. On the other hand, temperature at all sampling sites was above the permissible limit set by World Health Organization but pH, electrical conductivity, turbidity, total hardness and total dissolved solids were all within the permissible limit set by World Health Organization. The free chlorine residual was 0.02, 0.84, 0.67, 0.48, 0.45 and 0.1 mg/l at six different sampling points, respectively, while the sanitary survey showed that cumulative risk score of all water supply systems was 27.2, 54.5, 90.09, 45.5 and 64% from the source to distribution, respectively.
Key words: Bacteriological parameters, sanitary survey, total coliform, thermo tolerant coliform.
Water is the most abundant chemical in the human body and plays a central role in the regulation of nutrient transport, toxic waste removal, thermal regulation and digestion, organ functioning and metabolic activities. However, if water is fecally polluted it spreads diseases in consumers to a great number of people (Alhassan and Kwakwa, 2014). The quality of drinking water is very essential for public health and primary concern of people living in developing countries is obtaining clean drinking water. Pollutants in drinking water threaten survival of the human species. Expanding urbanization, industrial operations and agricultural production have resulted in complex inter-relationships between socioeconomic factors and natural hydrological and ecological conditions. The availability of safe drinking water is thus becoming an ongoing challenge (Alhassan and Kwakwa, 2014; Diduch et al., 2013). The quality of drinking water may be controlled through a combination of protection of water sources, control of treatment processes and management of the distribution and handling of the water (Diduch et al., 2013).
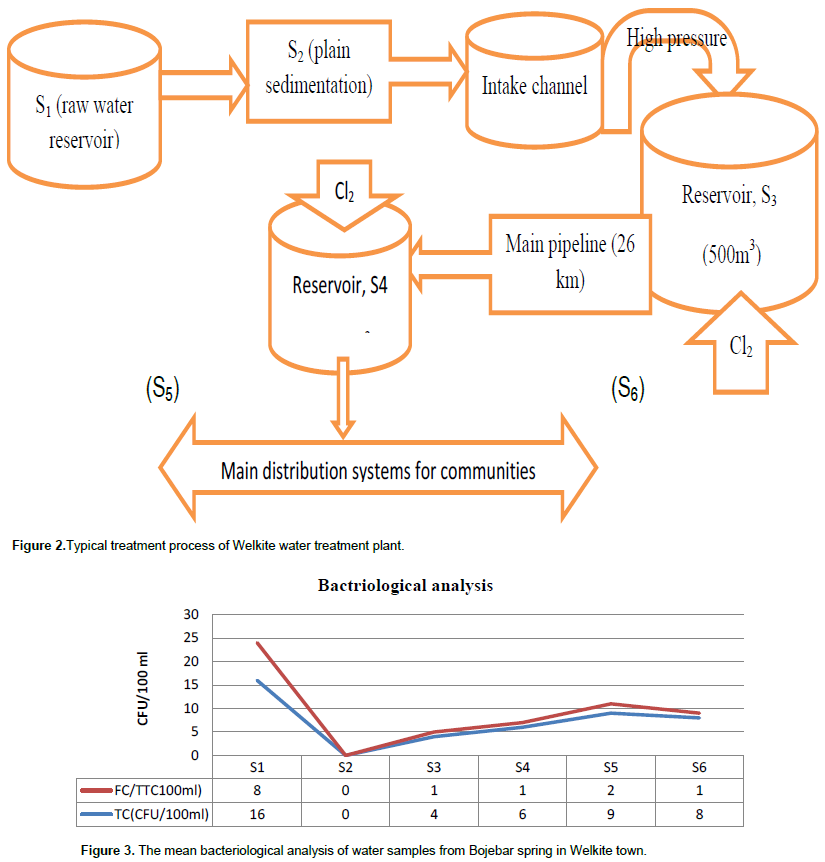
Standard drinking water treatment includes coagulation/flocculation, sedimentation, filtration and disinfection. Groundwater is the major source of drinking water in Ethiopia. More than 80% of the country’s drinking water supply source is from ground water (Nakade, 2013). The water supply system of Welkite town was established in 1989 when a borehole was drilled in the town and connected to a 30 m3 elevated steel tanks. However, the present daily water yield of Welkite town from the spring source (Bojebar) is estimated to be 150 L/s in dry season and it reaches 200 L/s in wet season .The Welkite water supply treatment plant, which is the major tap water supplier in Welkite town and the neighboring Woreda, provides the current production 3801.6 m3/day in 18 h pumping. The drinking water supply system serves about 54,946 for Welkite town and the rural areas.
The current water supply system in Welkite town comprises the following major components: Bojebar spring source, rising and gravity mains, pump sand electro-mechanical equipment, treatment facilities, service reservoirs, distribution network to newly developed and future expansion areas, operation buildings at intake, pump station, guard house and fences (Solomon, 2011). This study provides baseline information on the quality and quantity of drinking water of Welkite town and provides a framework to sanitary situation for the water supply system, major operational or treatment problems that may enhance the possible contamination (Verma et al., 2012). Besides, it provides relationships between physicochemical parameters like temperature, pH, free residual chlorine and turbidity and with bacteriological parameters such as total coliform and thermo tolerant coliform/fecal coliform on the treatment plants (Rao et al., 2012). In addition, the study findings have provided information on the differences between treated and non-treated water in Welkite.
Description of the study area
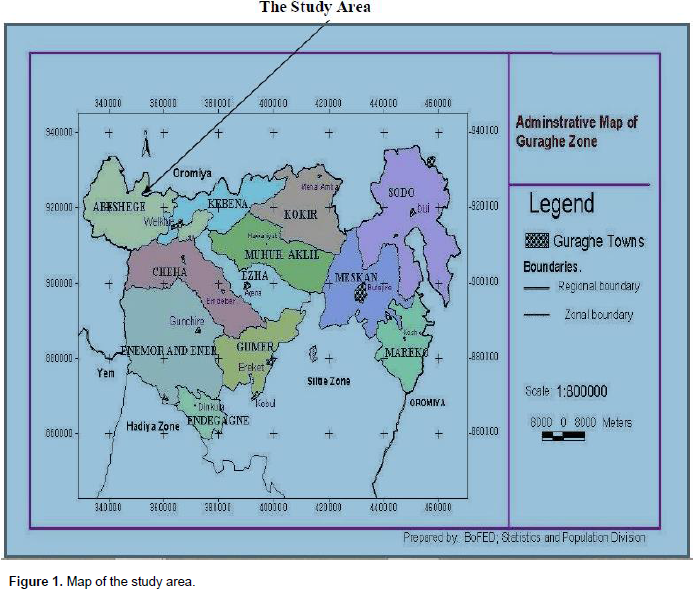
The Welkite Town is located at 8° 16' 50’’N and 37° 46' 40’’E and it is 157 km from Addis Ababa, capital city of Ethiopia (Figure 1). The water supply coverage of the town is 40% and it has surface area of 72 km2, elevation of 1820 to 1900 m.a.s.l which receives mean annual rainfall of 1310 mm/year (Southern Nations Nationality Peoples Region, 2008).
Sampling point location and selection
Cross-sectional laboratory based study was conducted to determine the bacteriological, physical, and chemical quality of drinking water at spring sources, disinfection in the balancing reservoir, pipeline and main distribution systems, examining deficiency of treatment units, using a standard sanitary survey work sheet; interview and observational (Rao et al., 2012; Muazu et al., 2012) checklists (Figures 2 to 4). In addition, these six representative sampling sites were selected based on the rate of human interference, pipeline leakage, improper installation and agricultural activities that have been taking place along the water supply system.


Sampling methods
A triplicate of grab sampling method was conducted in which a single volume of water sample was taken once from a single point. As a result, using aseptic techniques, water samples were collected directly from the spring and five different sampling points along the flow path of the spring using 100 ml sterile polyethylene plastic bottles. The number of water samples taken were as follows: three samples from weir fenced springs water source; three samples from balancing reservoir after travelling 1.5 km; three samples from main pipeline after travelling 13 km; three samples from service reservoir and three water samples from each main distribution (Table 2). An in situ water quality testing kit was used to determine the microbiological quality of water. This test kit enabled water quality to be tested in line with the World Health Organization standards and Ethiopian drinking water standards.

The water sample bottles were rinsed three times with source water before collecting the sample and rinsed with 70% methanol to minimize the risk of external contamination (Muazu et al., 2012), then, the microbiological analysis was carried out in situ so that the microbiological parameters would not change with time. An in situ water quality testing kit ‘Hanna HI 93710 meter (Romania), HI 93703 Portable Microprocessor and turbidity meter were used to determine the physicochemical parameters of the water samples such as pH, turbidity, temperature, and electrical conductivity from the six selected sampling sites (Table 3). On the other hand, free residual chlorine, total dissolved solids and total hardness were analyzed and chemically preserved by adding 5 ml concentrated HNO3 per liter of the sample and distilled water to avoid contamination and transported to the Federal Environmental Protection Authority laboratory using ice box (Rao et al., 2012; Muazu et al., 2012; Timilshina et al., 2012).

Bacteriological analyses
The number of total coliform and thermo tolerant coliforms was determined using membrane filtration technique. As a result, the measured volume of water sample (100 ml) was filtered under vacuum, through a cellulose acetate membrane of uniform pore and diameter of 0.45 μm and 47 mm diameters, on an absorbent cloth with diameter of 47 mm, thickness of 0.8 mm, and was capable of absorbing 2.0 ± 0.2 ml Endo broths. Indicator bacteria were retained on the surface of the membrane which was placed on a suitable selective medium in a sterile container and incubated at an appropriate temperature immediately, for total and Thermo tolerant coliforms; it was placed at 37 and 44.5°C, respectively for 24 h while growing indicator bacteria into visible colonies and counted manually using triplicate test for consistency (Figure 3).
Physico-chemical analyses
The water sample temperature was taken on site using a thermometer calibrated in °C while turbidity was determined on site using portable microprocessor turbidity meter, HI 93703 (Hanna, Romania) pH was determined using HI 93710 meter (Hanna, Romania), and electrical conductivity was measured with a portable waterproof conductivity meter HI 9033 (Hanna, Romania) on site. On the other hand, determination of total hardness was carried out using titration methods by which EDTA was used as a , whereas total dissolved solids was carried out using gravimetric methods while free residual chlorine test has was conducted for all sites, which contain chlorinated samples. This test was done using a stable reagent in a powder form for analysis of free chlorine (Timilshina et al., 2012) (Table 3).
Sanitary survey
The on-site sanitary survey was conducted to evaluate facilities of pump stations and the treatment plant of balancing reservoir, pipeline, service reservoir and the main distribution systems. Seven checklists, each with eleven questions “yes” and “no” options for designated risks were developed to determine the sanitary risk (Timilshina et al., 2012; Tagoe et al., 2011) giving a score of one point for each “yes” answer (risk observed) and zero point for each “no” answer (no risk observed). As a result, summing all “yes” scores, a final risk score was obtained, which provided the overall assessment of the risk profile of each site. The cumulative risk score was graded as very high (81 to 100%), high (51 to 80%), medium (31 to 50%) and low (1 to 30%). In order to insure the data quality and consistency, the sanitary survey checklist was pre tested (Figure 2 and Table 4).
Preliminary treatment units
The purpose of preliminary treatment is to ensure a satisfactory quality of final effluent and final sludge production and to protect the treatment process. As a result of the investigation, the floating materials were observed and created problem for the downstream treatment process. The plain sedimentation spring pond has area of 300 m2 and depth of 7.8 m which made it very difficult to avoid the long-standing sludge accumulation because of lack of temporary diversion ditch in the area for clearance (Tagoe et al., 2011). Consequently, the high accumulation of sludge in the pond led to deterioration in water supplies in terms of quality as well as quantity for consumers. Improved channel was constructed 30 m downstream from the pond, which allows the spring water flow to the proposed temporary well structure of 98 m3. The total capacity of the channel is 405 m3, but it allows (150 to 160 L/s) raw water flow through the channel (Table 1).
Chlorination of balancing reservoirs
The balancing reservoir is made of concrete circular structure with a capacity of 500 m3; area of 113 m2, height of 3 m and a diameter of 12 m. It has been provided with inlet and out let pipes, overflow pipe and vent pipes in which inlet, outlet and drainpipes have been provided with valves and has been fenced. As a result, it is not suitable for disinfection purpose as it does not allow sufficient time for the water to combine with the added chlorine and has short residence time since the incoming water leave immediately to the pipe line and to the distribution line. To this effect, a granular calciumhypochlorite (CaOCl)2 containing 65 to 70% active chlorine was used to disinfect raw water at the balancing reservoir. Two calcium hypochlorite preparation tanks of 500 L, mixing motor, and gravity dozer was installed on the top of the 500 m3 of balancing reservoir and 1 kg/500 L/d calcium hypochlorite was used. However, dosing of the dry granules or powder is not recommended since calcium hypochlorite is hygroscopic and decomposes in air to form chlorine gas. As a result, the current amount of chlorine dosed for disinfection in the balancing reservoirs is 1 kg/500 L/day or 1.33 mg/L which is within the range of USEPA standard of 0.5 to 5 mg/l (Sohani and Iqbal, 2012).
Design capacity of Welkite treatment plant
The capacity of the plant surveyed during the investigation was 3801.6 m3/day and 136,876 m3/year. According to the design capacity of Welkite treatment plant, nowadays, it treats only 29.3% of its design capacity; however, the current yield of raw water ranges from 12,960m3/d to 13,824 m3/day and 4,665,600 to 4,976,640 m3/year which is not sufficient for the existing population of 54,946 in the town of Welkite.
Spring water reservoir
The microbiological water quality results have shown that the total coliforms and thermo tolerant coliforms were found to be 16 and 8 cfu/100 ml from the spring water reservoir. This was because the water source is unprotected from small animals like amphibian, fish and larger animal like monkey and birds, which interfere with spring water reservoir. This result compared favorably with the report of Sohani and Iqbal (2012) which indicates that the presence of bushes and shrubs make smaller mammals to come around these water bodies to drink water; thereby, passing out faeces into the water. Therefore, the average count of total coliforms and thermo tolerant coliforms in the source water were above the recommended value. On the other hand, highest values of turbidity (1.4 NTU), total dissolved solids (52.7 to 75.3 mg/l) and free-residual chlorine were observed in this reservoir which is within the recommended limits.
Balancing reservoir
The mean total coliform and thermo tolerant values were zero which are within the acceptable limit (Farkas et al., 2012) and the cumulative risk score of disinfection point was 54.5% which is in the range of 51 to 80% of high cumulative risk score. The turbidity measured at this reservoir was 0.9 NTU which is less than 5 NTU; however, the higher concentration of free residual chlorine in balancing reservoirs was attributed to the application of chlorine in the form of dissolved calcium hypochlorite.
Pipeline
In terms of total coliform and thermo tolerant coliform, the mean results in pipeline were found to be 4 and 1 cfu/100 ml, respectively, due to the leakage of old pipeline, installation of pipeline along the road sides and passing the high trafficking bridge. With the overall risk-to-health matrix at the pipeline, the cumulative risk score was found to be 90.9% which showed very high cumulative risk score and the free residual chlorine which was 0.67 mg/l and was above acceptable limits.
Service reservoir
In service reservoir, the mean values of total coliforms and thermo tolerant coliforms were found to be 6 and 1 cfu/100 ml due to recontamination in its way while travelling 26 km from the disinfection point, leakage from pipeline, and the reduction of residual chlorine due to reaction with other substances along the path and counts in the range of 1.01 to 9.99 cfu/100 ml which brought low risk of infection; however, the average count were beyond the recommended values. Therefore, combined analysis of the sanitary survey and water-quality data showed that there were 45.5% of cumulative risk score recorded due to the presence of hazardous substances and sanitation condition of storage tanks.
Main distribution systems
The distribution system is the final barrier in preventing waterborne disease outbreaks on one hand and may contribute to water quality deterioration on the other. In terms of total coliform and thermo tolerant coliforms, the mean result were found to be 9 and 2 cfu/100 ml; however, the cumulative risk score of the distribution systems scored 64% which falls in the range of high cumulative risks score but indicated a large reduction in the concentration of free chlorine residual as the water is far from disinfection points.
It can be recommended that the proper sanitary survey, design and implementation of water and sanitation projects; regular disinfections, maintenances and supervisions of water sources and regular bacteriological assessment of all water sources for drinking should be planned and conducted. The capacity of the plant surveyed during the investigation was 3801.6 m3/day and 1368576 m3/year. However, the maximum daily flow of treated water is 1600 m3/day. There is a need to regulate the pipeline and distribution systems from vulnerability of mechanical damage since it is installed by roadside and on the side of the high trafficking bridge. So, there is need for immediate change of installation of pipeline possibly away from the bridge and the nearby road for sustainable protection of the distribution system.
The authors have not declared any conflict of interests.
The authors gratefully acknowledge the constructive comments and suggestions of the anonymous reviewers.
REFERENCES
|
Alhassan H, Kwakwa PA (2014). When water is scarce: the perception of water quality and effects on the vulnerable. J. Water Sanitation Hyg. Dev. 4:43-50.
Crossref
|
|
|
|
Diduch M, Polkowska Z, Namieśnik J (2013). Factors affecting the quality of bottled water. J. Expo. Sci. Environ. Epidemiol. 23:111-119.
Crossref
|
|
|
|
Farkas A, Drăgan-Bularda M, CiatarâÅŸ D, BocoÅŸ B, Å¢igan S (2012). Opportunistic pathogens and faecal indicators in drinking water associated biofilms in Cluj, Romania. J. Water Health 10:471-483.
Crossref
|
|
|
|
Muazu J, Mohammad Biu A, Mohammed GT (2012). Microbial Quality of Packaged Sachet Water marketed in Maiduguri Metropolis, North Eastern Nigeria. Br. J. Pharmacol. Toxicol. 3:33-38.
|
|
|
|
Nakade DB (2013). Assessment of bacteriological quality of water in Kolhapur city of Maharashtra, India. Int. Res. J. Environ. Sci. 2(2):63-65.
|
|
|
|
Rao VS, Prasanthi S, Shanmukha KJ, Prasad KR (2012). Physicochemical analysis of water samples of Nujendla area in Guntur District, Andhra Pradesh, India. Int. J. Chem. Technol. Res. 4(2):691-699.
|
|
|
|
Sohani S, Iqbal S (2012). Microbiological analysis of surface water in Indore, India. Res. J. Recent Sci. 1:323-325.
|
|
|
|
Solomon T (2011). Assessment of Selected Bacteriological and Physicochemical Characteristics of Sululta Town Drinking Water from Source to Pipe Water. (Doctoral dissertation, Addis Ababa University).
|
|
|
|
Southern Nations Nationality Peoples Region (2008). Survey of Southern Nations Nationality Peoples Region.
|
|
|
|
Tagoe DNA, Nyarko H, Arthur SA, Birikorang EA (2011). Study of Antibiotic Susceptibility Pattern of Bacterial Isolates in Sachet Drinking Water Sold in the Cape coast Met ropolis of Ghana. Res. J. Microbiol. 6:153-158.
Crossref
|
|
|
|
Timilshina M, Dahal I, Thapa B (2012). Microbial assessment of bottled drinking water of Kathmandu valley. Int. J. Infect. Microbiol. 1:84-86.
|
|
|
|
Verma PU, Chandawat DK, Gupta U, Solanki HA (2012). Water Quality Analysis of an Organically Polluted Lake by Investigating Different Physical and Chemical Parameters. Int. J. Res. Chem. Environ. 2(1):105-111.
|