ABSTRACT
A numerical model of variable-density groundwater flow and miscible salt transport is applied to investigate the extent of seawater intrusion in coastal aquifer of Ras El-Hekma, northwestern coast, Egypt. The SEAWAT 2000 code is used to solve the density-dependent groundwater flow and solute transport governing equations. Seventeen groundwater samples were collected in 2015 for routine chemical analysis and water level monitoring were carried out and interpreted. The model was calibrated using data measured for heads (m) and TDS (mg/L) in 2009 compared with data collected in 2015. Three scenarios of pumping and fourth scenarios of sea level rise by 0.5 m were applied. The results of three scenarios of pumping revealed that there was a general trend of drawdown in water table (~5 m) of observed wells located at about 1 to 1.5 km from the coast at the end of 20 years of simulation. At the same time there was replenishment from rainfall and surface runoff caused a water table rise in some observed wells that were located inland. For the proposed fourth scenario of sea level rise, the seawater/freshwater interface will migrate more inland (0.5 to 2 km) than its current position. The result of the numerical model shows a transgression of seawater inland and along the coast. The model and chemical results recommend a decrease in pumping to the drilled wells should not exceed 40 m3/day in order to avoid further seawater intrusion along the coast and upwelling of deep saline groundwater with continuous monitoring of the groundwater level and salinity measurements in north coast of Mediterranean Sea.
Key words: Seawater intrusion, groundwater modeling, SEAWAT code, Ras El-Hekma, Egypt.
Coastal areas are important for human settlement and development. It is estimated that more than half the world’s population lives within 60 km of the shoreline, and this number could increase up to three quarters over a decade (UNCED, 1992). Over exploitation of groundwater in coastal aquifers may result in intrusion of saltwater. Contamination of coastal aquifers may lead to serious consequences on environment, ecology and economy of that region. The saltwater intrusion in a coastal aquifer is a highly complex and nonlinear process. Management of coastal aquifers requires careful planning of withdrawal strategies for control and remediation of saltwater intrusion (Datta et al., 2009). Egypt has a relatively long coast line of about 950 km along the Mediterranean Sea, with Ras El-Hekma representing one of the main headlands along the southern Mediterranean coast subjected to several problems such as scarcity of rainfall and high pumping rates that degraded groundwater quality in the main water supply wells. Northwestern coast of Egypt was subjected to several studies that focused on water resources. Youssief and Bubenzer (2013) studied groundwater at Ras El-Hekma area and clarified the relationship between depth to water, sea level and salinity of water. Morad et al. (2014) assessed the hydrologic factors controlling groundwater salinity in the coastal area between El-Dabaa and Sidi Barani, Egypt, and demonstrated that the aquifers in the area are recharged by seasonal rainfall of the order of 150 mm/year and the ability to be recharged is a measure of the vertical permeability due to lithological and structural factors that control groundwater salinity in the investigated aquifers. Soliman et al. (2013) mapping of seawater/freshwater interface at Ras El-Hekma city by 2-D resistivity imaging and transient electromagnetic soundings, concluded that the upper aquifer represented by Oolitic limestone of Pleistocene age and the lower aquifer represented by Middle Miocene age were affected by seawater, but the lower one showed larger effect than the upper one. The freshwater/saltwater interface could be delineated at a depth of 20 to 30 m below the ground surface according to the ground surface elevation. To numerically simulate seawater intrusion, a density-dependent groundwater flow simulation model is required to track the movement and change the transition zone between fresh water and salt water. The last decade has seen the appearance of several density-dependent simulation codes that are based on the commonly used groundwater model, MODFLOW, developed by the U.S. Geological Survey (McDonald and Harbaugh, 1998; Harbaugh et al., 2000). These codes include SEAWAT (Guo and Bennett, 1998a, b; Guo and Langevin, 2002; Langevin et al., 2003).
The objective of the study is to apply numerical model to investigate seawater intrusion in Ras El-Hekma coastal aquifer based on SEAWAT 2000 which is a quasi-three-dimensional variable-density numerical model, where after the model calibration by using the observation data in August 2009 (Youssief and Bubenzer, 2013), the calibrated model will be used to predict the extent of seawater intrusion for the next 20 years taking into consideration groundwater samples collected in 2015.
Study area description
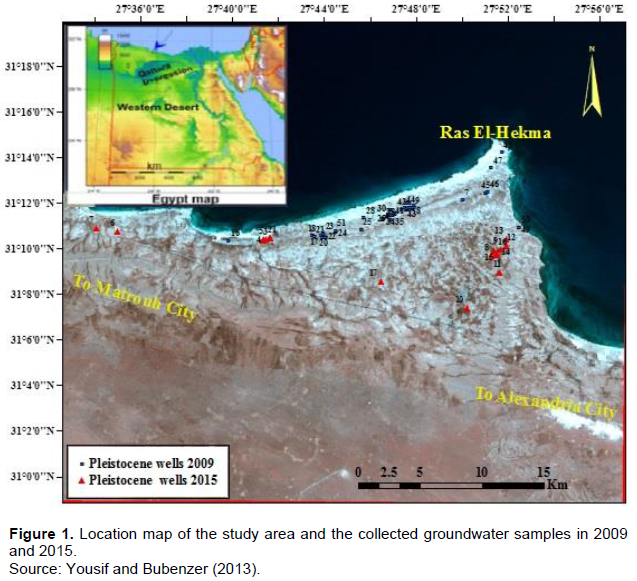
Ras El Hekma, a prominent cape of the Egyptian northwestern Mediterranean coast, is situated about 200 km to the west of Alexandria and covers about 230 km2 (Figure 1). Whereas the coast eastward and westward of Ras El Hekma is heavily overbuilt for touristic reasons, the cape is relatively sparsely built and shows a more traditional land use. The climate of the study area is characterized by southern Mediterranean conditions (Harding et al., 2009) with rainy mild winters and a warm, dry summer, while spring and autumn are comparably short. During spring, some storms occur and during autumn, occasional sudden heavy rainfalls are possible. Climatic data from 1945 to 1992 (Ali et al., 2007) for Matrouh station (70 km to the west) shows a mean monthly minimum temperature of 8°C in January and a maximum of 29.8°C in August. The average annual precipitation is 155 mm, but with a relatively high variation coefï¬cient of 0.42. The annual evaporation rate is 1578 mm. However, due to the fact that rainfall normally occurs only between October and February, rainwater harvesting for agricultural and pastoral uses is possible with surface water considered as the main source for recharge of the groundwater.
Geomorphology, geology and hydrogeological settings
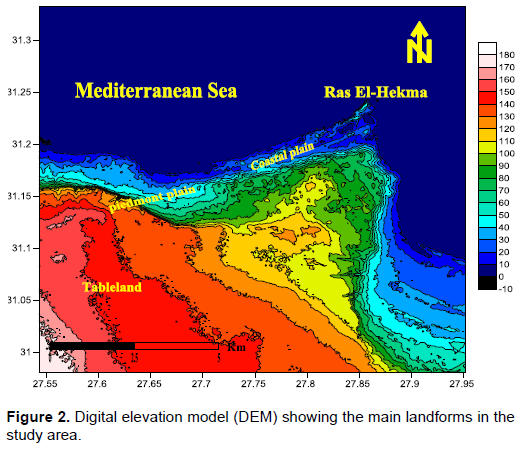
Geomorphological aspect illustrate that two main topographic features are predominant in the study area; the tableland in the south and the coastal plain in the north (Figure 2). In Ras El Hekma, the following landscape units are distinguishable from south to north (Yousif and Bubenzer, 2011): (a) the tableland; (b) The piedmont plain and; (c) The coastal plain.
Geological aspect based on geological map (CONOCO, 1986) and the Landsat images show that the following stratigraphic units can be distinguished from young to old (Yousif and Bubenzer, 2011): (a) Holocene deposits are known along the present beach. The sand near the beach is highly polished and contains small quantities of ï¬ne clayey and/or calcareous particles, while inland the sand contains a high amount of these ï¬ne materials. (b) Pleistocene sediments are also widely distributed in the study area and are mainly represented by Oolitic limestone, which constitutes the main bulk of the Pleistocene sediments covering the greater part of the coastal zone and are almost developed in the form of elongated ridges running parallel to the present coast. (c) Tertiary deposits are exposed in the southern parts of the study area (the tableland); these deposits are represented by Pliocene sediments which have limited exposures and Miocene sediments represented by the Marmarica limestone formation. The Marmarica formation is built up of ï¬ssured and cavernous limestone, dolomitic limestone, and sandy limestone intercalated with clay and marl interbeds.
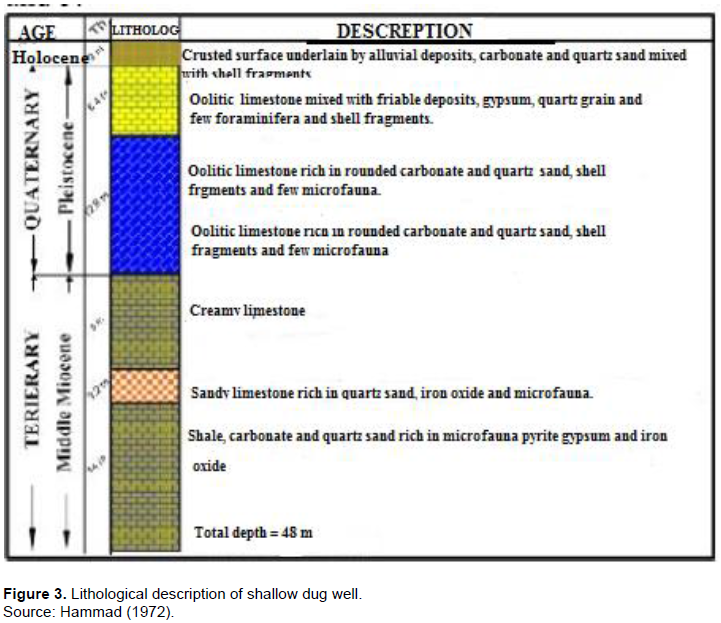
Hydrogeologically, the area of study is characterized by an aquifer system belonging to the Quaternary (Holocene and Pleistocene) and the Tertiary (Miocene) as illustrated in Figure 3. Holocene aquifer (alluvium aquifer) forms a limited groundwater aquifer (Sewidan, 1978) and occupies the main trunk and deltas of some drainage basins. Here, precipitation forms the main sources of recharge. Pleistocene aquifer (Oolitic limestone aquifer) is composed of Oolitic limestone interbedded with sandstone and clay which is considered to be the most important aquifer dominating the whole coastal strip. The Oolitic limestone aquifer extends southward from the coastal line to about 4 km. Groundwater generally flows from south to north following the general slope. Groundwater salinity ranges from brackish to high saline water according to rainfall quantity, over pumping and sea/salt water intrusion. Tertiary aquifer (Fissured limestone aquifer) is composed of limestone with little clay intercalations. Groundwater occurs in two forms; shallow groundwater (Perched groundwater) and deep groundwater. Rain water forms the main recharging source of this aquifer. Deep groundwater is formed when rainwater is accumulated in the fractures, fissures solution plains of the limestone rock. This aquifer is a generally low potential aquifer with salinity ranging from fairly fresh to hyper saline water.
For hydrochemical evaluation, about 17 groundwater samples were selected from shallow aquifer of the studied area. The samples were collected in 1 L narrow-mouth pre-washed polyethylene bottles. Electrical conductivity (EC), temperature and pH values were measured in the field using a portable conductivity and pH meters. In the laboratory, the water samples were filtered through 0.45 µm to separate suspended particles. Acidification (pHË‚2) with concentrated nitric acid was performed on the filtered samples for heavy metals analysis using ICP (inductively coupled plasma) at the central laboratory of Desert Research Centre. The acid titration method was used to determine the concentration of bicarbonate HCO3- (APHA, 1995). Major anions (Cl-, SO4 2-) and major cations (Ca, Mg, Na, K) were analyzed using ion chromatography (Dionex DX-600). All reported values have an ionic balance within 5%.
In addition to a three-dimensional variable-density, transient groundwater flow model was developed to assess salt water intrusion phenomena in shallow aquifer of Ras El-Hekma area. The flow model was constructed using SEAWAT-2000 (Langevin et al., 2003), a computer program that combines a modiï¬ed version of MODFLOW-2000 (Harbaugh et al., 2000) with MT3DMS (Zheng and Wang, 1998). While there are a variety of codes available that are suitable for this purpose, SEAWAT-2000 affords the flexibility of supporting several different boundary conditions and provides a choice of numerical methods for solving the transport equation. SEAWAT-2000 has accurately reproduced the solutions to several benchmark problems commonly applied in literature (Guo and Langevin, 2002). The SEAWAT program solves the variable-density flow equation by formulating the matrix equations in terms of fluid mass and assuming that the fluid density is solely a linear function of solute concentration. The flow and transport equations were explicitly coupled using a one-time step lag and solved alternately until the maximum difference in fluid density was less than 10-6 kg/m3, which provided a mass-balance error less than 0.01%. The effect of variable fluid viscosity on flow was not considered in these simulations because the temperature range in this shallow aquifer system is small (Langevin and Guo, 2006) and showed that accounting for variable viscosity in their SEAWAT simulation of fluids with sharply contrasting densities in the salt-pool problem had a negligible effect on model results. An implicit ï¬nite difference (FD) method was selected to solve the advection equation and central-in-space weighting was speciï¬ed to minimize numerical dispersion.
Governing equations
Variable density groundwater flow is described by the following partial differential equation (Langevin et al., 2003) as presented in:

Where z is a coordinate direction aligned with gravity (L); ρ is fluid density (ML-3); Kf is the equivalent fresh water hydraulic conductivity (LT-1); hf is the equivalent fresh water head (L); ρf is the density of fresh water (ML-3); Sf is equivalent fresh water storage coefficient (L-1); t is time (T); n is porosity (L°); C is the concentration of the dissolved constituent that affects fluid density (ML-3); ρ is the fluid density of a source or a sink (ML-3); and q is the flow rate of the source or sink (T-1). To solve the variable density ground water flow equation, the solute-transport equation must also be solved because fluid density is a function of solute concentration, and concentration may change in response to the groundwater flow ï¬eld. For dissolved constituents that are conservative, such as those found in sea water, the solute transport equation is:
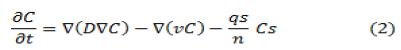
Where D is the dispersion coefï¬cient (L2T-1); ν is the groundwater flow velocity (LT-1); qs is the flux of a source or sink (T-1); and Cs is the concentration of the source or sink (ML-3).
Simulation code
To simulate variable density effects on groundwater flow, the coupled flow and transport code SEAWAT was used. Coupling flow and transport computations allow the effects of fluid density gradients associated with solute concentration gradients to be incorporated into groundwater flow simulations (that is, density dependent flow). It uses the ï¬nite difference method of numerical integration to solve 3-D conï¬ned and unconfined groundwater flow under many types of natural and artificial aquifer stresses. The original SEAWAT code was written by Guo and Bennett (1998a, b) to simulate groundwater flow and salt water intrusion in coastal environments. SEAWAT uses a modiï¬ed version of MODFLOW (McDonald and Harbaugh, 1998) to solve the variable density, groundwater flow Equation 1 and MT3D (Zheng, 1990) to solve the solute-transport (Equation 2).
Spatial and temporal discretization
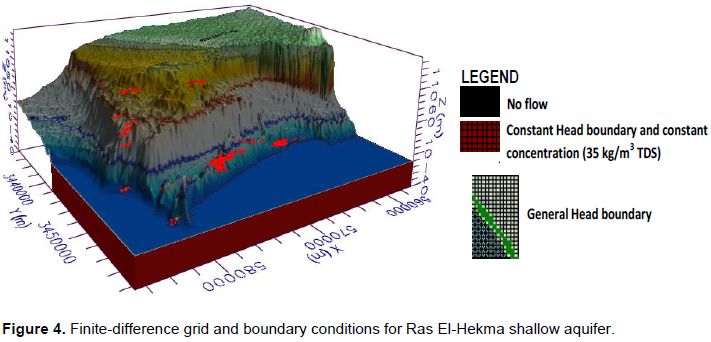
The model domain and finite difference grid used to simulate groundwater flow within Ras El-Hekma coastal aquifer is illustrated in Figure 4. The model encompasses an area of about 1516.5 km2. The grid consists of 200 rows and 200 columns with 40000 regular cells in plain view. Each cell is 0.1521 × 0.1521 km2 in the horizontal plane. Coastal unconfined Pleistocene aquifer was treated as a single layer with mean hydraulic conductivity that ranges between 20 to 60 m/day (Eissa et al., 2017). Longitudinal and lateral dispersivities were set equal to 10 and 1 m, respectively. The effective porosity was set equal to 35%. The northern boundary is saline seawater transport boundary (39.7 g/L) since the Pleistocene aquifer was in direct hydraulic contact with the Mediterranean Sea in which the water level is known (zero). At the western-southern boundary, the salinity is fixed (~5 g/L) and the groundwater level reached 6 m asl. The groundwater salinity during 2009 ranged between 1 to 8 g/L according to Yousif and Bubenzer (2013) and reached 10 g/L in this study above datum of the eastern and western sides, respectively. For the upper boundary, the water table was considered higher than the Mediterranean Sea water level. The concentration was constant and equal to the groundwater concentration. The bottom boundary was impermeable, that is, the normal flux through the bed for both fluid and salts was equal to zero. The input data required for the model include: well location and pumping rates, aquifer configuration, including top and bottom of the system, hydraulic conductivity of the system, amount of recharge and potentiometric head.
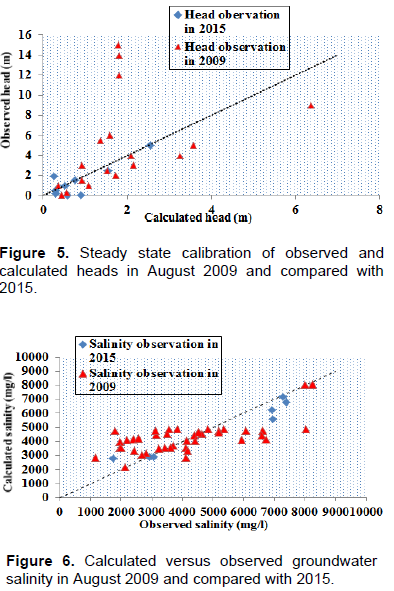
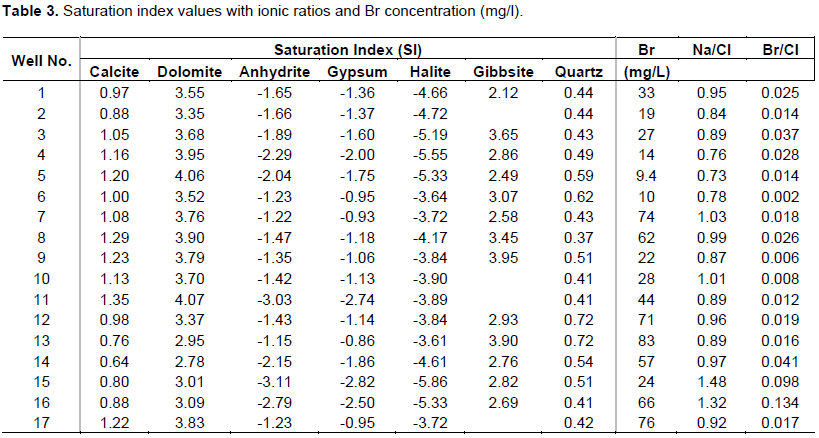
Calibration in steady state
Model calibration was achieved through trial and error by adjusting the values of recharge at the boundaries. The calibration in the steady state has been conducted versus potentiometric head data in August, 2009 and compared with data measured in 2015 to calibrate the spatially variable hydraulic conductivity and recharge, and hydraulic conductivity of the general head boundary. Calibration process produced an acceptable comparison between observed vs. calibrated heads (Figure 5) and concentration in (mg/L) (Figure 6).
Testing scenarios
Four proposed pumping scenarios were simulated based on the potentiality of the Oolitic limestone Pleistocene aquifer to examine the impact of seawater intrusion. The first scenario considered 40 m3/day as pumping rate (base case scenario) where (El-Raey, 1998) mentioned that underground water can also be found in the limestone layers below the Fuka Basin. They can produce water with an average quality at a rate of 20 m3/h. The second scenario considered the extra pumping rate of 80 m3/day. The third scenario considered an increase of number of pumping wells (2009 and 2015 with pumping rate of 40 m3/day). Also, El-Raey et al. (1999) stated that natural sea level rise along the northern Egyptian coast is about 0.4 and 5 mm/year; while IPCC (2007) predicted that the sea level rise will be between 0.15 and 0.9 m until the year 2100. This change is expected to exacerbate the already existing environmental problems. In particular, coastal areas all over the world are expected to suffer from the impacts of sea level rise, that is, from coastal erosion, subsidence, pollution, and land use changes, hence the fourth scenario considered a rise of sea level of 0.5 m.
Table 1 summarizes the results of hydrochemical parameters for the analyzed groundwater samples of Pleistocene aquifer with basic statistical parameters (N=17) from the study area. The comparison of the hydrochemical data with guidelines of standard water quality (WHO, 2011) shows that for Pleistocene aquifer, groundwater samples have pH values that vary from 8.10 to 9.20 with an average value of 8.59. In general, pH of water samples was slightly alkaline, compared with WHO (2011) standards; all samples fall within the recommended limit (6.5 to 8.5) for human consumption except 53% exceeding this limit. The EC values vary from 1209 to 17160 µScm-1, with a mean of 8924 µScm-1. EC values are above the permissible limits of WHO (2011) of 1500 µScm-1 in all groundwater samples except sample No. 15 (EC=1209 µScm-1). Total dissolved solids (TDS) varies from 723 to 10048 mg/L (average 5126 mg/L), classified as 18 and 47% classed as moderately saline and slightly saline groundwater samples, respectively, according to Konikow and Reilly (1999) and Rhoades et al. (1992), and 35% as highly saline groundwater samples. The cation chemistry is dominated by sodium followed by magnesium, calcium and potassium in all of the samples, and anion chemistry are dominated by chloride followed by sulfate and bicarbonate in about 76% of the samples.
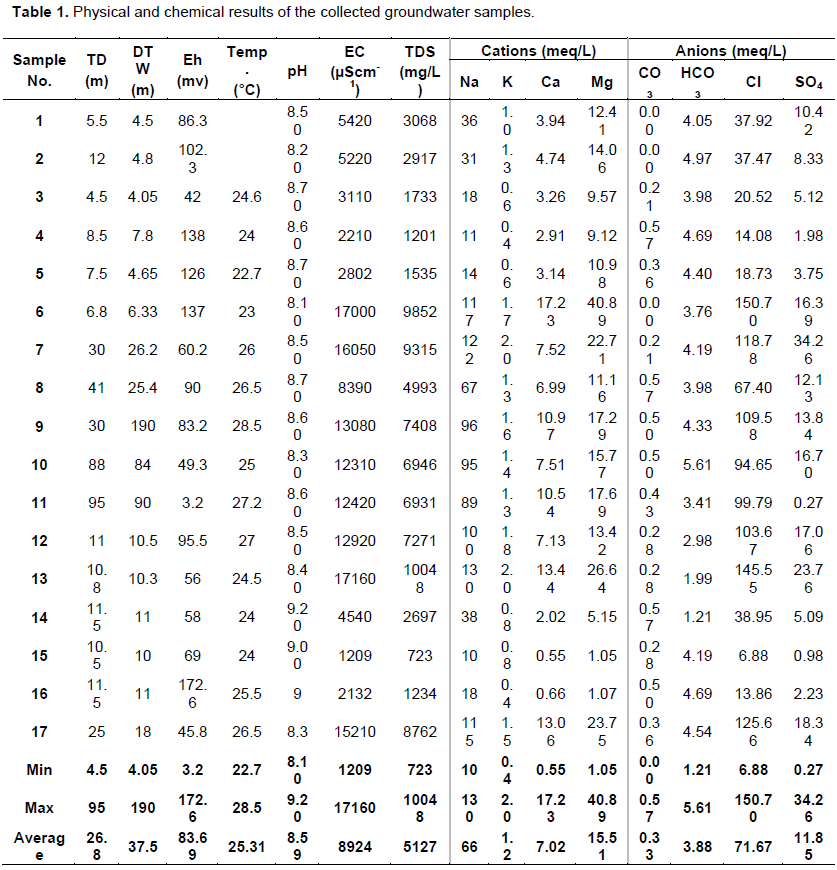
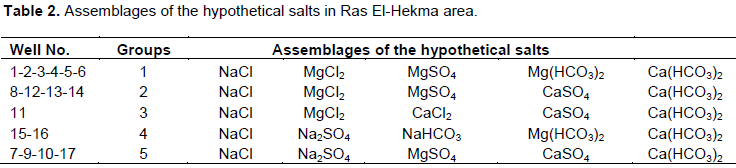
The hypothetical salts combination (Table 2) illustrate that for Pleistocene aquifer, increase in TDS in most of the groundwater samples is due to the increase in soluble salts (NaCl, Na2SO4 and MgCl2). The dominant ions show that all samples have water type Na-Cl. The presence of bicarbonate salts (Group 4) reflects the dilution effect of rainwater on the groundwater. On the other hand, some groundwater samples (Group 1) have a mixed source of mineralization, indicated from hypothetical salt containing MgCl2 (marine origin) and Mg(HCO3)2 salts.
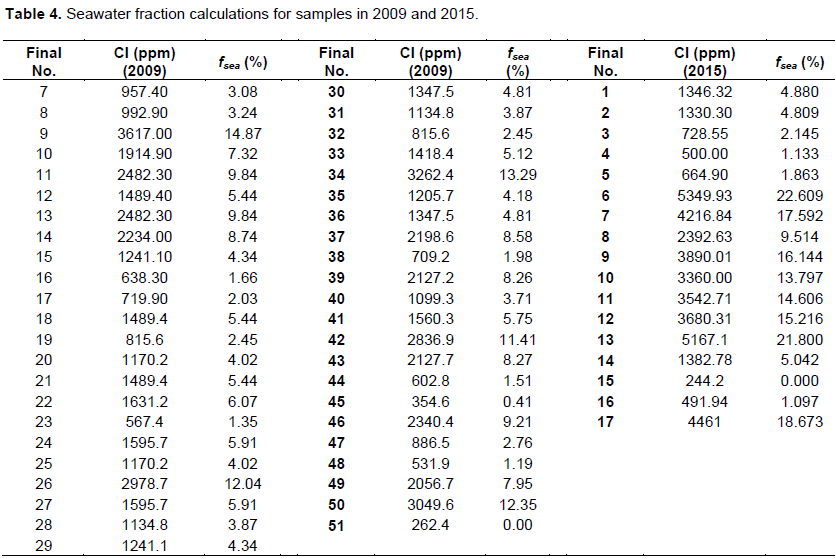
For elucidation of the mineral saturation indices which reflect water-rock interactions using PHREEQC program, positive values of mineral indices indicate supersaturation with these minerals, while negative values indicate under-saturation conditions and 0 values indicate saturation in equilibrium state. The obtained data in Table 3 reveal that for Pleistocene aquifer all the samples are supersaturated with carbonate minerals, which is represented by calcite CaCO3, dolomite CaMg(CO3)2 and other minerals such as Gibbsite Al(OH)3 and Quartz SiO2. However, all samples are undersaturated with gypsum CaSO4.2H2O, anhydrite CaSO4 and halite NaCl minerals.
Seawater mixing index (SWMI)
Statistical methods for chemical data were used in the coastal area to understand how geochemical processes influence groundwater quality. For quantitative estimation of the relative degree of seawater mixing with groundwater, a parameter called seawater mixing index (SWMI) is proposed based on the concentrations of four major ions (Na+, Cl-, Mg2+ and SO42-) as follows:
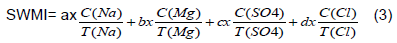
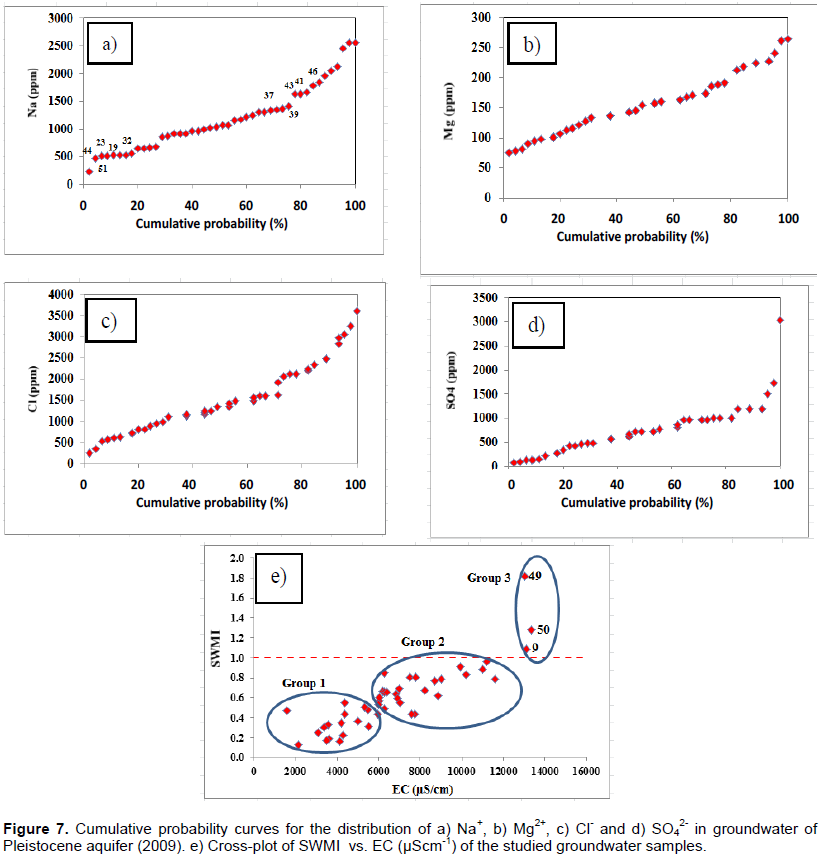
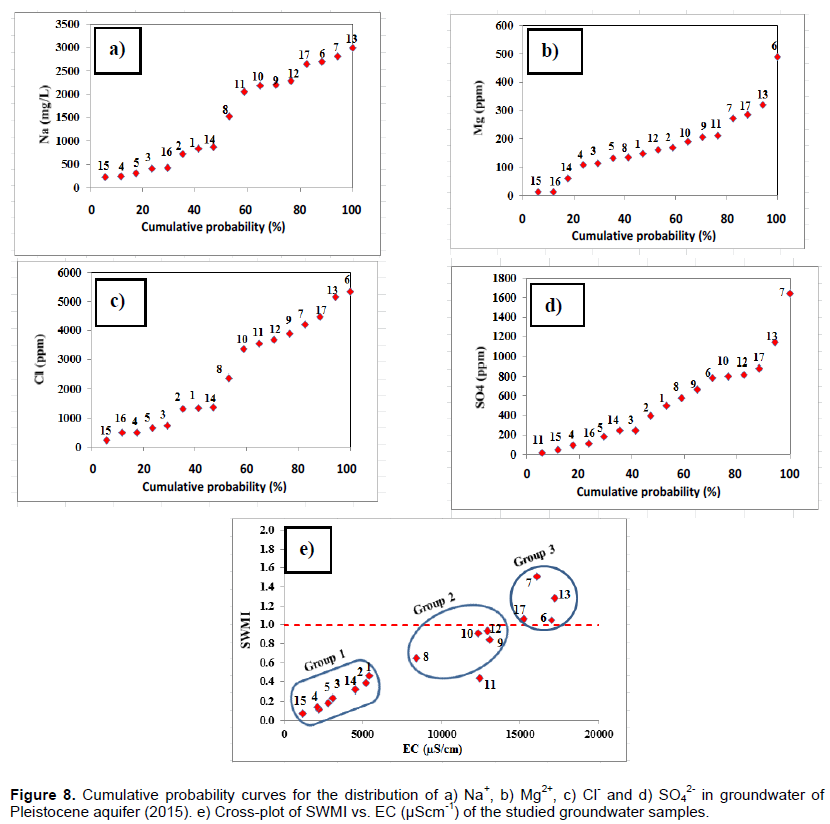
Park et al. (2005) estimated the constant factors a, b, c and d according to the relative proportions of Na+, Mg2+, Cl- and SO42- in seawater, respectively; Ti represents the calculated regional threshold values of selected ions, which can be estimated from the cumulative probability curves for each ion in a specific site; Ci is the measured ion concentration in mg/L. It was found according to SWMI calculations that, groundwater samples collected in 2009 are classified into three groups (Figure 7a-e). Group I (SWMI<0.5) have a moderately saline groundwater (TDS values range from 1175 to 3663 mg/L). Group II (0.64<SWMI<1) has highly saline groundwater (TDS values range from 4111 to 6728 mg/L), while Group III (SWMI>1) was affected by mixing with seawater (TDS values range from 8001 to 8254 mg/L). Groundwater samples collected in 2015 based on SWMI calculations are classified into three groups (Figure 8a-e). Group I (SWMI<0.5) with TDS values range from 722.8 to 3068 mg/L at sites 1, 2, 3, 4, 5, 14 and 15 affected by rainfall and Group II with TDS ranges from 4993 to 7408 mg/L at sites 8, 9, 10 and 12 which may be affected by overpumping and mineral dissolution and finally, Group III with TDS values which ranges from 8761.8 to 10048 mg/L at sites 6, 7, 13 and 17 and may be affected by mixing with seawater. As ionic ratios are commonly used to evaluate the salinization sources and origin of groundwater in coastal aquifers (Barbecot et al., 2000), Na/Cl ratio can discriminate brackish and saline water, where the values of this ratio are higher than unity in fresh and meteoric water while it is less than unity in seawater or saline water (Starinky et al., 1983). In this study, most groundwater samples (Table 3) have Na/Cl ratio less than unity with an increase in Cl concentration values. Chloride Cl- and Bromide Br- ions are considered as conservative indicators of salinity origin. Seawater has a Br/Cl ratio of 0.005 in Mediterranean countries (Jones et al., 1999; Vengosh et al., 1999). In this study area, the Br/Cl ratio ranges from 0.002 to 0.134 with an average of 0.03. This value is higher than 0.005 indicating that groundwater is affected by two sources of intruded seawater and rainfall through the recharge areas.
Seawater fraction
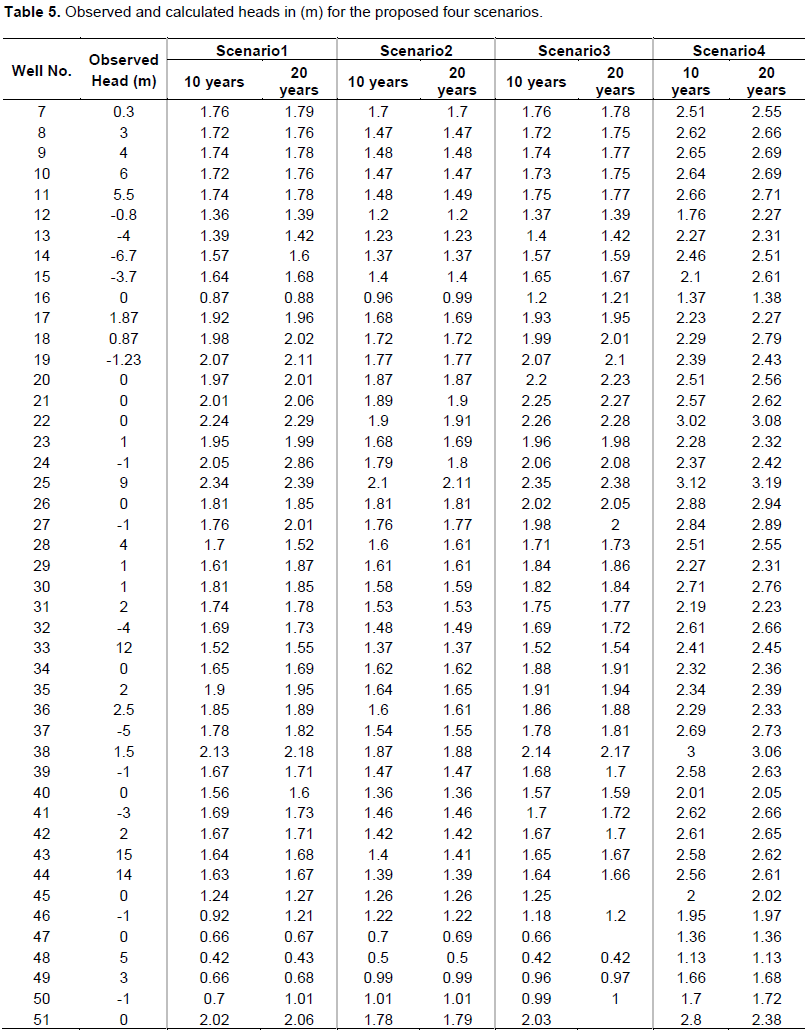
In fact, the fraction of seawater (fsea) in a water sample can be approximated from the concentrations of Cl-(mCl) in meq/l as expressed in Equation 4 (Appelo and Psotma, 2005):
Similarly, the increase in total dissolved solids or electrical conductivity (EC) is a common simple indicator to identify an increase in salinity (Singhal and Gupta, 2010; Rhoades et al., 1992).
Calculation of seawater fraction for groundwater samples in 2009 (Table 4) reveals that about 38% of samples have fsea range values between 5 to 10 and about 11% have fsea >10. In groundwater samples collected in 2015, about 12% have 5 < fsea>10 while, 47% of groundwater samples have fsea>10 indicating more salinization in 2015 than 2009.
Model output
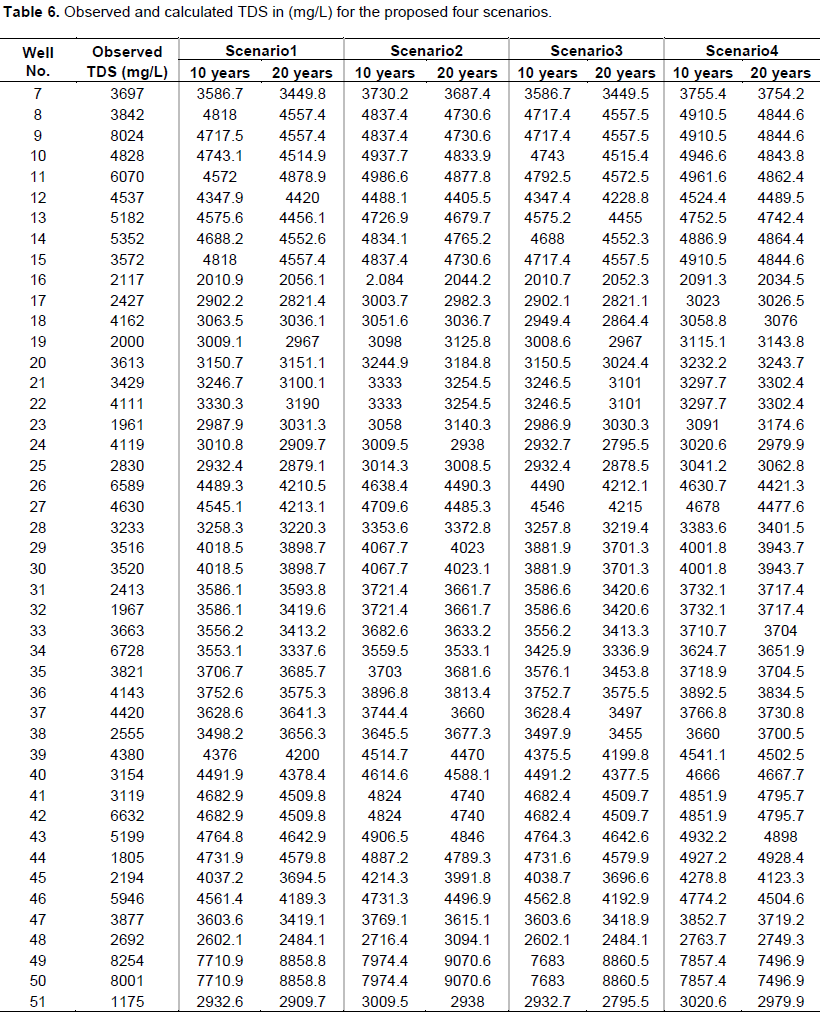
The model output gives the contours for equipotential, head difference, head flux, drawdown, water table and TDS concentration. The velocity vectors visualize the speed and direction of water particles as it moves through flow field. The output screen also gives the concentration versus time (in days). The visual MODFLOW output screen gives residual histograms as well as normalized RMS vs. time graph. The simulated results for four scenarios are plotted for TDS versus Year for 45 monitoring wells located on Ras El-Hekma area.
The simulated results of the four proposed scenarios are tabulated in Tables 5 and 6 for the observed and calculated heads (m) and TDS (mg/L), respectively. From all these scenarios, several observations are noticed as follows:
1) Increment in heads (m) with simultaneous decrease in TDS values in (mg/L) may be due to refreshment from the high tableland areas.
2) Decrease in heads (m) with increase in salinization of some wells may be due to overpumping that led to dissolution of some marine deposits and thus increment in TDS (mg/L) values.
3) The third observation is increment in both heads (m) and TDS (mg/L) simultaneously and this situation encountered seawater intrusion at some locations.
4) The distance between the wells and the coast and the recorded observed heads (m) greatly affected the
previous observation noticed.
5) The more affected wells by intruded seawater are those that have a distance <1.5 km from the coast, and wells at a distance >1.5 km are affected by dissolution due to overpumping or refreshment from the higher table lands areas.
Scenario 1: The base case scenario of pumping 40 m3/day shows a fluctuation in heads (m) as in Tables 5 and 6. Where the drawdown in heads range between 0.1 to 13.36 m and 0.05 to 13.32 m, with simultaneous decrease in TDS (mg/L), with values ranging between 84.9 and 3306 mg/L and 117 to 3466 mg/L at the end of 10 and 20 years of simulation, respectively. This may be due to refreshment from the higher tableland areas.
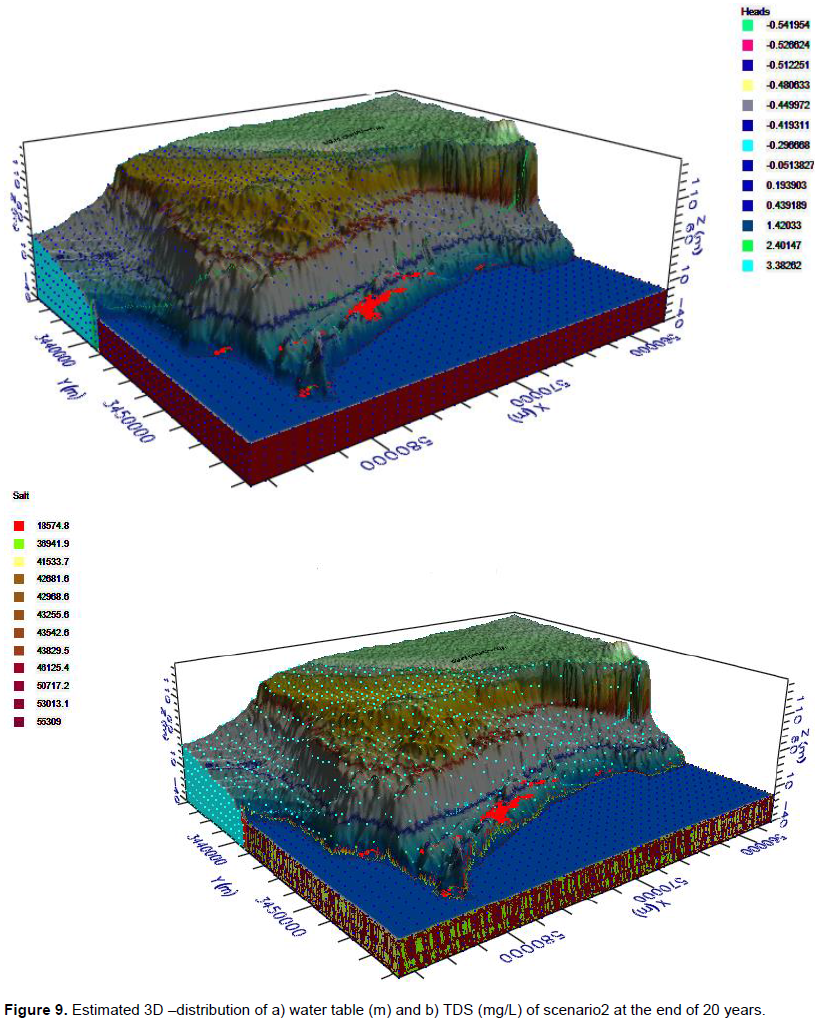
Scenario 2: With increasing stresses on the system by increasing the pumping rate to 80 m3/day, the response of the system is illustrated in Tables 5, 6 and Figure 9. Increase in overpumping affected the wells more badly, where more drawdown occurred reaching 13.6 m in some wells with simultaneous increase in TDS values that reached 1083 mg/L and may be affected by dissolution of some marine deposits.
Scenario 3: Taking into consideration the presence of both wells (2009 and 2015) at the same time with pumping rate of 40 m3/day, the results of this scenario are illustrated in Tables 5 and 6 and they show more decrease in heads due to densely crowded wells and low managed system.
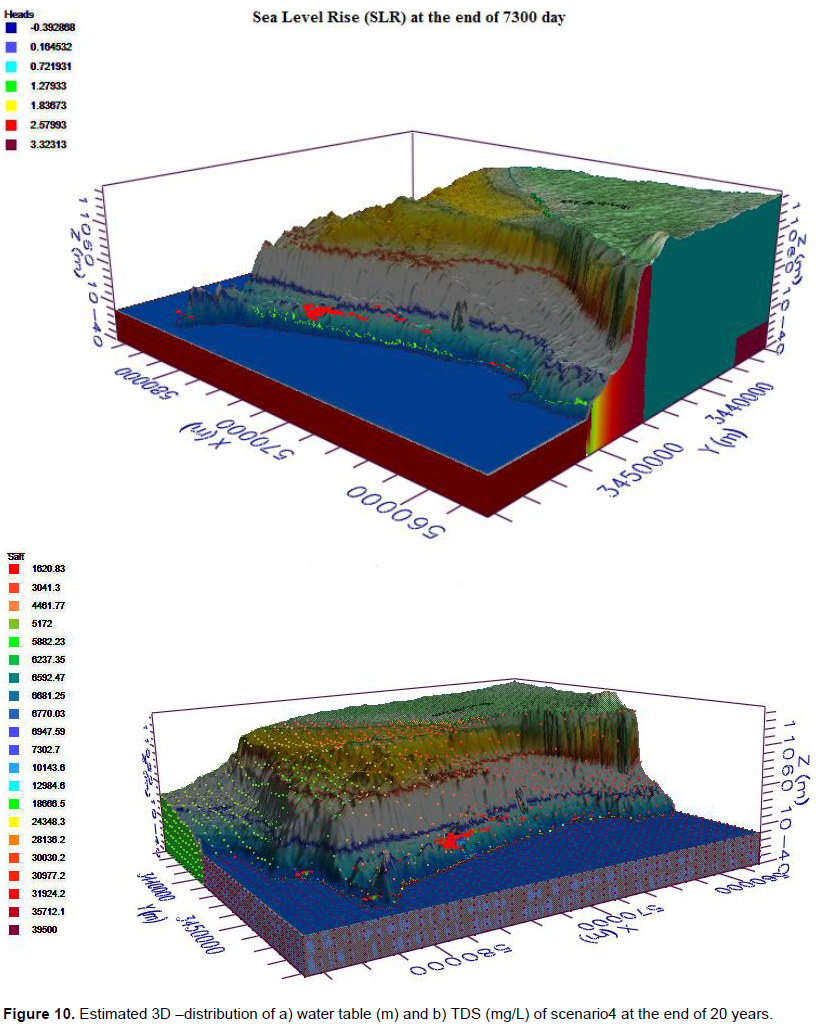
Scenario 4: Based on the expected sea level rise of 0.5 m, the result of this scenario is illustrated in Tables 5, 6 and Figure 10. As expected there was an increase in heads that range between 0.19 to 9.16 m and 0.23 to9.21 m at the end of 10 and 20 years of simulation with simultaneous increase in salinity rate of some wells that reached to 2000 mg/L as in Well No. 51 which may be due to intruded seawater at this location. Seawater interface layer shifted more inland about 0.5 to 2 km and ensured that intrusion of seawater, especially at northeastern location occurred.
The effect of seawater intrusion on fresh groundwater in coastal areas requires more investigations, especially when the withdrawal for water supply in the coastal areas increases. An attempt has been made in the present study to demarcate the salinization influences by hydrochemistry and modeling approach. The groundwater flow is directed toward Mediterranean Sea with a steep groundwater gradient. Water chemistry data signifies high EC and TDS values along the coastal regions suggesting saline water traces. Sodium and chloride were found to be dominating along the coastal regions of Ras El-Hekma area. The SEAWAT model calibrated and validated for the present study with applying different scenarios suggests that drawdown in groundwater level of some observed wells range from 0.56 to 10.07 m especially in observed wells located at about 1 to 1.4 km with replenishment from rainfall and surface runoff causing a water table rise of about 11.5 to 14.8 m in some observed wells that were located inland. For sea level rise, the seawater/freshwater interface will migrate more inland (0.5 to 2 km) than its current position. The hydrochemistry and model results recommend a decrease in pumping to the drilled wells in order to avoid further seawater intrusion along the coast and upwelling of deep saline groundwater.
The author has not declared any conflict of interests.
REFERENCES
|
Appelo CAJ, Postama D (2005). Geochemistry, groundwater and pollution, 2nd edn. Balkema, Rotterdam.
Crossref
|
|
|
|
Ali A, Oweis T, Rashid M, El Naggar S, Abdul Al A (2007). Water harvesting options in the drylands at different spatial scales. Land Use Water Resour. Res. 7:1-13.
|
|
|
|
|
APHA (1995). Standard methods for examination of water and wastewater, 19th edn. American Public Health Association, Washington, p 2540C.
|
|
|
|
|
Barbecot F, Marlin C, Gibert E, Dever L (2000). Hydrochemical and isotopic characterization of the Bathonian and Bajocian coastal aquifer of the Caen area (Northern France). Appl. Geochem. 15(6):791-805.
Crossref
|
|
|
|
|
CONOCO (1986). Geological map of Egypt. Scale 1:500,000 GPC, sheets No. NH35NE.
|
|
|
|
|
Datta B, Vennalakanti H, Dhar A (2009). Modeling and control of saltwater intrusion in a coastal aquifer of Andhra Pradesh, India. J. Hydro-environ. Res. 3:148-159.
|
|
|
|
|
Eissa MA, de-Dreuzy JR, Parker B (2017). Integrative management of saltwater intrusion in poorly-constrained semi-arid coastal aquifer at Ras El-Hekma, Northwestern Coast, Egypt. Groundwater for Sustainable Development. 2017 Oct 14.
Crossref
|
|
|
|
|
El-Raey M (1998). Framework of integrated coastal area management of the Fuka-Matrouh area, Egypt, PAP/RAC-37-1995.
|
|
|
|
|
El-Raey M, Dewidar KR, El- Hattab M (1999). Adaptation to the impacts of sea level rise in Egypt. Mitig. Adapt. Strateg. Glob. Change 4:343-361.
Crossref
|
|
|
|
|
Harding AE, Palutikof J, Holt T (2009). The climate system. In: Woodwoard JC (ed) The physical geography of the Mediterranean. Oxford University Press, Oxford, pp. 69-88.
|
|
|
|
|
Harbaugh AW, Banta ER, Hill MC, McDonald MG (2000). MODFLOW-2000,the U.S. Geological Survey modular ground-water model-User guide to modularization concepts and the groundwater flow process. US Geol Survv Open-File Rep 00–92.
|
|
|
|
|
IPCC (2007). Climate change: the physical science basis. Contribution of Working Group I to the Fourth Assessment Report of the Intergovernmental Panel on Climate Change. In: Solomon S, Qin D, Manning M, Chen Z, Marquis, Averyt KB, Tignor M, Miller HL (eds) Cambridge University Press, Cambridge.
|
|
|
|
|
Guo W, Bennett GD (1998a). Simulation of saline fresh water flows using MODFLOW. In: Proceedings of MODFLOW '98 conference at the International Ground Water Modeling Center, Golden, Colorado 1:267-274.
|
|
|
|
|
Guo W, Bennett GD (1998b). SEAWAT version 1.1:a computer program for simulation of groundwater flow of variable density. Fort Myers, Florida: Missimer International Inc.
|
|
|
|
|
Guo W, Langevin CD (2002). User's guide to SEAWAT: a computer program for simulation of three-dimensional variable-density ground-water flow. USGS Open-File Rep, pp. 01-434.
|
|
|
|
|
Hammad FA (1972). The geology of the soil and water resources in the area between Ras El-Hekma and Ras Alam El-Rum (western Mediterranean littoral zone, Egypt): Ph.D. dissertation, Cairo University.
|
|
|
|
|
Harbaugh AW, Banta ER, Hill MC, McDonald MG (2000). MODFLOW-2000, the U.S. Geological Survey Modular GroundWater Model—User Guide to Modularization Concepts and the Ground-Water Flow Processes. U.S. Geological Survey OpenFile Report 00-92, 121p.
|
|
|
|
|
Jones BF, Vengosh A, Rosenthal E, Yechieli Y (1999). Geochemical investigations In: Bear J., Cheng A.H.D., Sorek S., Quazar D., and Herrera I., Eds., Seawter intrusion in coastal aquifers. Kluwer Academic Publishers, Dordreht/ Boston/London 22:1-71.
Crossref
|
|
|
|
|
Konikow L, Reilly T (1999). Seawater Intrusion in the United States. Seawater intrusion in coastal Aquifers-Concepts, methods and practices (pp. 463-506), Springer.
Crossref
|
|
|
|
|
Langevin CD, Shoemaker WB, Guo W (2003). MODFLOW-2000, the U.S. Geological Survey modular ground-water model Documentation of the SEAWAT-2000 version with the variable-density flow process (VDF) and the integrated MT3DMS transport process (IMT). US Geol. Surv. Open-File Rep 03-426.
|
|
|
|
|
Langevin CD, Guo W (2006). MODFLOW/MT3DMS-based simulation of variable-density ground water flow and transport. Ground Water 44:339-351.
Crossref
|
|
|
|
|
McDonald MG, Harbaugh AW (1998). A modular three-dimensional ï¬nite-difference ground-water flow model. U.S. Geological Survey Techniques of Water Resources Investigations, Book 6, chap A1, 588p.
|
|
|
|
|
Morad NA, Masoud MH, Abdel Moghith SM (2014). Hydrologic factors controlling groundwater salinity in northwestern coastal zone, Egypt. J. Earth Sys. Sci. 123(7):1567-1578.
Crossref
|
|
|
|
|
Park SC, Yun ST, Chae GT, Yoo IS, Shin KS, Shin KS, Heo CH, Lee SK (2005). Regional hydrochemical study on salinization of coastal aquifers, western coastal area of south Korea. J. Hydrol. 313:182-194.
Crossref
|
|
|
|
|
Rhoades JD, Kandiah A, Mashali A (1992). The use of saline waters for crop production. Rome, Italy: UN FAO irrigation and Drainage paper 48.FAO website www.fao.org/docrep/t0667e/t0667e00.HTM
|
|
|
|
|
Singhal BB, Gupta RP (2010). Applied hydrogeology of fractured rocks. Springer Science & Business Media; 2010 Aug 20.
|
|
|
|
|
Starinky A, Bieleski M, Ecker A, Steinitz G (1983). Tracing the origin of salts in groundwater by Sr isotopic composition (the crystalline complex of the southern Sinai Egypt. Isotope Geosci. 1:257-267.
|
|
|
|
|
Soliman M, Massoud U, Mesbah HSA, Ragab EA (2013). Mapping of seawater/freshwater interface at the northwestern coast of Egypt by 2-D resistivity imaging and transient electromagnetic soundings. SEG Houston 2013 Annual Meeting.
Crossref
|
|
|
|
|
Sewidan AS (1978). Water Budget Analysis for the Northwestern Coastal Zone. Ph.D. Thesis, Fac. Sci. Cairo Univ. P 179.
|
|
|
|
|
United Nations Conference on Environment and Development (UNCED) (1992). Agenda 21: Chapter 17.3.
View [August, 2007].
|
|
|
|
|
Vengosh A, Spivack AJ, Artzi Y, Ayalon A (1999). Geochemical and boron, stronium and oxygen isotopic constraints on the origin of the salinity in groundwater from the Mediterranean coast of Israel. Water Resour. Res. 35:1877-1894.
Crossref
|
|
|
|
|
Yousif M, Bubenzer O (2011). Integrated remote sensing and GIS for surface water development. Case study: Ras El Hekma area, northwestern coast of Egypt. Arab J. Geosci. doi:10.1007/s12517-011-0433-1.
Crossref
|
|
|
|
|
Yousif M, Bubenzer O (2013). An integrated approach for groundwater assessment at the Northwestern Coast of Egypt (Ras El-Hekma area): Case study. Environ. Earth Sci. 69:2227-2246.
Crossref
|
|
|
|
|
World Health Organization (WHO) (2011). Guidelines for drinking water quality, World Health Organization Geneva, 4th ed., Recommendations, 1-4.
|
|
|
|
|
Zheng C, Wang PP (1998). MT3DMS, A modular three-dimensional multispecies transport model for simulation of advection, dispersion and chemical reactions of contaminants in groundwater systems, Vicksburg, Miss., Waterways Experiment Station, US Army Corps of Engineers.
|
|
|
|
|
Zheng C (1990). MT3D: A modular three-dimensional transport model for simulation of advection, dispersion and chemical reactions of contaminants in groundwater systems. Report to the U.S. Environmental Protection Agency, Ada, Oklahoma.
|
|