Full Length Research Paper

ABSTRACT
Post-drilling investigation for prolific groundwater aquifer was conducted in a well at the Nigeria LNG Base, Port Harcourt using geoelectric logging. Resistivity (Short Normal and Long Normal) and Self-Potential (SP) logs were employed. Two zones (A and B) were tested to determine the porosity (ɸ), permeability (k) and the total dissolved solids (TDS) in the aquifer. Results show that the inferred lithology in the borehole consists of sand, clayey-sand and clay materials. They also indicate that test zone A (110-140 m), though permeable, has high membrane potential which is higher than the liquid-junction potential resulting from clay intercalation thereby reducing its viability as a production zone. Zone B is found to be prolific with porosity and permeability values of 18% and 131.31 mD respectively at depth range of 140 to 180 m. The total dissolved solid (TDS) derived from electrical conductivity (EC) value of 6250 μmhoscm-1 is 4000 mg/litre for this zone. The high TDS value observed within this prolific groundwater zone in the well may be as a result of effluent discharge by industries around the area or saline water intrusion due to its proximity to the Bonny River. The 4000 mg/litre falls outside the World Health Organization’s acceptable limit palatability for drinking water and may have the negative effects of excessive scaling in water pipes, water heaters, boilers, and domestic appliances such as kettles and steam irons which may reduce their service span. Effective water treatment is therefore recommended.
Key words: Self-potential, resistivity, electrical conductivity, geoelectric, aquifer, total dissolved solids.
INTRODUCTION
The Nigerian Liquefied Natural Gas (NLNG) Base, Port Harcourt is a hub of oil and gas business and ferry activities. It offers administrative services and also serves as an entrepot for staff of NLNG and other allied companies and residents of Bonny Island, Finima and other communities. Consequently, a good potable water supply system is required for use at this Base. But the absence of public water supply scheme gave rise to the use of groundwater boreholes. As such, these boreholes must be properly located, drilled, logged and completed to delineate the best aquifer.
Geoelectric logging is a very useful post-drilling technique in boreholes for hydrological characterization of groundwater aquifer systems in the absence of chemical analyses. Essentially, this should be conducted immediately after drilling or before screening and casing of the well for water supply to ensure that the aquifer delineated is prolific and of good quality not containing mineralized or saline water but fresh water.
With recourse to the safe yield of groundwater aquifers and possible deterioration of water quality, several researchers (Aweto et al., 2018; Alaminiokuma et al., 2017; Anomohanran, 2014; Akpan et al., 2013; Oyedele, 2009) have conducted investigations in the Niger Delta using different techniques. Etu-Efeotor and Akpokodje (1990) noted that groundwater development and abstraction have been undertaken indiscriminately. However, Alaminiokuma et al. (2017) underscored the need for groundwater wells to be geoelectrically logged before completion and production and also recommended that hydrologists should not only rely on core samples collected at depth intervals during drilling to draw conclusion on the location for screening in the wells.
Consequently, geoelectric logging was conducted in a well drilled to a depth beyond 180 m at the NLNG Base, Port Harcourt. Self-Potential (SP) and Resistivity (Short Normal and Long Normal) Logs were employed. The quality of the groundwater was determined by deriving the total dissolved solids (TDS) from the electrical conductivity (EC) and the prolific nature of the aquifers was determined by computing for the porosity (ɸ) and permeability (k) of the aquifers.
Location
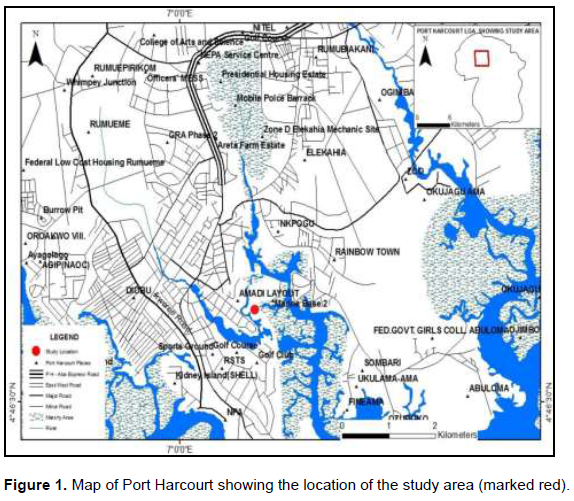
The Nigeria Liquefied Natural Gas (NLNG) Base is geographically located between latitude N4°47ʹ34.667ʺ and longitude E7°01ʹ17.964ʺ along Ntawogba creek in Port Harcourt in the Niger Delta region of Nigeria (Figure 1). Port Harcourt is located by the Bonny River about 64km from the sea. The climate of the area is tropical marked by two distinct seasons, which are rainy and dry seasons. The rainy season starts from March to October while the dry season begins from November to February.
Geology and hydrogeology of the study area
The study area, Nigeria LNG Base, Port Harcourt is located in the Niger Delta Basin of southern Nigeria. The Niger Delta is located on the West African continental margin where the east-trending Equatorial coast turns south towards the Equator. The development of Niger Delta resulted from the formation of the Benue trough as a failed arm of the rift triple and South American continents and subsequent opening of the South Atlantic (Murat, 1970; Evamy et al., 1978; Whiteman, 1982). The Benue-Abakaliki trough was filled with sediments during the early Cretaceous time, later it underwent folding, faulting, and uplift with subsidence of the adjacent Anambra Basin to the West and Afikpo Syncline to the East during the Santonian. The proto-Niger Delta ended in the Paleocene time. The coastal sedimentary basin of Nigeria was the scene of three depositional cycles. The first began with a marine incursion in the middle Cretaceous and was terminated by a mild folding phase in Santonian time. The second included the growth of a proto-Niger delta during the late Cretaceous and ended in a major Paleocene marine transgression. The third cycle, from Eocene to recent, marked the continuous growth of the main Niger Delta. The Niger Delta subsurface has a few three-fold lithostratigrahic subdivision, comprising an upper sandy Benin Formation, an intervening unit of alternating sandstone and shale named the Agbada Formation, and a lower Shaly Akata Formation. These three units extend across the whole Delta and each ranges in age from early Tertiary to recent. A separate member of the Benin Formation is recognized in the Port Harcourt area.
The Delta is dissected by a dense network of rivers and creeks, which maintain a delicate but dynamic equilibrium between saline, estuarine and freshwater surface bodies with complex underground extensions (Abam, 1999). The River Niger drains a large part of West Africa and discharges its waters, sediments and other loads including exotic species into the Niger Delta and its extensions into the Atlantic Ocean. The dense network of rivers and creeks in the dissected surface of the Delta creates a condition of delta-wide hydrological continuity. The rivers network conveys water and sediments through some 20 estuaries into the Atlantic Ocean to support the dynamic equilibrium of the coastal hydrological processes.
Theory of geoelectric logging
Spontaneous (self) potential log
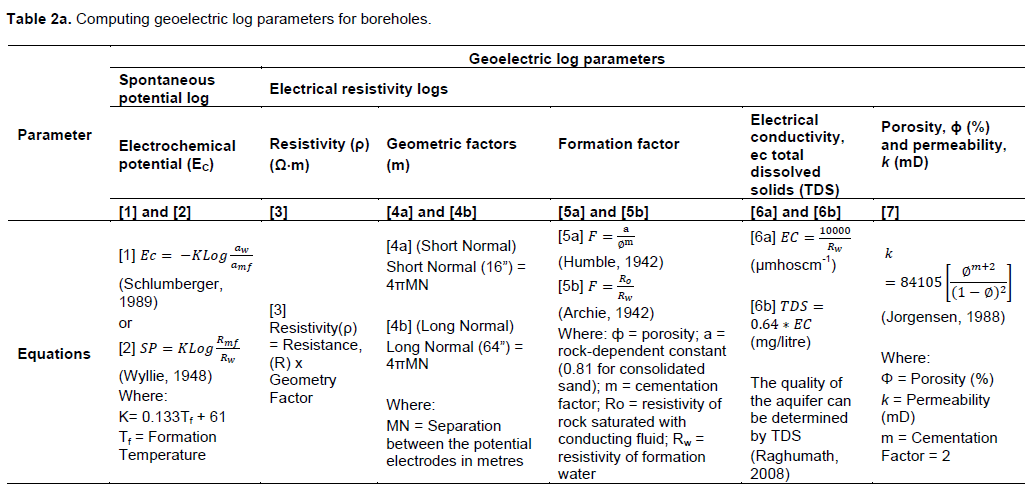
Self-Potential (SP) log gives the electrical potential produced by the interaction of the connate water, the drilling fluid and certain ion-selective rocks. It delineates and indicates the magnitude of porous/permeable formation and resistivity of the formation water (Rw). SP currents which are produced from electromotive forces are Electrokinetic and Electrochemical (membrane Potential and Liquid-Junction Potential) in origin (Schlumberger, 1989). This can be computed by Equation 1 in Table 2a while the SP can be computed by Equation 2 in Table 2a.
SP log is deployed for the delineation of shale/sand formation (Raghumath, 2008). Mounce and Rust (1944) stated that electrochemical potential is the primary parameter for the SP log. Ushie (2001) stated the correlation between the Static SP values to the chemical activity of the formation water, while Schlumberger (1989) correlates this Electrochemical Potential (membrane and liquid-junction potential) to the chemical activities of the formation water.
The deflection of the SP curve is relative to the salinity between the formation water and the drilling fluid. If the fluid is less saline than the formation water, then the deflection is to the negative. But if the drilling fluid is more saline than the formation water, then the deflection is to the positive.
Electrical resistivity log
The electrical resistivity log used contains both short normal and the long normal. The short normal has a distance of 16” between the potential electrodes, MN, while the long normal has a distance of 64” between the potential electrodes, MN. The apparent resistivity of a medium and the geometric factor can be computed by Equations 3 and 4a and 4b respectively in Table 2a.
METHODOLOGY
Set-up and logging
Set-up and logging follow similar procedures employed by Alaminiokuma et al. (2017) in which the Terrameter system comprises the SSR-MP-ATS basic measuring unit with a liquid crystal digital read-out and automatic signal averaging microprocessor, a current control box, and multi electrode probe. The unit has capabilities of measuring spontaneous potential (SP) and resistivity (Short Normal 16”, Long Normal 64”).
The operations involve the logging of one borehole drilled to a depth beyond 180 m. Self-potential (SP) and resistivity logs (Short Normal 16” and Long Normal 64”) were run. A Sonde is first lowered step-wisely to the bottom of the hole. Thereafter, the resistivity and SP measurements are taken when the sonde is pulled out of the hole. This allows for a stable Sonde and unperturbed logging of electrical resistivity and spontaneous potential logs in the wellbore.
Schlumberger charts methods
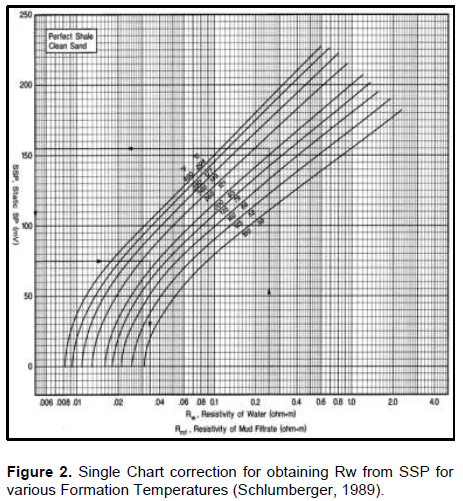
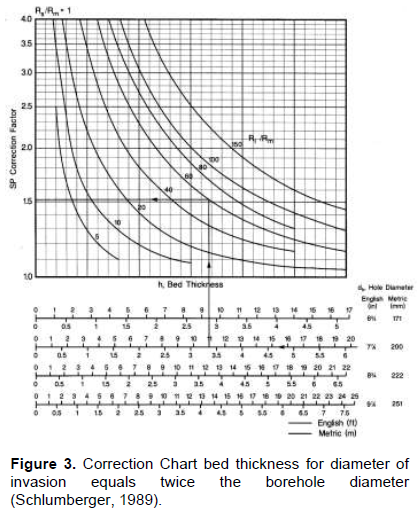
The investigation also involves the use of Schlumberger Charts methods (Figures 2 and 3) to analyze the hydrological parameters thus assessing the viability of the aquifers.
Well parameters
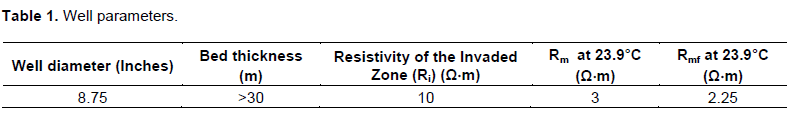
In determining the hydrological parameters, the following well parameters were considered and used for correction of hydrological parameters (Table 1).
Theoretical equations for computation of geoelectric logs and hydrological parameters
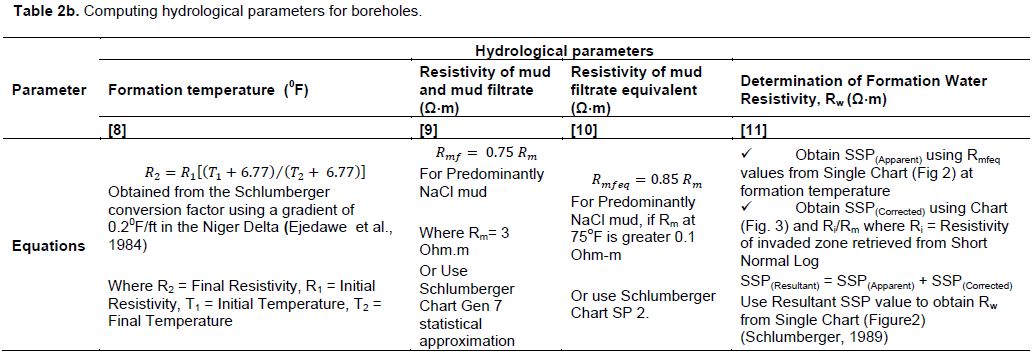
The computations of the geoelectric logs parameters using established empirical relations and the hydrological parameters using standard relations for boreholes are done using Equations 1 to 11 in Tables 2a and 2b and Figures 2 and 3.
Digitization of geoelectric logs
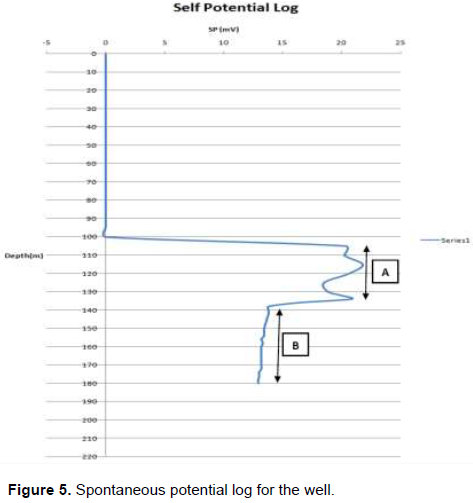
Figures 4 and 5 show the electrical resistivity and spontaneous potential logs respectively for the well. Zones A and B were tested in the well.
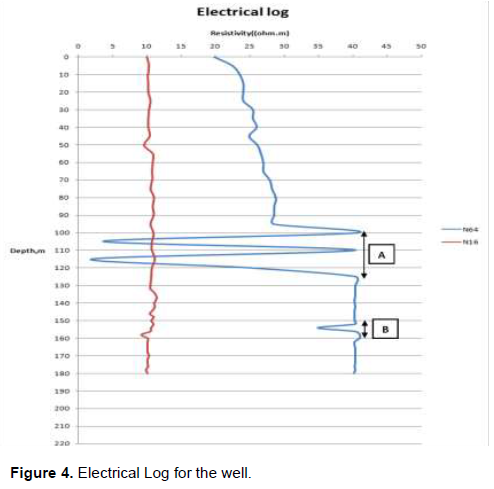
The electrical resistivity log shows that the electrokinectic streaming potential is within the regions 100-120 m for test zone A and 150-160 m for test zone B for Long Normal Log (64”) while a flat response is observed for Short Normal Log (16”) in the well. The Electrical Log shows that the depth surveyed is made of permeable sandy/clayey layers down to the drilled depth.
The spontaneous potential log over a clean thick formation shows higher electromotive potential within the region 110-140 m for test zone A and a flat positive response from 140-180 m for test zone B in the well.
RESULTS AND DISCUSSION
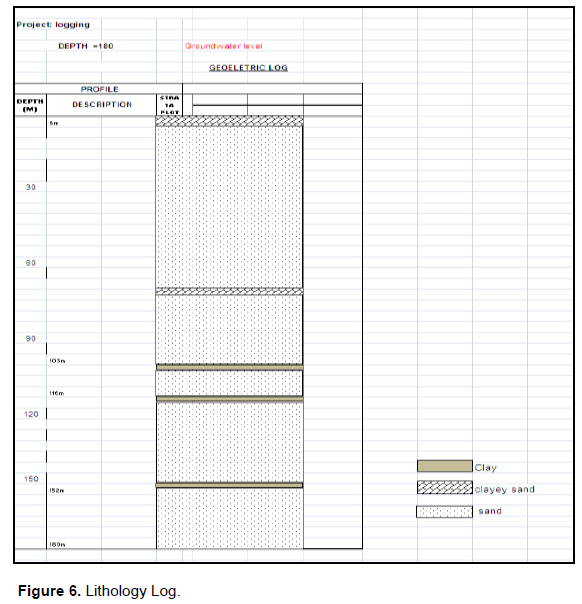
The two test zones (A and B) in the well were observed to be of hydrological interest in this study. It can be observed that though both zones are permeable, but the high Electromotive Force revealed by the SP log within zone A is as result of the intercalation of clay layers, which caused a marked increase in the membrane potential, which is always higher than the liquid-junction potential. This clay layer is also revealed by the unstable deflection in the long normal resistivity log (Figure 4) within the zone A and also the Lithology log (Figure 6) showing the shale intercalation. This reduces the viability of zone A as a prolific groundwater zone. Hence Zone B is considered and analyzed.
The digitized logs show that SP Log (Figure 5) gives a value of about 17mV, while the Electrical Resistivity Log (Figure 4) gives Ro of about 40 (Ω⋅m) from depth range of 140 -180 m (Zone B).
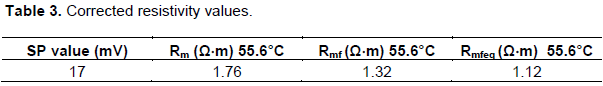
Correcting for mud resistivity, Rm and computing for resistivity of mud filtrate equivalent, Rmfeq values at a temperature of 55.6°C and depth of 140 m using Equation 8 in Table 2a, Equation 10 in Table 2b and Chart Gen 9 in Figure 2 gives the values in Table 3.
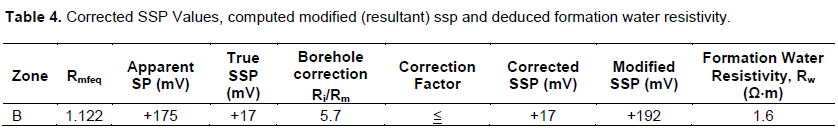
Now, deducing Apparent SP (mV) from Single Chart (Figure 2), obtaining corrected Static SP using the Chart for bed thickness and invasion (Figure 3), correcting the resistivity of the invaded zone, Ri for borehole diameter, computing for Modified (Resultant) Static SP using Equation 11 and deducing Formation Water Resistivity, Rw using Schlumberger Single Chart gives the values in Table 4.
More so, computing for Electrical Conductivity (μmhoscm-1) using Equation 6a, deriving Total Dissolved Solid (TDS) using Equation 6b, computing for porosity by combining Equations 5a and 5b and computing for permeability using Equation [7] in Table 2a give the hydrological values in Table 5.
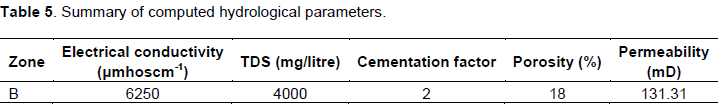
Table 5 shows that for zone B in the well, porosity and permeability have values of 18% and 131.31 mD, respectively, at depth range of 140 to 180 m. The analyses of the geoelectric logs and interpretation of hydrological parameters of the borehole as indicated in this study reveal a prolific aquifer at a depth range of about 140-180 m. The inferred lithology in the borehole consists of sand, clayey-sand and clay materials. The sand constitutes the reservoir rock and exhibits a productive aquifer thickness of about 40 m.
CONCLUSION
Well completion processes: screening and gravel-packing should be done at the extensive aquifer zone between 140 and 180 m to improve on the efficiency of the groundwater well production system at the NLNG Base, Port Harcourt. The observed porosity of 18 % and permeability of 131.31 mD are consistent with established standards for good aquiferous geological materials (Freeze and Cherry, 1979; Todd, 1980; Driscoll, 1986). The TDS of 4000 mg/litre observed within this prolific groundwater zone in the well may be as a result of effluent discharge by industries around the area or saline water intrusion due to its proximity to the Bonny River. The 4000 mg/litre falls outside the World Health Organization’s acceptable limit palatability for drinking water. The WHO’s TDS levels are as follows: excellent, less than 300 mg/litre; good, between 300 and 600 mg/litre; fair, between 600 and 900 mg/litre; poor, between 900 and 1200 mg/litre; and unacceptable, greater than 1200 mg/litre (WHO, 2003). The implications of 4000 mg/litre observed at the NLNG Base would be excessive scaling in water pipes, water heaters, boilers, and domestic appliances such as kettles and steam irons (Tihansky, 1974). Such scaling can shorten the service life of these appliances (McQuillan and Spenst, 1976).
CONFLICT OF INTERESTS
The authors have not declared any conflict of interests.
REFERENCES
|
Abam TKS ((1999). Dynamics and quality of water resources in the Niger Delta. IAHS Publication, pp. 429-437. |
|
|
Akpan AE, Ugbaja AN, George NJ (2013). Integrated geophysical, geochemical and hydrogeological investigation of shallow groundwater resources in parts of the Ikom-Mamfe Embayment and the adjoining areas in Cross River State, Nigeria. Environmental Earth Sciences 70(3):1435-1456 |
|
|
Alaminiokuma GI, Warmate T, Emudianughe JE (2017). Geoelectrical Logging for well screening in prolific Aquifers in Ubima, Ikwerre Local Government Area, Rivers State, Nigeria. African Journal of Environmental Science and Technology 11(6):324-330. |
|
|
Anomohanran O (2014). Hydrogeophysical and hydrogeological investigations of groundwater resources in Delta Central, Nigeria. Journal of Taibah University for Science 9(2015):57-68 |
|
|
Archie GE (1942). The Electrical Resistivity as an aid in Determining Some Reservoir Characteristics. Transactions of the AIME 146(1):54-62 |
|
|
Aweto KE, Chiyem FI, Asuma, OO (2018). An Approach to Determine Total Dissolved Solids in Groundwater using Electrical Resistivity Sounding and Geochemical Methods. Global Journal of Geological Sciences 16:37-43 |
|
|
Driscoll FG (1986). Groundwater and Wells. 2nd edition, Johnson Division, St Paul, Minnesota, p. 1089. |
|
|
Ejedawe JE, Coker SJL, Lambert-Aikhionbare DO, Alofe KB, Adoh FO (1984). Evolution of oil-generative window and oil and gas occurrence in Tertiary Niger Delta Basin: American Association of Petroleum Geologists 68:1744-1751. |
|
|
Etu-Efeotor JO, Akpokodje EG (1990). Aquifer systems of the Niger Delta. Journal of Mining Geology 26(2):279-284. |
|
|
Evamy BD, Haremboure J, Kamerling P, Knaap WA, Molloy FA, Rowlands PH (1978). Hydrocarbon habitat of Tertiary Niger Delta: American Association of Petroleum Geologists Bulletin 62:277-298. |
|
|
Freeze RA, Cherry JA (1979). Groundwater. Prentice-Hall, Englewood Cliffs, New Jersey, p. 604. |
|
|
Jorgensen DG (1988). Estimating Permeability in Water Saturated formations. The Log Analyst 2(6):401-409. |
|
|
Murat RC (1970). Stratigraphy and Pale Geography of the cretaceous and Tertiary in Southern Nigeria: 1st Conference on African Geology, Ibadan, 1970, Proceeding; Ibadan University Press, pp. 251-266. |
|
|
McQuillan RG, Spenst PG (1976). The addition of chemicals to apartment water supplies. Journal of the American Water Works Association 68:415. |
|
|
Mounce WD, Rust Jr WM (1944). Natural potentials in well logging. Transactions of the AIME 155(1):49-57 |
|
|
Oyedele KF (2009). Total Dissolved Solids (TDS) mapping in groundwater using geophysical method. |
|
|
Raghumath HM (2008). Ground Water. New Age International Publishers, New Delhi, India |
|
|
Schlumberger Limited (1989). Log Interpretation Principle/Application, Houston, Texas, U.S.A. |
|
|
Tihansky DP (1974). Economic damages from residential use of mineralized water supply. Water Resources Research 10(2):145. |
|
|
Todd DK (1980). Groundwater Hydrology. 2nd edition, John Wiley, New York, p. 535. |
|
|
Ushie FA (2001). Formation Water Resistivity (Rw) Determination. The SP Method. Journal of Applied Sciences and Environmental Management 5(1):25-28. |
|
|
Whiteman A (1982). Nigeria: Its Petroleum Geology, Resources and Potential: London, Graham and Trotman, p. 94. |
|
|
WHO (2003). Total Dissolved Solids in Drinking Water. Background Document for Development of WHO Guidelines for Drinking-Water Quality. |
|
|
Wyllie MRJ (1948). A Quantitative analysis of the Electrochemical Component of the SP Curve. Trans AIME, 186 17. |
|
Copyright © 2024 Author(s) retain the copyright of this article.
This article is published under the terms of the Creative Commons Attribution License 4.0


