ABSTRACT
Lake Hawassa is one of the eight Major Ethiopian Rift Valley Lakes and the smallest among them which is situated in southern regional state; it is a closed basin system and receives water from only perennial Tikurwuha River and runoff from the catchment areas. It is an important source of water for surrounding rural communities for various uses like domestic, irrigation, livestock watering, fishing and recreation. Quality of the lake water is vital for the surrounding rural and urban communities for proper and safe use of the lake. The present study was designed to determine the water quality status of the lake for multiple designated water uses by employing the water quality index. To assess the status water samples were collected in monthly intervals for a period of three months from December to February (dry period), 2011/12. From all water quality parameters analyzed turbidity, Mn, Na+, K+, F-, PO43-, total coliform and fecal coliform were higher than the recommended limits of national and international standards for designated water uses. Based on the water quality index calculation the lake water is categorized under marginal category which reveals the water is frequently threatened and impaired and as well departs from natural condition. Accordingly the lake water is under fair category for irrigation and aquatic life; however, it needs great care on selection of crops and soil condition. The lake is under higher risk by deleterious anthropogenic activities on watershed and it needs mitigation measures to prevent it from further deterioration.
Key words: Water quality index, Lake Hawassa, water quality status, designated water use
Water is an indispensible and basic element which supports life and the natural environment, a prime component for industry, a consumer item for human beings and animals and a vector for domestic and industrial pollution (Colin and Quevauviller, 1998). Access to adequate water for domestic purposes, irrigation, sanitation, and solid waste disposal are the four basic needs which impact significantly on socio-economic development and the standard of life. Status of water quality is highly imperative to the sustainability of natural ecosystems and any development activities and it demands great monitoring and regulation. However, currently the meager freshwater resources are becoming more unconducive for the required uses due to different point and non-point sources of pollution from the catchment area.
Water pollution also aggravates the problem of water shortage. Due to this fact the world people living under water-stressed condition ranges from 1.4 to 2.1 billion (Vorosmarty et al., 2000; Oki et al., 2003; Arnell et al., 2004) and peoples affected by unsafe, poor sanitation and hygiene reaches 54.2 million per year with 1.7 millions death (WHO, 2005). So, assessing the status of water quality periodically is quite urgent to save the world from severe water quality initiated functional stress and scarcity.
Ethiopia is a developing country which is endowed with a number of lakes and large rivers which gives immense value to overall economic development. For instance, the country has 12 river basins, 11 fresh lakes, 9 saline lakes, 4 crater lakes and over 12 major swamps/wetlands. However, the water scarcity and inadequacy is the main feature of the country today. In addition to scarcity the quality of water is also threatened as common to all developing countries (Milda, 2009). Among freshwater resources, Lake Hawassa is one of the Major Rift Valley lakes in Ethiopia and used for various purposes by semi-urban and urban dwellers. But the lake has been subjected to many pollutants generated from neighboring industries (like Hawassa Textile factory, floury factory, sisal factory, etc), agriculture activities, service rendering centers (near the lake which release their effluent without any treatment like resorts), hospitals, urban storm water and sewage, and other activities on the catchment (Zinabu and Zerihun, 2002). Specifically, Hawassa textile factory and Hawassa Referal Hospital’s discharge to the lake is seriously degrading its viability since their effluents has become over the set standards to the environment (Yosef et al., 2010; Abayneh et al., 2003; Demeke, 1989).
Research on lakes water quality status on regular basis and its impact on the lake ecosystems and on the potential of the lake water resources for multiple designated uses like drinking, irrigation, recreation and aquatic life are very limited. Therefore, this study was undertaken to avail basic information for the determination of the water quality status of the lake and the main constraining factors that limits its suitability for various designated water uses.
Separate assessment of water quality suitability for the intended uses is time consuming and does not yield appropriate systems to monitor and control the quality of water bodies. Thus, evaluation of the water quality status of the lake by using water quality index is employed. Water quality index (WQI) is one of the most effective tools to aggregate and communicate information on the quality of water to the concerned citizens and policy makers (Puri et al., 2011). It numerically summarizes the information from multiple water quality parameters into a single value that can be used to compare data from several sites and months. The use of WQI simplifies the results of analysis related to a water body as it aggregates in one index of all parameters analyzed (Warhate and Wankar, 2012). There are a number of indices developed in many parts of the world to evaluate water quality status and pollution extents of water bodies like U.S NSFWQI (Sharifi, 1990), BCWQI (CCME, 1995), OWQI (DEQ, 2003), and Smith’s Index (Smith, 1987). For this investigation an indices developed by the British Columbia Ministry of Environment, Lands and Parks and modified by Alberta Environment which is CCME WQI (1.0 model) was used. This index provides a numerical values in between 0 (worst water quality) and 100 (best water quality) with five descriptive categories such as excellent (CCME WQI value = 95-100), good (CCME WQI value = 80-94), fair (CCME WQI value = 65-79), marginal (CCME WQI value = 45-64) and poor (CCME WQI value = 0-44) (CCME, 2001).
This study was designed to determine the lake water suitability for drinking, irrigation, recreation and aquatic life by employing the CCMEWQI water quality index calculation method.
Lake Hawassa is one of the eight major Ethiopian Rift Valley lakes which cover an area of about 94km2 (Yemane, 2004) and the smallest in comparison with other central Rift Valley natural lakes. It is situated 275 km south of the capital city Addis Ababa and west of Hawassa town. The lake is located between 06° 58´to 07° 14´ N latitudes and 38° 22’ to 38° 28’ E longitudes with an elevation of 1685 masl and is bounded by various mountains such as Mt. Tabor (1810 masl) and Mt. Alamura (2019 m.a.s.l) (Yemane, 2004). Hence, the surface and sub-surface drainage is towards the lake and it’s the main destination for any type of contaminants generated from catchment areas. The catchment area of the lake is 1250 km2 (Girma and Ahlgren, 2009) with closed basin feature and receives only one perennial river from eastern escarpment, Tikur Wuha River. This river is extremely affected by various industries on the basin like Hawassa Textile Factory, Hawassa Sisal factory, Hawassa Flour Factory, Tabor Ceramic Factory, etc (Yosef et al., 2010).
The area receives a mean annual rainfall of 950 mm and has a mean annual air temperature of 19.8°C (Arkady and Brook, 2008). The area is characterized by three main seasons; long rainy season (locally called kiremt) in the summer from June-September (mean annual total rainfall accounts from 50 to 70%), dry period (locally called bega) which extends between October and February and short rain season (locally called belg) during March and May, when about 20 to 30% of the annual rainfall falls. Mean monthly rainfall is above 100 mm from April to September with August showing the highest 124 mm and the lowest rainfall occur in November, December and January (Halcrow, 2010). It has maximum depth of 22 m and a mean depth of 11 m (Elias, 2000). Evaporation from the lake is estimated to be 1710 mm/year, the average annual inflow and outflow(underground flow) is 1440 and 570 mm, respectively as well as the total volume of the lake water is 1.3 km3(Tenalem, 1998; Gugissa, 2004; Arkady and Brook, 2008).
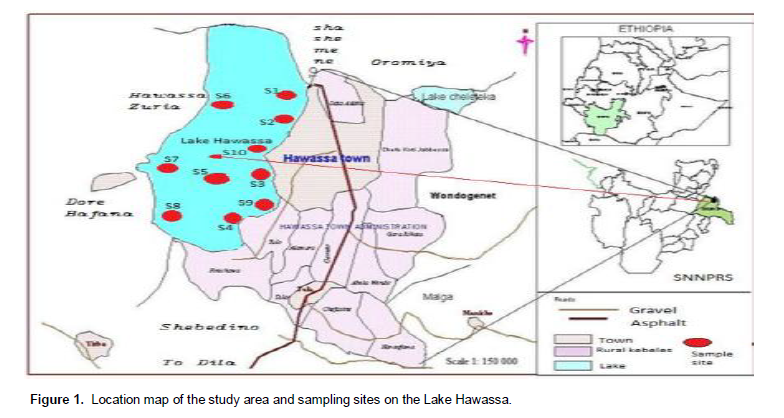
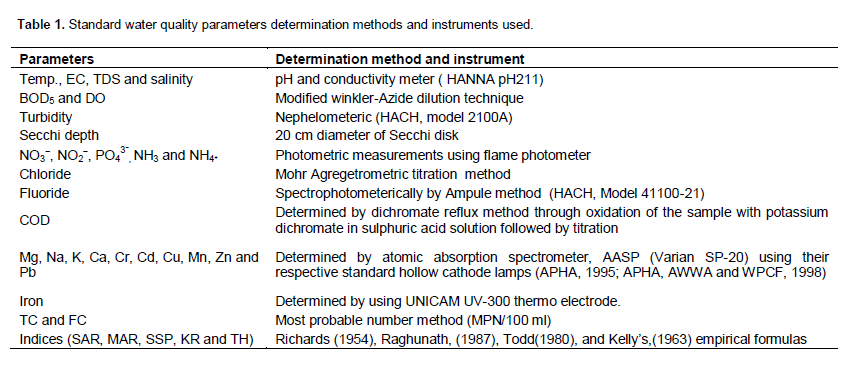
Grab sampling was done in monthly interval for three months (December 2011 up to February 2012) at ten selected sampling sites from surface 30 cm and 1 m bottom of the lake. The sampling sites are selected based on the relative importance, location and magnitude of human influences. Sample site S1 (Inlet of Tikurwuha River to the lake), S2 (around Haile resort), S3 (around Lewi resort), S4 (Referral Hospital), S5 (at the center of the lake), S6 (direct opposite to Haile resort, rural side), S7 (direct opposite to Lewi resort, rural area side, Dore-Bafana), S8 (direct opposite to Referral hospital, rural side), S9 (around Amora-Gedel, town storm water and sewage entrance site) and S10 (around Fikir-Hayike, recreational center) (Figure 1). The water quality parameters analyzed in this study were illustrated on Table 1.
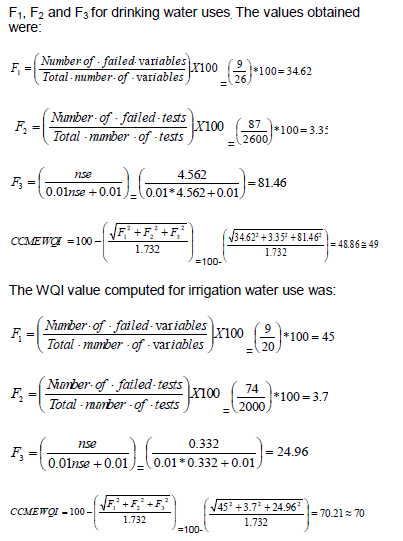
The water quality index was computed following CCME WQI (CCME, 2001) by using the following formula:
where F1 (scope)-is the number of variables whose objectives are not met, F2 (frequency)-is the frequency with which the objectives are not met and F3 (amplitude)-is the amount by which the objectives are not met. The divisor 1.732 normalizes the resultant values to a range between 0 and 100, where 0 represents the “worst” water quality and 100 represents the “best” water quality.
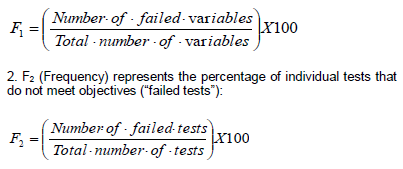
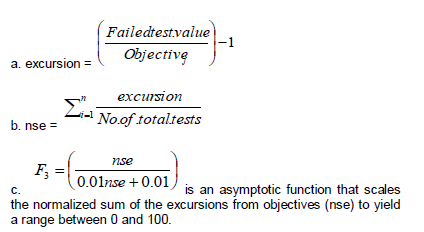
The calculations of these three parameters to determine CCME WQI were described as follows:
1. F1 (Scope) represents the percentage of variables that do not meet their objectives at least once during the time period under consideration (“failed variables”), relative to the total number of variables measured:
3. F3 (Amplitude) represents the amount by which failed test values do not meet their objectives. F3 is calculated in three steps:
The quality criteria of each analyzed parameters were compared to prescribed limits of various international and national standards like WHO (2004), CCME (2009), USEPA (2000), FAO (1985), EEPA(2003) and other guidelines for those designated water uses. After the CCME WQI value was determined with respect to site and month the lake water quality was ranked as per the CCME WQI ranking.
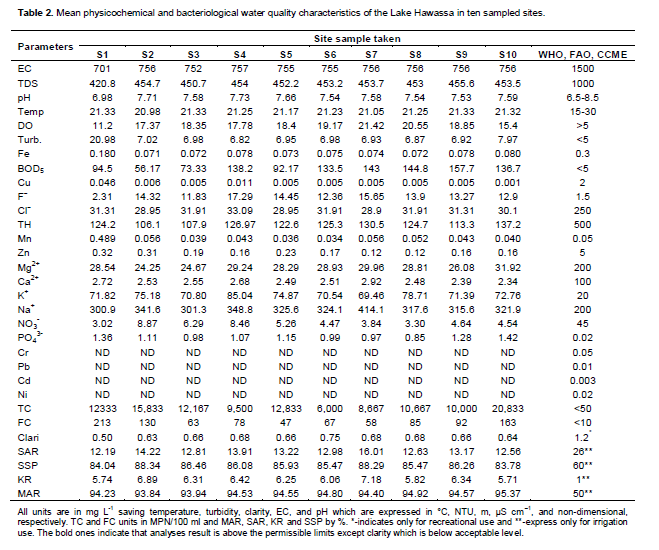
Among analyzed water quality parameters reports which above the recommended limits for drinking water use were turbidity, BOD5, Mn, fluoride, Na+, K+, PO43-, total coliform and fecal coliform; for irrigation uses MAR, KR, SPP, and others common to drinking water use; for recreational uses clarity, turbidity, TC and FC as well as for aquatic life sustenance Mn, Cu and Zn (Table 2) were the main constraining parameters which were above the recommended limits of WHO, EEPA, CCME,USEPA and FAO guidelines for designated water uses.
pH and turbidity
The determination of pH of the water is very important since it affects the solubility and availability of micronutrients like Zn, Mn, Fe and Cu and how they can be utilized by aquatic organisms and also reduces the performance of water treatment systems and disinfectants in water supply. The pH of the lake water ranged from 6.98 to 7.71 with an average value of 7.54. The value of pH decreased in the lake in comparison to the former research done by Alemayehu (2008), 8.5 and Elizabeth et al. (1994), 8.8. This may reveal the increment of organic matter load to the lake ecosystem as decomposition of organic matter leads to decrease in pH, acidity (WHO, 1984).
Nevertheless, with reference to pH value it is within the permissible limit (6.5-9.0) for drinking, irrigation, recreation and aquatic life (WHO, 2006; CCME, 2001; EEPA, 2003). The consumption of more turbid water may constitute a health risk as excessive turbidity can protect pathogenic microorganisms from the effect of disinfectants, and stimulate the growth of bacteria (Zvikomborero, 2005). The turbidity of the lake water was found to be higher than the prescribed limits (<5NTU) for drinking and recreation purposes (Table 2) (WHO, 1993; CCME, 1999).
BOD5
BOD is a measure of the amount of oxygen that bacteria will consume while decomposing organic matter under aerobic conditions (Tenagne, 2009). Unpolluted, natural waters should have a BOD5 of 5 mg/L or less but on this study the lake water BOD5 value is on average 117 mg/L. The elevated values of BOD5 in the lake may show the high level of pollution and it is concentration is beyond the permissible limits of EPA guideline (<5 mg/L) for aquatic, drinking and recreation use (Table 2) (USEPA, 2000).
Na+ and K+
The concentration of Na+ ion ranged from 300.95 to 414.11 mg/L with an average value of 331.14 mg/L which is higher than the permissible limits (200 mg/L) for drinking and irrigation water use (WHO, 1983, 2006). The consumption of eminent Na+ ion in drinking water leads to hypertension, congenial heart diseases and kidney problems (Singh et al., 2008) where as in irrigation water it may cause crusting, plugging, soil dispersion and sealing of surface pores (FAO, 1985) which leads to infiltration problem and structural instability of the soil. The dominance of Na+ ion over other major cations could be attributed due to weathering of acidic rocks (Alemayehu, 2008) (Table 2). In all sampled sites the value of K+ was beyond the permissible limits for drinking and irrigation water use (WHO, 1984). An elevation of potassium in the lake indicates the effect of hospital effluents, septic system effluents, and other anthropogenic activities beside the natural sources.
Fluoride
The most prominent sources of fluoride in water are a natural weathering of mineral bed rocks (WHO, 2004) and it is a common problem mainly in the Rift Valley lakes of eastern African countries (Tamiru, 2006) due to geological factor. In the present investigation the concentration of fluoride ranged from 2.31 to 17.29 mg/L with an average value of 12.83 mg/L. Drinking water with high fluoride concentration above the permissible limit (1.5 mg/L) may causes dental fluorosis and if continuously consumed for a long period with the concentration 3 to 6 mg/L and above may lead to skeletal fluorosis and skeletal crippling (Kloos and Redda, 1999). The lake water fluoride concentration is twelve times higher than the permissible limits for drinking, irrigation and livestock watering purposes (CCME, 1999; WHO, 1998, 2006) and hence not suitable for these designated purposes.
Nutrients
The most known principal limiting nutrients in freshwater lakes of Rift Valley lakes are nitrogen and phosphorus. Nitrogen can exist in water in four forms like NH3, NO3-, NO2- and NH4+ which may cause groundwater and surface water pollution in excessive quantity through leaching, stimulate algal growth in surface water that increases maintenance costs in irrigation practices, carcinogenic and blue-baby diseases in infants of human being. But currently the concentration of NO3- in Lake Hawassa is within the permissible limit (WHO, 2006; Ayers and Westcot, 1985) for drinking and irrigation. However, the concentration of phosphate is higher than the recommended limits (0.005-0.02 mg/L) to freshwater healthy ecosystem (USEPA, 2000) (Table 2) and hence, the lake is categorized in eutrophic state index as Carlson (1977). However, according to Chapman (1996) the nutrients levels in lake water show great impairment of the lake ecosystem by point and non-point sources of pollution. Nitrite and nitrate should be less than 0.001 and 0.1 mg/l for conducive aquatic life (Murdoch et al., 2001) but lake water has high nutrient contents which depart more from natural desirable levels.
Total coliform and fecal coliform
The concentration of total coliform and fecal coliform in the lake were higher than the recommended limits for drinking water (WHO, 2006) and EU (1998), less than 50 and 10 MPN/100 ml, respectively. Irrigation water requires safe water for production of horticultural crops like vegetables and fruits to prevent transmission of diseases causing pathogens (bacteria, viruses and protozoa). Bacterial diseases such as cholera, typhoid fever, gastroenteritis and salmonellolis may happen when the concentration of total coliform in irrigation water becomes above 1000 MPN/100 ml (WHO, 1983; CCME, 1999). Recreational water quality is highly dependent on bacteriological quantities for direct or indirect recreation. However, the lake has high total and fecal coliform which is above the permissible limits of WHO (1989) and CCME (1999), <500 MPN/100 ml and it impedes the suitability for the required intention (Table 2). In general, the lake water is not suitable for drinking, irrigation, and recreation as well as fin fishes harvesting purposes basically based on bacteriological (TC and FC) concentrations.
Heavy metals
Trace levels of dissolved metals in surface water are essential for proper biological functioning in both plants and animals (CCME, 2009). Generally, the concentration of heavy metals in the lake was relatively high at the Inlet of Tikurwuha River due to point sources of pollution from Hawassa textile factory and other factories which discharge their waste directly into this river. However, except Mn, Cu and Zn other metals such as Cd, Cr, Pb and Ni (Table 2) are within the permissible limits to all designated water uses (CCME, 2009; EU, 1998; WHO, 1998). The level of Mn concentration is higher for drinking uses in three sites and for irrigation and aquatic life in one site (S1) while Cu and Zn content were above the recommended limits to only aquatic life (CCME, 1999; WHO, 1983; USEPA, 2000).
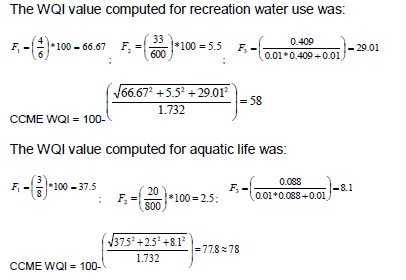
Water quality index (WQI) calculation
The WQI was computed based on the three parameters
Based on the above separate water quality index computation for the designated water uses, the index for drinking (CCME WQI = 49) and recreational (CCME WQI = 58) purposes falls in marginal category, whereas the index for irrigation (CCME WQI = 70) and aquatic life (CCME WQI = 78) uses falls within fair category. The overall or cumulative CCME WQI of the Lake Hawassa is 49 and hence it is under marginal category. According to the CCME ranking this water quality is frequently threatened or impaired and its condition often exceeds natural or desirable levels (CCME, 2001). So, mitigation measures should be developed in watershed overall activities, that is, for point and non-point sources of pollutions.
CONCLUSIONS AND RECOMMENDATION
The current study evaluated the physicochemical and bacteriological water quality characteristics of Lake Hawassa for multiple designated water uses like drinking, irrigation, recreation and aquatic life. The parameters of water quality analyzed and examined from various sampling sites in the lake show unsuitability of the water for drinking and recreational uses; but with some great care it is fair for irrigation and aquatic life. Based on the calculated cumulative water quality index it is ranked under marginal category of CCME WQI 49 which indicates the lake water is frequently threatened and impaired for those designated water uses.
Water quality of the lake was highly impaired on the town side of Hawassa that’s due to inlets of various factories effluents like Hawassa textile factory, sisal factory, soft drink factory, ceramic factory and sewage as well as regional Hawassa referral hospital effluents. The lake is affected by both point and non-point sources of pollution beside the natural factors. Hence checking the effluent standards of the surrounding factories, controlling the service rendering center waste disposal system and constructing the municipal wastewater and storm water treatment plant are extremely essential to protect the lake water quality from further deterioration.
The authors have not declared any conflict of interest.
REFERENCES
|
Abayneh A, Taddese W, Chandravanshi BS (2003). Trace metals in selected fish species from Lake Awassa and Ziway. SINET:Ethiopia J. Sci. 26(26):103-114. |
|
|
|
Alemayehu T (2008). Environment resources and recent impacts in the Hawassa collapsed caldera. Main Ethiopian Rift. Q. Int. 189:152-162. |
|
|
|
APHA (American Public Health Association) (1995). Standard methods for the examination of water and waste water. 19th Ed. Washington DC, USA. |
|
|
|
APHA, AWWA and WPCF (1998). Standard Methods for the Examination of Water and Waste-water 18th Ed . Washington, U.S.A. pp. 2-27, 4-108, 4-117, 4-131, 10-26. |
|
|
|
Arkady MD, Brook A (2008). Water Balance and Level of regime of Ethiopian Lakes as Integral Indicators of Climate Change. Faculty of Hydrology, Russian State Hydrometeorology University, Saint Petersburg, Russia. |
|
|
Arnell NW, Livermore MJL, Kovats SP, Levy E, Nicholls R, Parry ML, Gaffin SR (2004). Climate and socio-economic scenarios for global-scale climate change impacts assessments: Characterising the SRES storylines. Global Environ. Change 14:3-20.
Crossref |
|
|
|
Ayers RS, Westcot DW (1985). Water quality for agriculture. FAO Irrigation and Drainage, paper No. 29(1):1-109. |
|
|
Carlson RE (1977). A Trophic State Index for Lakes. Limnol. Oceanogr. 22(2):361-369
Crossref |
|
|
|
CCME (Canadian Council of Ministers of the Environment) (1995).Protocol for the derivation of Canadian sediment quality guidelinesfor the protection of aquatic life. CCME EPC-98E. Prepared by Environment Canada, Guidelines Division, Technical Secretariat of the CCME Task Group on Water Quality Guidelines, Ottawa.[Reprinted in Canadian environmental quality guidelines, Canadian Council of Ministers of the Environment, 1999, Winnipeg.] |
|
|
|
CCME (1999). Canadian water quality guidelines for the protection of aquatic life: Dissolved oxygen (freshwater). In: Canadian environmental quality guidelines, 1999, Canadian Council of Ministers of the Environment, Winnipeg. |
|
|
|
CCME (2001).Canadian Water Quality Index 1.0 Technical report and user's manual. Canadian Environmental Quality Guidelines Water Quality Index Technical Subcommittee, Gatineau, QC, Canada. |
|
|
|
CCME (2009). Guidelines for Canadian recreational water quality. Prepared by the Federal-Provincial-Territorial Working Group on Recreational Water Quality of the Federal- Provincial-Territorial Committee on Health and the Environment. |
|
|
Chapman D (1996). "Water Quality Assessments: A Guide to the Use of Biota, Sediments and Water." Environmental Monitoring. Second Edition. UNESCO, WHO, and UNEP. E&FN Spon, London UK.
Crossref |
|
|
|
Colin F, Quevauviller P (1998). Monitoring of water quality. The contribution of Advanced Technology. Elsever Ltd. |
|
|
|
Demeke A (1989). Study on the age growth of adult Oreochromis niloticus in Lake Awassa, Ethiopia. M.Sc. Thesis, School of Graduate Studies, Addis Ababa University. |
|
|
|
DEQ (2003). The Oregon Department of Environmental Quality.
View
|
|
|
|
EEPA (Ethioian Environmental protection Authority) (2003). Guideline Ambient Environment Standards for Ethiopia. Prepared by EPA and UNIDO under ESDI project US/ETH/99/068/Ethiopia. Addis Ababa. |
|
|
|
Elias D (2000). Reproductive biology and feeding habits of the cat fish Clarias garipinus (burchell) in Lake Awassa, Ethiopia. SINET: Ethiopia J. Science. 23:2. |
|
|
|
Elizabeth K, Zinabu G, Ahgren H (1994). The Ethiopian Rift Valley lakes Chemical Characteristics of a Salinity Alkalinity series. Kluver Academic Publishers, Belgium. Hydrobiologica (1994) 288: 1-12 |
|
|
|
EU (European Union) (1998). Council Directive 98y83yEC of 3 November 1998 on the quality of water intended for human consumption. Official J. European Comm. p.L330y32 –L330y54. |
|
|
|
FAO (1985). Water quality for agriculture, by R.S. Ayers & D.W. Westcot. Irrigation and Drainage Paper No. 29 (Rev. 1). Rome. |
|
|
|
Girma T, Ahlgren G (2009). Seasonal variations in phytoplankton biomass and primary production in the Ethiopian Rift Valley Lakes Ziway, Awassa and Chamo-The basis for fish production. Elsevier Sc. Limnologica 40(2010)330-342. |
|
|
|
Gugissa E (2004). Urban Environmental impacts in the town of Awassa Ethiopia, Addis Ababa University, Unpublished MSc Thesis Addis Ababa University, Ethiopia. |
|
|
|
Halcrow G (2010). Rift valley lakes basin integrated resources development plan study project. Lake Hawassa sub-basin integrated watershed management feasibility study. Main report Vol.1. |
|
|
Kelly WP (1963). Use of saline irrigation water. Soil Sci., 95(4):355-391
Crossref |
|
|
Kloos H, Redda T (1999). Distribution of fluoride and fluorosis in Ethiopia and prospects for control. Trop. Med. Int. Health 4:355-364.
Crossref |
|
|
|
Milda L (2009). The environmental impact caused by the increasing demand for water. Water and resources management-a case study in Ethiopia. MSc thesis. TAMK University of Applied Sciences Environmental Engineering, Tampere. |
|
|
|
Murdoch T, Cheo M, OLaughlin K (2001). Streamkeeper's Field Guide: Watershed Inventory and Stream Monitoring Methods. |
|
|
|
Oki T, Agata Y, Kanae S, Saruhashi T, Musiake K (2003). Global water resources assessment under climatic change in 2050 using TRIP.IAHS Publ., 280:124–133. |
|
|
|
Puri PJ, Yenkie MKN, Songal SP, Gandhore NV, Sarote GB, Dhanorkar DB (2011). Surface water (lakes) quality assessment in Nagpur City (India) based on water quality index (WQI). RASAYAN J. Chem. 4:43-48. |
|
|
|
Raghunath IM (1987). Groundwater. 2nd Edn., Wiley Eastern Ltd., New Delhi, India. |
|
|
|
Richards LA (1954). Diagnosis and improvement of saline and alkali solids, Agric. Handbook 60, U.S. Dept. Agric., Washington, D.C., P. 160. |
|
|
Singh AK, Mondal GC, Suresh K, Singh TB, Tewary BK, Sinha A(2008). "Major ion chemistry, weathering processes and water quality assessment in upper catchment of Damodar River basin, India", Environ. Geol. 54:745-758.
Crossref |
|
|
|
Smith DG (1987). "Water Quality Indexes for Use in New Zealand's Rivers and Streams", Water Quality Centre Publication No. 12, Water Quality Centre, Ministry of Works and Development, Hamilton, New Zealand. |
|
|
|
Tamiru A (2006). Groundwater occurrence in Ethiopia. Addis ababa University, Ethiopia. With the support of UNESCO. |
|
|
|
Tenagne A (2009). The impact of urban storm water runoff and Domestic waste effluent on water quality of Lake Tana and Local ground water near the city of Bahirdar, Ethiopia. |
|
|
|
Tenalem A (1998). The hydrological system of the Lake District basin, Central Main Ethiopian Rift. PhD thesis. International Institute for Geographic Information Science and Earth Obseration(ITC), Enschede. |
|
|
|
Todd D (1980). Groundwater Hydrology. 2nd Edn. John Wiley and Sons. New York. |
|
|
|
USEPA (U.S. Environmental Protection Agency) (2000). Nutrient Criteria Technical Guidance Manual: Rivers and Streams. United States Environmental Protection Agency, Office of Science and Technology. Washington, DC. EPA-822-B-00-002. |
|
|
Vorosmarty CJ, Green P, Salisbury J, Lammers RB (2000). Global water resources: vulnerability from climate change and population growth. Science 289:284-288.
Crossref |
|
|
|
Warhate SR, Wankar KG (2012). The evaluation of water quality index around Welkorela-Pimperi coal mines. Sci. Rev. Chem. Commun. 2(3):197-200. |
|
|
|
WHO (2006). Guidelines for safe recreational water environments, Swimming pools and similar environments. Geneva. Vol. 2. |
|
|
|
WHO (2005). Water, Sanitation and Hygiene Programming Guidance Water Supply and Sanitation Collaborative Council and World Health Organization, 2005 Printed in Geneva1219 Chatelaine, Geneva, Switzerland. |
|
|
|
WHO (2004). Guidelines for Drinking Water Quality, Third Edition. Vol. 1: Recommendations. World Health Organization Geneva. |
|
|
|
WHO (1993). Guidelines for Drinking Water Quality. 1st Ed. Geneva. |
|
|
|
WHO (1989). Health Guidelines for the Use of Waste water in Agriculture and Aquaculture. Report of a WHO Scientific Group. Geneva, Switzerland: World Health Organization Press. |
|
|
|
WHO (1984). Guidelines for Drinking-Water Quality,Vol. 2. Health Criteria and Other Supporting Information. Geneva: WHO. |
|
|
|
WHO (1983). Guidelines for Drinking Water Quality, Vol. 3. World Health Organization, Geneva. |
|
|
|
Yemane G (2004). Assessment of the water balance of Lake Awassa catchment, Ethiopia, M.Sc. thesis, International institute for Geo-information Science and Earth Observation (ITC), Enscheda, the Netherlands. |
|
|
|
Yosef HG, Bekele L, Behailu B, Kefyalew S, Wondewosen S (2010). Environmental impact assessment and policy on Lake Hawassa, SNNPRs. SOS-Sahel, Ethiopia. |
|
|
|
Zinabu G, Zerihun D (2002). The chemical compostion of the effluent from Awassa Textile factory and its effects on aquatic biota. SINET: Ethiop. J. Sci. 25(2):263-274. |
|
|
Zvikomborero H (2005). An assessment of the water quality of drinking water in rural districts in Zimbabwe. The case of Gokwe south, Nkayi, Lupane and Mweezi districts. Physics Chemistry Earth 30:859-866.
Crossref |