ABSTRACT
This paper presents the assessment of impact of climate change on the runoff in the Kainji Lake basin. Hydro-meteorological variables within River Niger sub-basin in Nigeria and upstream countries were obtained from Nigerian Meteorological Agency (NIMET), Nigeria Inland Waterways (NIWA) and hydrological unit of Kainji hydropower station. The variables were subjected to regression and standardized anomaly indices (SAIs) analyses. The trend analyses revealed that all the hydro-meteorological variables in the locations exhibit fluctuations of different patterns. Precipitation, evaporation, minimum and maximum temperature depict upward trend, while the runoff and the water level depict downward trend in almost all the selected locations. The downward trends of runoff from upstream gauging stations confirm the continual reduction in the water resources of the River Niger sub-basin and the inflow into Kainji dam over the years, which eventually affect water availability for energy generation and other uses. The multiple regression model for Kainji hydropower station and other downstream stations such as Lokoja, Baro and Idah show that for every 1°C rise in temperature, runoff decreases by 4.45, 534.76, 12.72 and 159.05 m3/s respectively. SAIs also confirms significant decrease in runoff trend for the locations. The results also reveal that changes in climatic variables cause a tremendous fluctuation in runoff. The variation in runoff contributed by temperature, precipitation and evaporation for the stations ranged between 0.22 and 0.45 m3/s.
Key words: Climate variability, impact assessment, runoff, catchment management, Kainji Lake.
Climate change is change in the meteorological parameters such as temperature, precipitation, humidity, wind and seasons. It can be referred to as seasonal change of weather over a long period of time as a result of global warming. It is widely accepted that climate change is already happening and in the last century between 1906 and 2005 the average global temperature rose by about 0.74°C. The Intergovernmental Panel on Climate Change (IPCC) observed that over the past century changes are occurring in the amount of intensity, frequency and types of precipitation globally (IPCC, 2007). It was also revealed that this has occurred in two phases between the period 1910s and 1940s and more strongly from the 1970s to the present (IPCC, 2007). Many studies into the detection and attribution of climate change have found that most of the increase in average global surface temperature over the last 50 years is attributable to human activities (IPCC, 2001). It is estimated that for the 20th century the total global mean sea level has risen between 12 and 22 cm. This rise has been caused by the melting of snow cover and mountain glaciers both of which have declined on average in the northern and southern hemispheres (IPCC, 2007).
It was predicted that climate change will lead to an intensification of the global hydrological cycle and can have major impacts on regional water resources. Changes in the total amount of precipitation and in its frequency and intensity directly affect the magnitude and timing of run-off and the intensity of floods and droughts (Immerzeel, 2008). A change in climate affects the usual timing and intensity of precipitations and temperatures, which in turn affects all other means of livelihood such as agriculture, hydropower generation, domestic and industrial water supply. Climate change can have a profound impact on water resources, agriculture, small and large scale hydroelectric power production. Therefore water managers must be aware of potential impacts of climate change on their river system (Robert, 2008).
The developing nations of Africa, Asia and South America are seriously affected by climate change, therefore there is need to adapt necessary measures to mitigate climate change impact on water resources (Madueme, 1999). Salami et al. (2011) carried out study on the impact of global warming on the rainfall and temperature for some selected cities in the Niger Delta of Nigeria using nonparametric Man-Kendall test to detect monotonic trends and the Sen’s slope estimator to develop models for the variables. The study reveals that there is evidence of global warming in Owerri and rainfall has significantly increased in Calabar over the years. Though the trends in rainfall of Owerri and Port-Harcourt were not significant, plots of the developed models reveal a positive trend in the rainfall of the stations.
McBean and Motiee (2008) assessed the impact of climate change on the water resources of North America. Seventy years of historical trends in precipitation, temperature and stream flows in the Great Lakes of North America were developed using long term regression analyses and Mann-Kendall statistics. MINITAB and Microsoft Excel were used to calculate the trend lines, statistical values and plot the figures. The result obtained demonstrated statistically significant increases in some precipitation and stream flows over the period 1930-2000. Odjugo (2011) carried out study on climate change and global warming in some selected locations in Nigeria using climatic data and statistical tools. The results showed that while temperature in Nigeria is increasing, the rainfall is generally decreasing. Odjugo (2010) studied regional evidence of climate change in Nigeria using Mean annual air temperature from 30 synoptic stations between 1901 and 2005. Statistical tools were used to analyze the data. The results showed that air temperature is steadily increasing.
Various statistical analysis such as Mann-Kendall, Sen Slope, reduction method, standardized anomaly indices (SAIs), simple and multiple regression analysis (MRA) have been used to assess fluctuations and trends analysis of hydro-meteorological variables in order to establish the impact of climate change on runoff. SAIs and MRA have been established to produce a good result in the assessment of fluctuation, trend and linear modeling of climate change impact on runoff (Ojoye, 2012). Selections of these methods become imperative due their effectiveness in assessing climate change impact.
Impact of climate change on River Niger is a very crucial issue due to its importance to countries in which it flows through. Olomoda (2011) indicated that since the past five decades, the Niger basin has been affected by series of climatic changes causing extreme low flows along the river. For example in June 1985 River Niger was completely dry at Niamey, Niger republic. This phenomenon was almost repeated in June 2002 when the flow recorded fell among the lowest in 50 years. The Niger basin theoretical area of about 2 million km2 has also been reduced to an active catchment area of about 1,500,000 km2. Ojoye (2012) stated that study had shown that impact of climate change was noticed in River Niger when the annual yield of the River at Kainji reservoir had steadily decrease from 46 × 109 m3 in 1970 to 26 × 109 m3 at the peak of 1973 drought. Also there has been drastic reduction in electricity generation at Kainji hydropower station over the year and this may be due to shortage of water in the reservoir among other factors. It is imperative to assess the impact of climate variability on runoff in the Kainji Lake using statistical tools like standardized anomaly indices (SAIs) and regression analysis.
Description of the study area
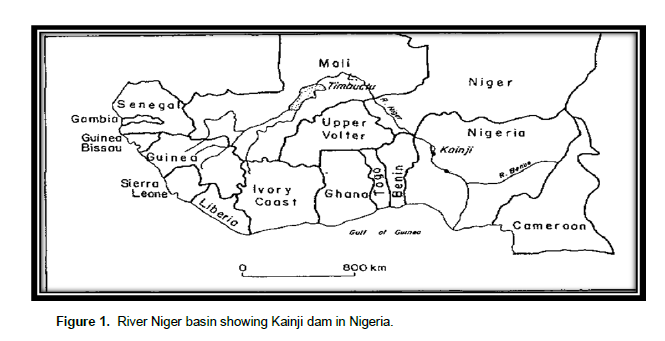
River Niger has total length of about 4,200 km and is the 3rd longest river in Africa and the 9th world largest river basin. It has original catchment area of about 2 million Km2 covering 10 Countries namely Algeria, Benin Republic, Burkina Faso, Cameroon, Chad, Ivory Coast, Guinea, Mali, Niger and Nigeria as shown in Figure 1. The river is the source of water for over 100 million people and is also the major sources of hydropower to most of the countries in its basin. Two out of the three hydropower stations in Nigeria were built on the river namely: Kainji and Jebba hydropower stations. The third is Shiroro hydropower station that was built on river Kaduna which is also a tributary of River Niger. Nigeria is the downstream country through which the River Niger flows and contains 28.3 percent (424,500 km2) of the basin area (Andersen et al., 2005). Niger basin extends across 20 of the 36 states of Nigeria and comprises two main rivers: Niger and Benue with 20 tributaries. More than half of the major rivers in Nigeria are in the Niger River Basin and almost 60% of Nigeria’s population live in the basin. Kainji hydroelectric power station is located in New Bussa, Borgu local government area of Niger State. River Niger is divided into upper Niger, middle Niger and lower Niger. Kainji dam is located on the lower Niger and was built between 1964 and 1968. It is being fed by many tributaries such as Malando, Danzaki and Sokoto-Rima Rivers. The reservoir is located on latitude 9° 51?45?? N and longitude 4° 36?48?? E. The operation of hydroelectric power was commenced in 1969. The length of the Kainji Lake is 136 km, width of 24 km and maximum head elevation of 141.73 m and maximum tail elevation of 104 m.
Data collection
The data required for this study are hydro-meteorological data spanning for a period of 30 to 50 years. The meteorological data include precipitation, evaporation, minimum and maximum temperature, while the hydrological data are the runoff and water level.
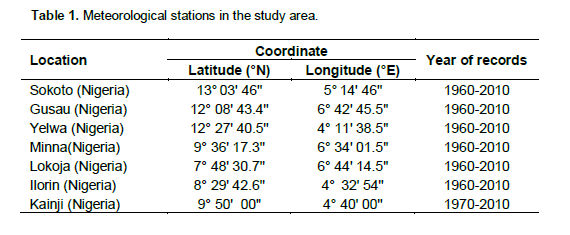
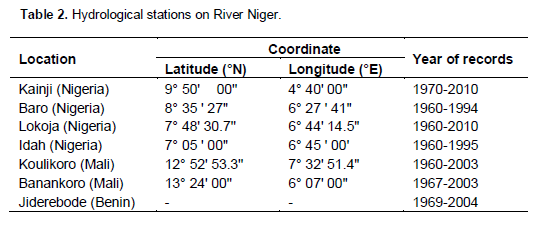
The required meteorological data were obtained from Nigerian Meteorological Agency (NIMET) Oshodi, Lagos State and meteorological unit of Kainji hydropower station. The hydrological data such as runoff and water level for River Niger at various gauge stations were obtained from the National Inland Waterways Agency (NIWA) in Lokoja, Kogi State and hydrological unit of Kainji hydropower station. The available hydrological data was collected for some selected gauge stations on the river such as: Idah, Baro, Lokoja, Kainji and Koulikoro, Bamanko (Mali) and Jiderebode (Benin Republic) at upstream countries. The data for upstream countries are available at Kainji hydropower, Nigeria. In this study the stations shown in Table 1 were used as data sampling points for the meteorological data, while Table 2 shows the selected gauge stations for the hydrological data on the River Niger.
Data analysis
All the parameters were subjected to trend and fluctuation analysis using Standardized Anomaly Index (SAI) and Regression Analysis.
Multiple regression models
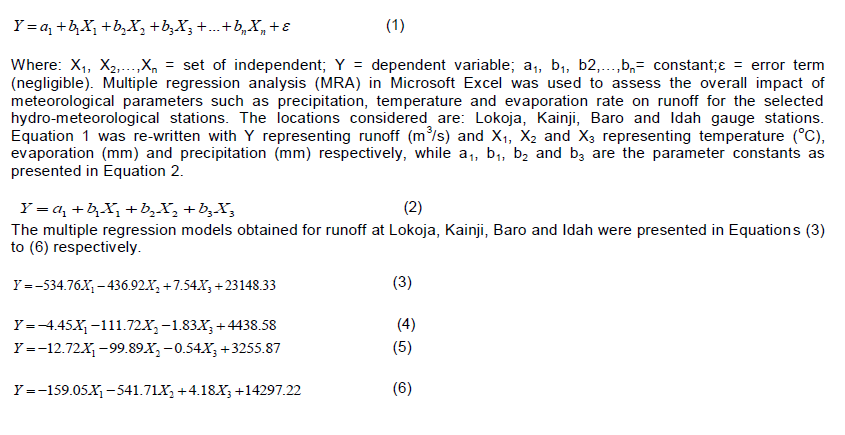
Multiple regression model is a statistical tool for modeling variables with one independent and two or more dependent variables. It can be used to model the impact of climate change on river hydrology (Xia, 2011). Equation (1) is a multiple regression model that was used to assess the effect of climate change on river runoff. Ojoye (2012) used multiple regression model to assess the overall impact of meteorological parameters such as precipitation, temperature and evaporation on the runoff in some selected locations in Sudano-Sahelian ecological zone of Nigeria.
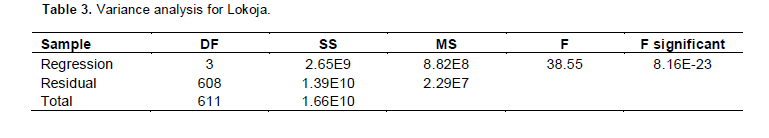
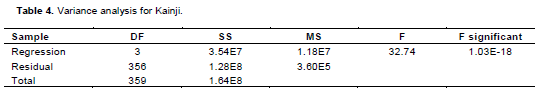
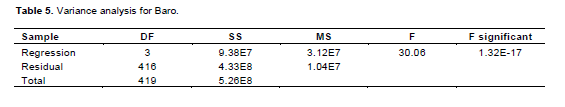
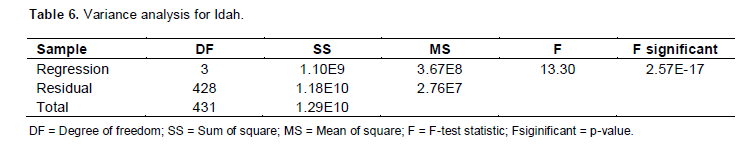
Microsoft excel output also gave the variance analysis (ANOVA) as presented in Tables 3 to 6 for Lokoja, Kainji, Baro and Idah multiple regression model respectively.
Standardized anomaly index (SAI)
Standardized anomaly index (SAI) was used to depict the fluctuation exhibited by the hydro-meteorological parameters. SAI was first used by Kraus (1977) to provide a synthesis of the average area behavior of precipitation at a specified time. The index was found to be effective for rainfall variability in the Niger basin area (Babatolu, 1998). SAI was used to test for the fluctuation of hydro-meteorological parameters in the study of climate change impact on water resources and adaptation strategies in the Sudano-Sahelian Ecological Zone (SSEZ) of Nigeria (Ojoye, 2012). SAI was used to investigate the annual precipitation trends in homogeneous precipitation of sub-divisions of Western Iran in order to assess the variability during the last thirty-five years (Raziel, 2008). Liu et al. (2011) analyzed past and predicted future drought with comprehensive drought indices for Arkansas-Red river basin. Historical climate data from 1900-2009 was analysed.
The results from the SPI and PDSI showed that widespread drought took place in the 1910s, 1930s, 1950s and 1960s, which agreed with the historical climate record. Rimkus et al. (2013) study the dynamics of meteorological and hydrological droughts in the Neman river basin, Lithuania using standardized anomaly index. Meteorological and hydrological warm period droughts were analyzed in this study. Meteorological droughts were identified using the standardized precipitation index (SPI) and hydrological droughts using the streamflow drought index (SDI). The whole river basin was analyzed over the period from 1961 to 2010. It was found that the total dryness area has decreased over the last 50 years. A statistically significant increase in standardized precipitation index values was observed in some river sub-basins. An analysis of drought recurrence dynamics showed that there was no indication that the number of dangerous drought was increased.
Gebrehiwot and van der Veen (2013) assessed the evidence of climate variability in the northern part of Ethiopia. This study attempts to investigate the temporal and spatial variability of climate parameters such as precipitation and temperature for the period 1954-2008. Standardized precipitation anomaly was used to examine the temporal characteristics of climate variability and determine the prevalence of droughts. Analysis of variance was also employed to establish significant differences in rainfall characteristics amongst different in-situ stations. The temporal analysis indicated an overall slight decrease in precipitation and an overall increase in the mean annual minimum and maximum temperatures over the study period. This showed that the northern part of Ethiopia is warming faster than the national average of 0.25°C per decade. It was also observed that the average annual minimum temperature is increasing faster than average annual maximum temperature, which is an indication of warming nights over the years.
Marinela and Irina (2012) used standardized precipitation anomaly (SPA) to assessed variability of precipitation and liquid flow in the Desn??ui, Romania. Monthly hydro-meteorological data from 1965-2009 was used in this study. The results revealed that the annual rainfall variability analysis showed the existence of some cyclical with positive values of SPA in the first period analyzed, negative in the second half and again positive in the last part. Ekwe et al. (2014) studied the monthly and annual rainfall trends in Nasarawa State, Nigeria. Monthly rainfall data for the State for 20 years (1993-2012) was used in the study. Time series analysis, standardized anomaly index and linear regression analysis were employed in this study to illustrate the rainfall trend and seasonal variation. The results revealed that there was a slight high value of mean annual rainfall recorded in 1996 while least value was obtained in 2008. The anomalous departures from the mean were observed to be very small with the highest positive departure from the mean of approximately 12% in 1996. The standardized anomaly results showed a fluctuating rainfall pattern across the years over the State.
The SAI can be used for any hydro-meteorological parameters. The name of the index is adopted to suit the parameter under consideration (Ojoye, 2012). Equation (7) presents a typical SAI.The anomaly index for fluctuation analysis with line bar above the reference zero line means that the year has a positive (or surplus) anomaly while those with line bars below the reference zero line means negative (or deficit) anomaly (Valt et al. 2005).
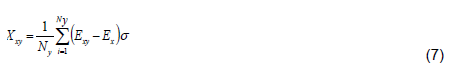
Where: Xxy = parameter for the yth year; Exy = year total parameter; Ex = mean parameter for the base year; σ = standard deviation, and Ny = number of years when data are available.
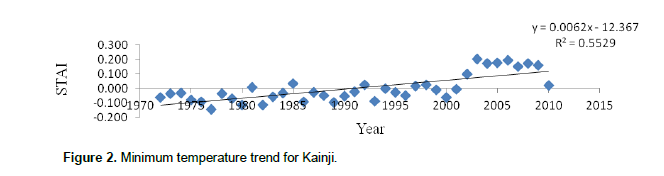
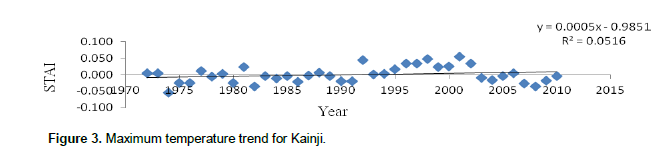
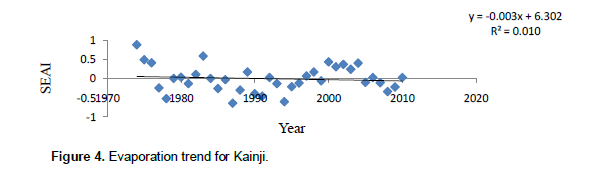
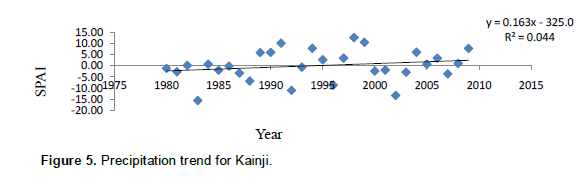
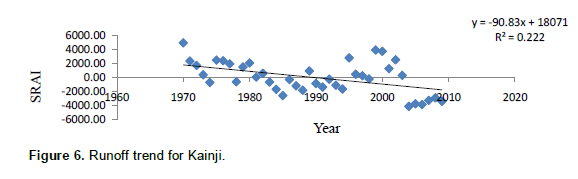
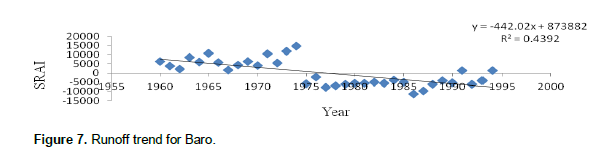
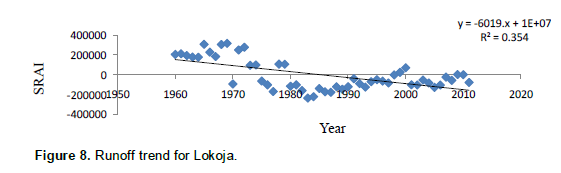
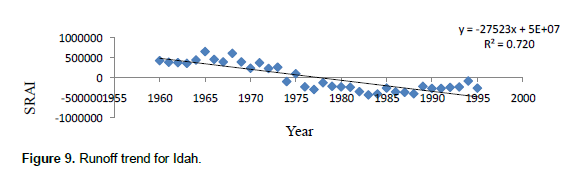
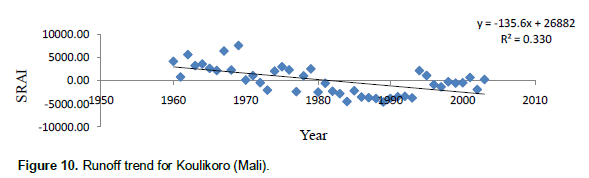
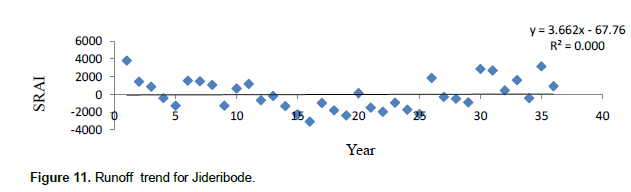
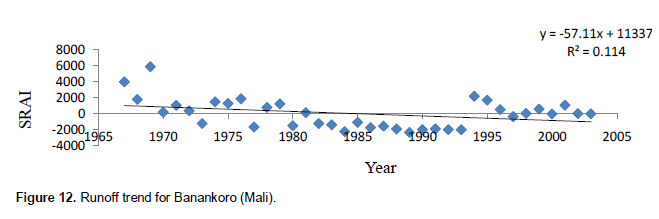
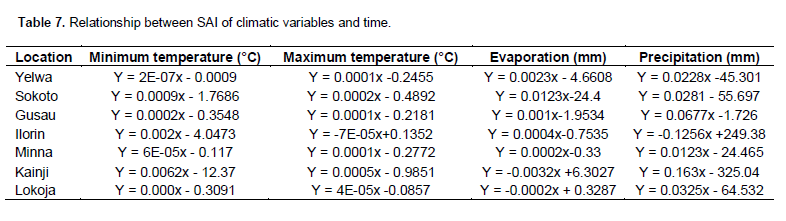
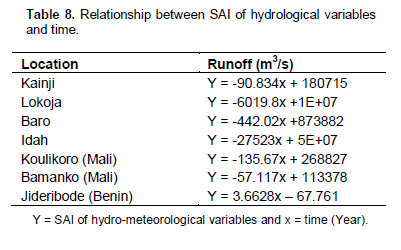
All the hydro-meteorological variables for the selected gauging stations were analyzed by estimating their SAI. The values of SAI obtained were plotted against year as presented in Figures 2 to 12 as an illustration for hydro-meteorological variables at Kainji hydropower station and runoff for upstream and downstream locations of the study area. The Equations expressing the relationship between variables and time (year) are presented in Tables 7 and 8. The variables with positive slope indicate an upward trend, while those with negative slope show a downward trend.
Multiple regression
The multiple regression models for runoff at Lokoja, Kainji Baro and Idah were presented in Equations (3) to (6) respectively and the ANOVA results were presented in Tables 3 to 6 respectively. The multiple regression model for Lokoja indicates -534.76 coefficient of the mean temperature which implies that runoff will decrease by average of 534.76 m3/s per month for 1°C rise in temperature. The coefficient of evaporation is -436.92 showing that runoff will decrease on average by 436.92 m3/s per month for 1 mm rise in evaporation. The coefficient of precipitation is 7.45 implies that runoff will increase by 7.45 m3/s per month for 1 mm rise in precipitation. The model intercept is 23148.33 m3/s indicating estimated average runoff. The coefficient of determination (R2) reveals that 0.16 variation in runoff is contributed by temperature, precipitation and evaporation. The multiple regression model for Kainji shows -4.45 coefficient of the mean temperature thus the runoff will decrease on average by 4.45 m3/s per month for 1°C rise in temperature. The coefficient of the evaporation is -111.72 which reveals that the runoff will decrease on average by 111.72 m3/s per month for 1 mm rise in evaporation. The coefficient of the precipitation is -1.83 revealing that the runoff will decrease by 1.83 m3/s per month for 1 mm rise in precipitation. The model intercept 4438.58 m3/s indicates the estimated average runoff. R2 reveals that 0.22 variations in runoff is explained by temperature, precipitation and evaporation.
The multiple regression model for Baro indicates -12.72 coefficient of the mean temperature which shows that the runoff will decrease on average by 12.72 m3/s per month for 1°C rise in temperature. The coefficient of the evaporation is -99.89 revealing that the runoff will decrease on average by 99.89m3/s per month for 1 mm rise in evaporation. The coefficient of the precipitation is -0.54 which shows that the runoff will decrease by 0.54 m3/s per month for 1mm rise in precipitation. The model intercept is 3255.87 m3/s and the estimated average runoff. R2 shows that 0.18 variations in runoff is contributed by temperature, precipitation and evaporation. The multiple regression model for Idah indicates -159.05 coefficient of the mean temperature which means that the runoff will decrease on average by 159.05 m3/s per month for 1°C rise in temperature. The coefficient of the evaporation is -541.71 meaning that the runoff will decrease on average by 541.71 m3/s per month for 1 mm rise in evaporation. The coefficient of the precipitation is 4.18 revealing that the runoff will increase by 4.18 m3/s per month for 1mm rise in precipitation. The model intercept is 3255.87 m3/s implies the estimated average runoff. R2 shows that 0.08 variations in runoff is explained by temperature, precipitation and evaporation.
The ANOVA test from the multiple regression analysis shows p-value of 8.16E-23, 1.03E-18, 1.32E-17 and 2.57E-17 for Lokoja, Kainji, Baro and Idah stations respectively. These values are all less than 0.05 at 95% significant level. The null hypothesis is rejected while accepting the alternative hypothesis and hence concluded that all the independent variables affect the runoff.
Trends in hydro-meteorological parameters
Minimum and maximum temperature
The minimum temperature at Yelwa has a positive trend with negligible coefficient of determination (R2). Sokoto, Gusau, Ilorin, Minna, Lokoja and Kainji stations show positive trend with R2 of 0.68, 0.09, 0.07, 0.054, 0.016 and 0.55 respectively. The maximum temperature at Yelwa, Sokoto, Gusau, Minna, Lokoja and Kainji stations show positive trend with R2 of 0.018, 0.32, 0.1, 0.28, 0.01 and 0.05 respectively. The maximum temperature at Ilorin station shows a negative trend and R2 of 0.07. There is an indication of upward trend in temperature in most of the stations.
Evaporation
The evaporation at Yelwa, Sokoto, Gusau, Ilorin and Minna stations show a positive trend with R2 of 0.26, 0.16, 0.56, 0.15 and 0.018 respectively. The evaporation at Lokoja and Kainji stations reveal positive trend with R2 of 0.09 and 0.01 respectively.
Precipitation
The precipitation at Yelwa, Sokoto, Gusau, Minna, Lokoja and Kainji stations reveal low positive trend with R2 of 0.005, 0.02, 0.04, 0.002, 0.005 and 0.04 respectively. Ilorin station has low negative trend with R2 of 0.035. Low positive trend in most of the selected locations indicates reduction in precipitation and seasonal variation in quantity of water available in the Kainji Lake basin which subsequently affected hydropower generation at the Kainji hydropower station among other factors.
Runoff
The runoff at Lokoja, Baro, Idah, Kainji, Koulikoro and Banankoro stations show negative trend with R2 of 0.35, 0.44, 0.72, 0.22, 0.33 and 0.11 respectively. Jideribode station shows a low positive trend with negligible R2 value. This implies that the variation in runoff contributed by temperature, precipitation and evaporation ranges between 0.22 and 0.45.
The hydro-meteorological parameters within Kainji Lake basin and upstream countries along River Niger were analyzed. The parameters were subjected to MRA and SAIs. The precipitation, evaporation and temperature show an increasing trend, while the runoff shows a decreasing trend in almost all the selected locations. The hydro-meteorological variables in all the locations exhibited fluctuations of different patterns. The multiple regression model for Kainji hydropower station and other downstream stations such as Lokoja, Baro and Idah show that for every 1°C rise in temperature, runoff decreases by 4.45, 534.76, 12.72 and 159.05 m3/s respectively. SAI also indicates a significant decrease in runoff for the locations. The results reveal that changes in climatic variables cause a tremendous fluctuation in runoff. The variation in runoff contributed by temperature, precipitation and evaporation for the stations ranged between 0.22 and 0.45. In conclusion, the downward trends in runoff indicate a continual reduction in the water resources of the reservoir and eventually affect water availability for hydropower generation at Kainji station.
The authors have not declared any conflict of interest.
The authors would like to thank the management of Kainji hydropower station, New Bussa, National Inland Waterways Agency (NIWA), Lokoja and Nigerian Meteorological Agency (NIMET) Oshodi, Lagos for providing the data used in this study. The authors would also like to thank the Department of Civil Engineering and National Centre for Hydropower Research and Development (NACHRED), University of Ilorin for providing technical support.
REFERENCES
|
Andersen I, Dione O, Jarosewich-Holder M, Olivry J (2005). The Niger River Basin: A Vision for Sustainable Management. Edited by Golitzen, K.G. |
|
|
|
Babatolu JS (1998). Climate change and its implications for water supply in the Niger River Basin Development Authority Area of Nigeria. A P.hD Thesis, Department of Geography and Environmental Management, University of Ilorin, Ilorin, Nigeria. |
|
|
Ekwe MC, Joshua JK, Igwe JE, Osinowo AA (2014). Mathematical Study of Monthly and Annual Rainfall Trends in Nasarawa State, Nigeria. IOSR J. Math. 10(1):56-62.
Crossref |
|
|
Gebrehiwot T, van der Veen A (2013) Assessing the evidence of climate variability in the Northern Part of Ethiopia. J. Dev. Agric. Econ. 5(3):104-119.
Crossref |
|
|
Immerzeel W (2008) Historical trends and future predictions of climate variability in the Brahmaputra Basin. Int. J. Climatology 28:243-254.
Crossref |
|
|
|
IPCC (2001). Climate Change: The Scientific Basis. Technical Summary of the Working Group I Report [Houghton, J.T., Y. Ding, D.J. Griggs, M.Noguer, P.J. van der Linden, X. Dai, K. Maskell, and C.A. Johnson (eds.)]. CambridgeUniversity Press, Cambridge, United Kingdom and New York, NY, USA, pp. 94. |
|
|
|
IPCC (2007). Fourth Assessment Report: Climate Change 2007: Climate Change Impacts, Adaptation and Vulnerability. Summary for Policy Makers. |
|
|
Kraus EB (1997). Subtropical Droughts and cross-equatorial energy transports Mon. Wea. Rev. 105:1009-1018.
Crossref |
|
|
|
Liu L, Hong Y, Hocker JE (2011) Analyzing past and predicting future drought with comprehensive drought indices for Arkansas-Red River Basin, Symposium on Data-Driven Approaches to Droughts. Purdue University. pp. 1-7. |
|
|
|
Madueme TC (1999). The Need for Long Term Studies on Regional Climate Change to Ensure Adequate Electric Power Production. Global Climate Change. |
|
|
|
Marinela CA, Irina O (2012). Variability of precipitation and liquid flow in the Desnăţui Hydrographical Basin. Water resources and wetlands Conference Proceedings. pp. 367-371. |
|
|
McBean E, Motiee H (2008). Assessment of impact of climate change on water resources: A Long Term Analysis of the Great Lakes of North America. Hydrology Earth Syst. Sci. 12:239-255.
Crossref |
|
|
|
Ojoye S (2012). Climate Change Impact on Water Resources and Adaptation Strategies in the Sudano-Sahelian Ecological Zone of Nigeria. A Ph.D Thesis, Department of Geography and Environmental Management, University of Ilorin, Ilorin, Nigeria. |
|
|
|
Odjugo PAO (2011). Climate Change and Global Warming: the Nigerian Perspective. J. Sustainable Dev.Environ. Protect. 1(1):6-17. |
|
|
|
Odjugo PAO (2010). Regional evidence of climate change in Nigeria. J. Geography Regional Planning 3(6):142-150. |
|
|
|
Olomoda IA (2011). Impact of Climatic Change on River Niger Hydrology. Water Resources Development, Niger Basin Authority Niamey, Niger Republic. pp. 1-9. |
|
|
|
Raziel T (2008). Investigation of Annual Precipitation Trends in Homogeneous Precipitation Sub-Divisions of Western Iran. BALWOIS Ohrid, Macedonia Republic. pp. 1-7. |
|
|
Rimkus E, Stonevicius E, Korneev V, Kažys J, Valiuškevicius G, Pakhomau A (2013). Dynamics of meteorological and hydrological droughts in the Neman River Basin. Environ. Res. Lett. 8:1-10.
Crossref |
|
|
|
Robert W (2008). Climate Change Impact on Hydro Electric Water Resources Management. A Technical Workshop Organized by CEATI International. Montreal, Q C. Canada. |
|
|
|
Salami AW, Olofintoye OO, Sule BF (2011). Modeling global warming impact on the rainfall of some selected cities in the Niger Delta of Nigeria. J. Eng. Res. 16(2):1-12. |
|
|
|
Valt M, Cagnati A, Crepaz A, Marigo G (2005). Snow precipitation in the Last Years on Italian ALPS. 654-657. |
|
|
|
Xia R (2011). A parametric modeling study of the climate change impact on river eutrophication and water quality. A Master of Applied Science Thesis Submitted to the Department of Building, Civil and Environmental Engineering, Concordia University. Montreal, Quebec, Canada. pp. 1-141. |


