ABSTRACT
Evapotranspiration is an important component necessary for ensuring efficient management of water resources for every river basin. The Bui Hydroelectric Plant completed early 2014 to provide electricity for the people of Ghana is located within the Black Volta River Basin of West Africa. With the construction of this plant and related developments, there is a need for attention to be paid to the conservation of water resources within this basin. This paper therefore assesses the spatial temporal behaviour of evapotranspiration within the basin from 2001 to 2013 and compares this with the average monthly rainfall estimates from 1983 to 2012. The assessment shows that the average monthly evapotranspiration is within 0 to 150 mm/month for the period assessed. However, significant variation exists between the years with a highly erratic pattern observed. The pattern of the rainfall indicates that the upstream portion of the basin receives lower rainfall compared to the downstream portion of the basin. This pattern is consistent with the overall variation of the evapotranspiration within the basin. This spatial-temporal behaviour is an important factor that needs to be considered by all stakeholders given the anticipated land-use changes expected within the basin coupled with likely future increases in temperatures resulting from climate change.
Key words: Evapotranspiration, moderate resolution imaging spectroradiometer 16 (MODIS16), satellite application facility (SAF), Tropical Applications of Meteorology using SATellite (TAMSAT) rainfall, Bui Hydroelectric plant.
Evapotranspiration (ET) is one of the difficult hydrological cycle parameters to estimate. It is impossible to estimate directly both in-situ and through satellite data. As a result, there have been several studies over the past decade using various derived data/products to estimate evapo- transpiration (Bastiaanssen, 2000; Minacapilli et al., 2009; Or and Hanks, 1992; Rana and Katerji, 2000; Rwasoka et al., 2011; Su et al., 2003, 2005; Sucksdorff and Ottle, 1990). The large number of studies highlights the significance of this parameter and it relevance to water resource managers and agriculturist as it informs decisions on water budgets. The ET dynamics cannot be directly quantified from satellite observations; as a result it is derived based on the assumption, that surface variables have a direct influence on evapotranspiration (Choudhury, 1991).
In the recent past, satellite data has provided a leap forward in the ability to indirectly estimate evapotranspiration fluxes in space and time, further boosting our ability to monitor the ET over large areas (Allen et al., 2007; Bastiaanssen, 2000; Su, 2002). The surface energy balance algorithm for land (SEBAL) is a remote sensing based model that can be used to estimate large-scale ET over an area (Bastiaanssen, 2000; Bastiaanssen et al., 1998a, b). The SEBAL model uses satellite derived data for the land surface characteristics such as the surface albedo, land surface temperature and vegetation index. This is then coupled with meteorological data (that is, wind speed, humidity, solar radiation and air temperature) to resolve and estimate the instantaneous energy balance and then extrapolated to obtain the daily evapotranspiration. Another remote sensing based model is the surface energy balance system (SEBS) which also uses a similar approach to SEBAL by combining satellite derived products and meteorological data to estimate evapotranspiration (Su, 2002, 2009). Several improved versions by different researchers have been proposed however these are all fundamentally derived from the basic concepts indicated by SEBAL and SEBS. Other methods which have also been used include Vegetation Index/Temperature Trapezoid (VITT) (Moran et al., 1994) and Mapping Evapotranspiration at high resolution with internalized calibration (METRIC) (Allen et al., 2007).
Building on these fundamentals of remotely sensed ET products, the National Aeronautics and Space Administration (NASA) developed the moderate resolution imaging spectroradiometer (MODIS). The remotely sensed MODIS has both vegetative and land surface products. Mu et al. (2007) developed global evapotranspiration algorithm based on the remotely sensed MODIS data and global meteorological data. This algorithm was further improved by Mu et al. (2011) to improve the calculation of vegetation cover fraction, soil heat flux estimation and resistances for stomatal, aerodynamic and boundary layer. On the other hand, European Organisation for the Exploitation of Meteorological Satellites (EUMETSAT) has also developed products under the land surface analysis satellite applications facility (LSA SAF) initiatives. LSA-SAF ET algorithm is one of the first kind to derive quasi-real time ET over large areas such as Europe, Africa and South America using remote sensing. It uses the meteosat second generation (MSG) to derive ET at high temporal scale over large areas.
For the Black Volta Basin of West Africa that is data scarce, the availability of these remotely sensed data provide a critical gap filling for understanding water budgets in the basin. Generally, in-situ stations within the basin are limited, and hence for real time decision making; it is imperative to support this with remotely sensed data.
In the Volta Basin, a number of researches have been conducted on the estimation of evapotranspiration using remote sensing methods (Hafeez et al., 2007; Mu et al., 2011b; Opoku-Duah et al., 2008) and others with water balance approach (Friesen et al., 2005; Kunstmann and Jung, 2007; Oguntunde et al., 2006). The Volta Basin consists of the Black, White and Oti River Basins. Most work has been conducted in the White Basin and Oti River Basin, there is no clear studies on the application of remote sensing techniques for estimation of ET in the Black Volta Basin. With the increasing relevance of the Black Volta to the economies of Ghana and Cote D’Ivoire, the water budget analysis in terms of the losses – ET become crucial.
The availability of MODIS ET and LSA SAF ET provides adequate spatially and temporally information that practitioners can use to inform decision making as it relates to water budgets in river basins. The objective of the paper is to estimate the spatial temporal ET over the Black River Basin using remote sensing approaches with data from MODIS ET and LSA SAF ET from 2001 to 2014. The products adopted are to assess and gain an understanding of the spatial-temporal ET variability between the 2001 and 2014 for the Black Volta Basin of West Africa; providing useful information for this important basin of West Africa given its socio-economic contribution to Ghana and neighbouring countries.
Study area
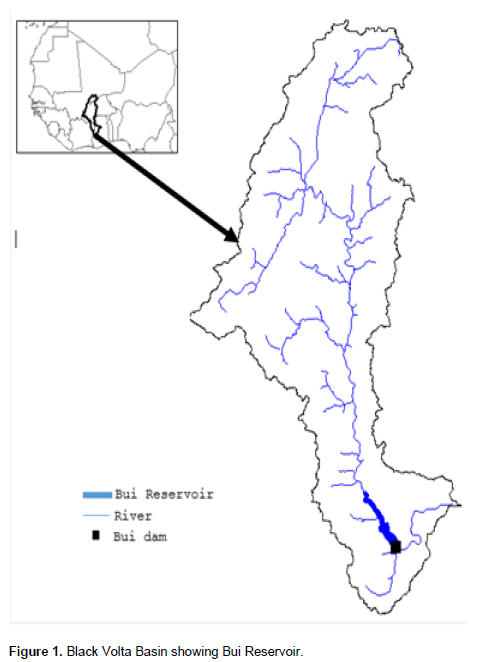
The Black Volta River which is a tributary of the White Volta River flows through Ghana for about 1352 km before it joins the White Volta Basin. The Black Volta River Basin covers an area of 147000 km2 and forms part of the international border between the La Cote D’Ivoire and Ghana, and Burkina Faso and Ghana. The basin has a tropical climate with temperatures averaging 24°C and a double maxima rainfall pattern. Average annual rainfalls for the northern and southern parts of the basin are 1000 and 1400 mm, respectively.
With the completion of the 400 MW Hydroelectric Project at Bui Gorge at the south end of the Bui National Park in Ghana in 2014, the basin has become very important on the national and international agenda as there is now a heightened need to monitor closely the water budgets in this basin to ensure sustainable management of the water resources. This is because the Bui Hydro plant is the second largest hydroelectric plant in the country after the Akosombo Dam. Figure 1 shows the basin including the Bui reservoir.
Datasets
MODIS global ET
The MODIS is aboard the Terra and Aqua satellites. The Terra’s orbit around the Earth is programmed to pass from north to south and across the equator in the morning while the Aqua from south to north over the equator in the afternoon. The Terra and Aqua views the complete Earth in every 1 to 2 days and hence provide adequate information to monitor environmental fluxes. The MODIS16 ET datasets are estimated using the improved ET algorithm from Mu et al. (2011)over the previous (Mu et al., 2007). The ET algorithm is based on the Penman-Monteith equation with the concept that surface resistance is an effective resistance to evaporation from land surface and transpiration plant canopy. The MOD16 monthly global ET dataset are 5600 m spatial resolution at the equator. Due to its coarse resolution of the product, it is appropriate for the study of large areas or continental scale but not suitable for smaller watersheds. It would also be interesting if the regular production of such products was implemented so that on a timely basis, MODIS ET products could be obtained based on the algorithm in real time. The dataset covers a time period of 2000 to 2012, and, it is expected that in the future the dataset will be produced and posted periodically but this is not in real-time. Data for the period 2000 to 2012 was downloaded from ftp://ftp.ntsg.umt.edu/pub/MODIS/NTSG_ Products/MOD16/.
LSASAF Global ET
The EUMETSAT LSA SAF is part of the SAF Network, a set of specialized development and processing centres, serving as EUMETSAT distributed Applications Ground Segment (LSA SAF, 2011). The SAF network supplements the product-oriented activities at the EUMETSAT Central Facility in Darmstadt. The prime purpose of the LSA SAF is to take full advantage of remotely sensed data to measure land surface variables that are of relevance; for supporting applications in meteorology (http://landsaf.meteo.pt/). ET is therefore one of the products developed by the LSA SAF.
The ET algorithm developed by the LSA SAF uses the quantification of flux of water vapour from the ground surface (that is, soil and canopy) into the atmosphere using derived products from the Meteosat Second Generation (MSG) satellites. The method mimics the physical approach and can be simplified as a simplified soil-vegetation-atmosphere transfer (SVAT) module adapted to integrate forcing satellite remote sensing (SRS) derived data with data from numerical weather products (NWP). The physics of the model on the Tiled European Centre for Medium-Range Weather Forecasts (ECMRWF) surface scheme for exchange processes over land, TESSEL-SVAT scheme are documented in (Van den Hurk et al., 2000; Viterbo and Beljaars, 1995). Daily ET products were downloaded for 2013 from ftp://landsaf.ipma.pt/. The greatest advantage of this product is the real-time production of the ET measurements on continental scale. However, the coarse resolution of the dataset is still a challenge for smaller watersheds assessment.
TAMSAT rainfall data
The Tropical Applications of Meteorology using SATellite (TAMSAT) research group at the Reading University in UK has produced climatological rainfall estimates for the period 1983-2012. This data is currently available at: http://www.met.reading.ac.uk/~tamsat/public_data/TAMSAT_clim_monthly.zip. The TAMSAT rainfall estimates are produced for Africa using the Meteosat thermal infrared observations. The TAMSAT rainfall estimation algorithm is calibrated using historic rain gauge records providing monthly and regional calibration parameters in both real and historical time scales.
Procedure
The ET products for both LSA SAF and MODIS16 were correlated to check their comparability. The spatial correlation between the two datasets was relatively good (that is, R2 is 0.77). This suggested that the datasets could be used to evaluate and understand the spatial-temporal behaviour for the study area. The monthly MODIS ET products have been validated (Mu et al., 2011a); however these products are only available from 2000 to 2012. The LSA SAF daily ET products on the other hand were only available from July 2010. Therefore, the LSA SAF ET daily products were first resampled to the same spatial resolution as the MODIS16 ET and then, used to derive the monthly ET for the period 2013 to 2014. In Integrated Land and Water Information System (ILWIS) open, the resampling LSA SAF ET was done by choosing the georeference of the MODIS16 ET map. The integration of the two datasets provided a long-series dynamics of the Black Volta River Basin from 2000 to 2014.
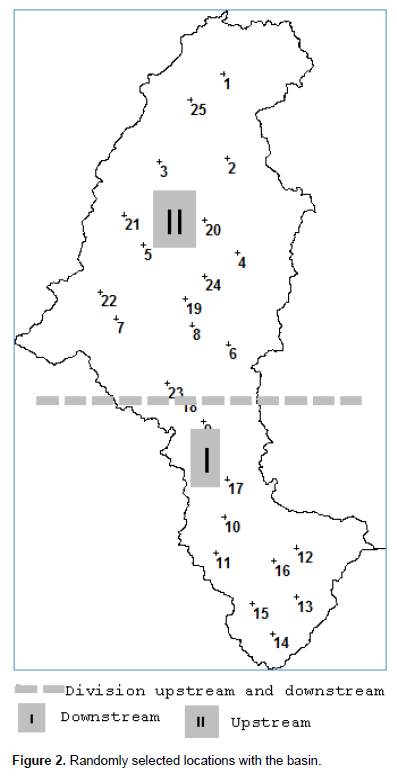
To understand the spatial behaviour of the monthly ET within the basin, 25 points (Figure 2) were distributed throughout the basin with the various monthly ET quantities from each location compared for each year for the whole period. This provided evidence of the dynamic spatial and temporal behaviour within the basin.
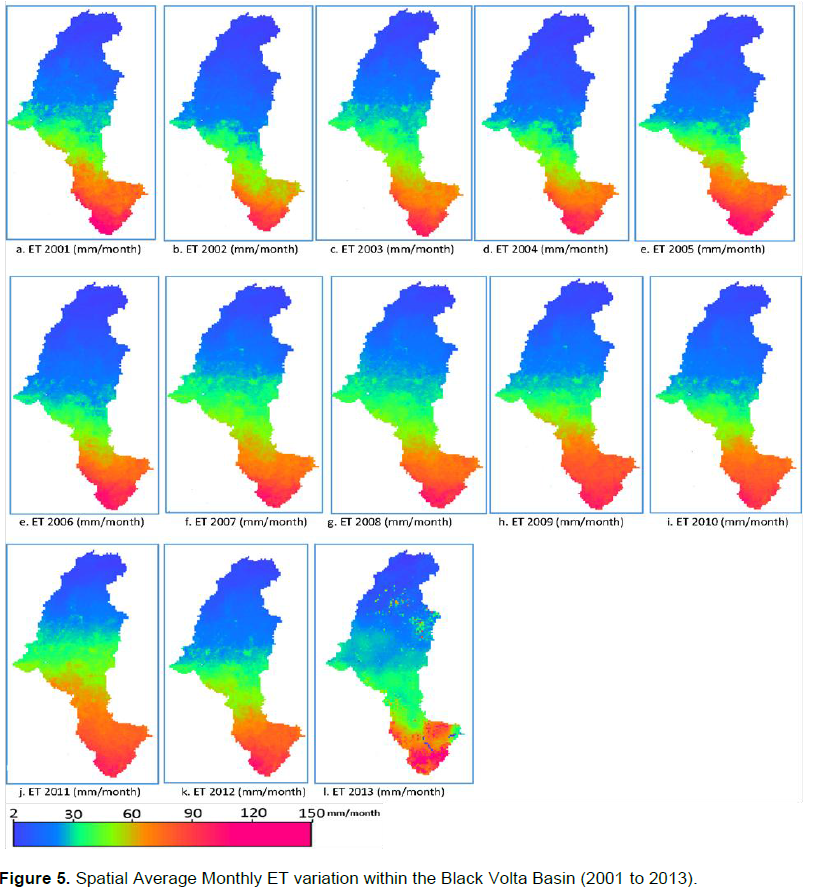
The results of the estimated monthly ET are provided in Figure 5 for the 12 year period (2001 to 2013). The estimation from 2001 to 2012 was obtained from the MODIS16 Global ET. For the year 2013, ET estimated from the LSA SAF. The 12 year period ET estimation shows an average monthly distribution of 2 to 150 mm/month from 2001 to 2013 with the exception of the year 2010, where the ET quantities were slightly higher. The upstream portion of the basin (as indicated in Figure 2) tends to show very low average monthly ET estimates (2 to 50 mm/month) whereas the downstream portion of the basin shows high of 50 to 200 mm/month. There is an apparent exception for the year 2013 where some locations in the upstream portion of the basin receive ET estimates as high as 150 mm/month. It also shows that the portion of the basin located in the Brong-Ahafo Region of Ghana has higher ET estimates for the whole period compared to the rest of the basin. The average monthly ET for this part within Ghana is within the range of 100 to 200 mm/month. The part located within the La Cote D’Ivoire also receives the second highest ET estimates for the period (50 to 100 mm/month).
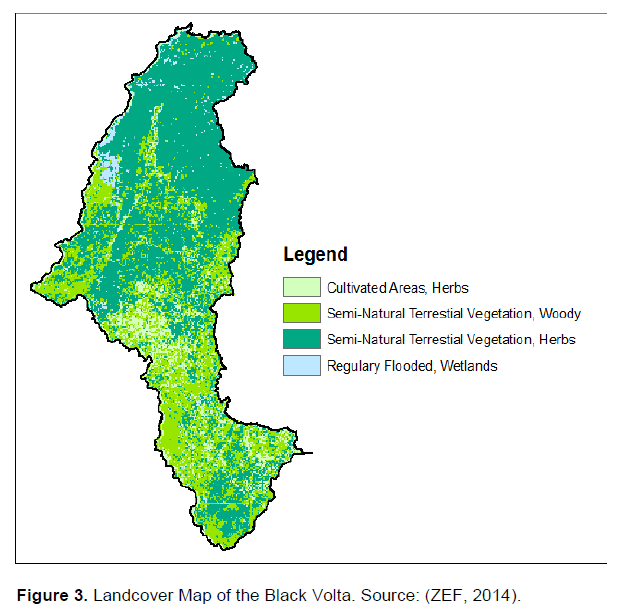
The landcover of the basin describes a variation of terrestrial woodlands, herbs and cultivated areas (Figure 3). This is reflective of the major economic activity in the basin as agriculturally based. Therefore, variations between
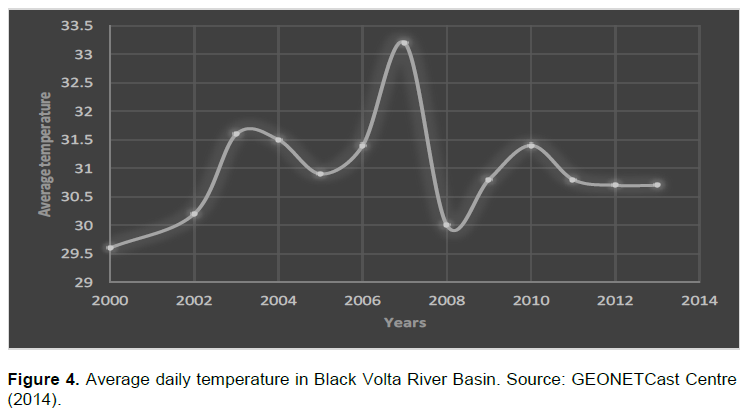
different landcover types in the area are expected to be changing over time. Now, there is however a clear distinction between the upstream and the downstream that the upstream is predominately covered with semi-natural terrestrial herbs while the downstream is covered with semi-natural terrestrial woodlands. Though, the density of cover in each of these classes was not determined, it can be deduced that the upstream had higher ET estimates compared to the downstream as a result of more vegetative activity in the downstream. More vegetative cover in the downstream results in higher transpiration, hence increasing the amount of ET over the area. The temperature distribution in Figure 4 shows an erratic pattern between 2001 and 2013 measuring as low as 29.5°C (2001) to 30.7°C (2013). Though, the temperature measurements over the period are not spatially distributed, it helps to explain the general variation of the ET among the various years as a result of the effect of the temperature.
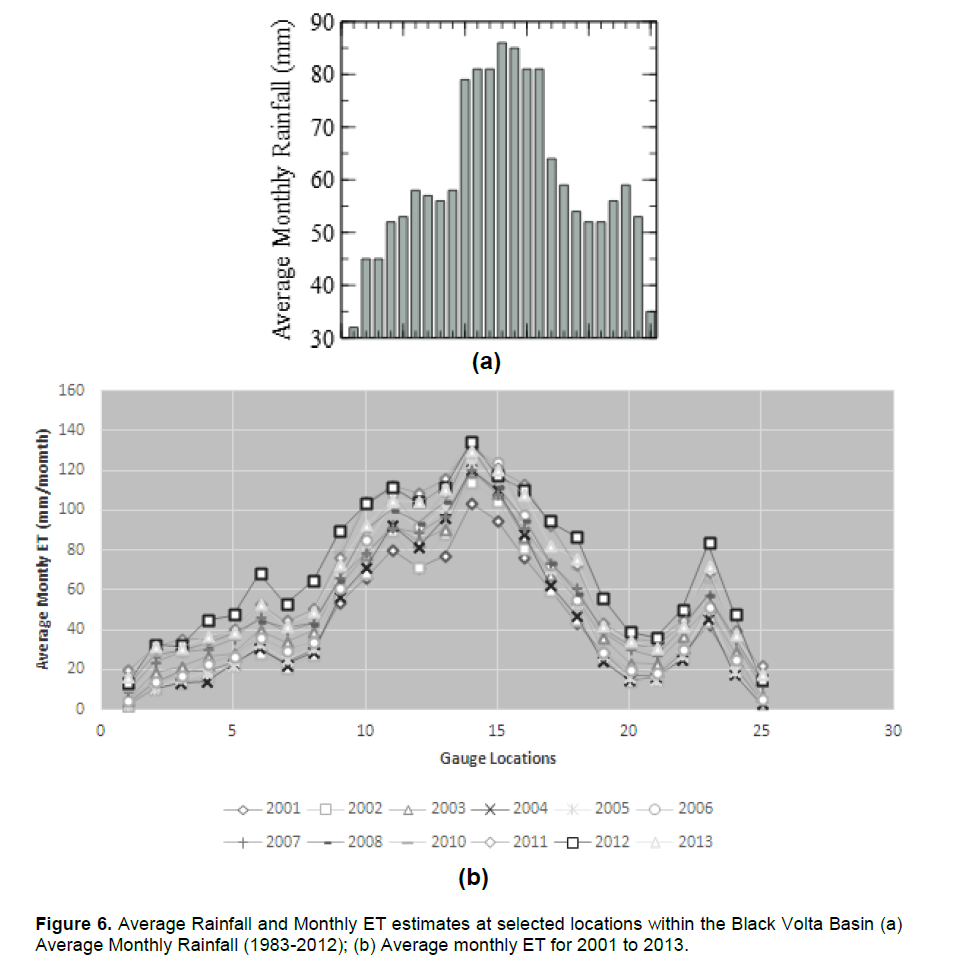
Figure 4 shows a relatively stable rainfall pattern observed across the different parts of the basin. The upstream portion of the basin labelled (II) is seen to have a relatively low monthly rainfall (30-60 mm) during the last 30 years compared to the downstream portion of the basin (60 to 86 mm). This possibly accounts for the observed spatial variation in ET with ET for the basin showing a similar overall spatial pattern. As would be expected due to issues of the erratic nature of the weather and climatic conditions, there are some yearly
variability.
To understand the climatological conditions and to explain the possible reason for the high ET in the southern part of the basin compared to the rest of the basin, Figure 4 was developed. Figure 6(a) shows the average rainfall obtained from TAMSAT from 1983 to 2012 at the selected locations within the basin. Figure 6(b) shows the average monthly ET for the period 2001 to 2013.
The Bui Hydroelectric dam is located at the downstream portion of the basin (Figure 1). With the average monthly ET being relatively high around this location, this means that there is the need for careful attention to be paid to the management of the water resources in the reservoir to ensure that there is a consistent and sufficient water head for the generating power at the plant. With climate change, temperatures are expected to rise (Hulme et al., 2001; Kurukulasuriya et al., 2006; Stern, 2007). It is therefore imperative to consider this rise with the existing spatial-temporal behaviour of the evapotranspiration within the basin.
Generally, the temporal trend of the ET between years is rather erratic and does not follow any consistent pattern. However, the temporal trend with the downstream and upstream parts of the basin indicates that the downstream regularly receives higher rainfall and evapotranspiration values within a given year but between years, can be a rise or a fall. The spatial trend is rather vivid, showing lower evapotranspiration in the extreme upstream and showing highest evapotranspiration in the extreme downstream, with the middle part, showing average values.


With the completion of the Bui Hydroelectric plant in 2014, it is expected that socio-economic activity within the basin is bound to rise which no doubt will result in land-use modifications that could impact the hydrology and geomorphology of the basin. For example the downstream part of the basin has seen recent developments due to the establishment of new government institutions such as Bui Community, the Catholic University College and the University of Energy and Natural Resources. These are expected to translate to the building of new buildings and related infrastructure to house the activities of these newly established institutions.
Coupling these socio-economic changes with other changes such as climate change means that the basin characteristics could be significantly impacted. Large numbers of studies have indicated the impact of land-use change on rising temperatures (Dullinger et al., 2004; Piao et al., 2007). With these changes taking place, the average monthly ET would be expected to rise higher than what is shown between the period 2001 to 2013. If that were to happen, then special measures would be needed to ensure the Bui reservoir is able to conserve the water behind the dam, to enable constant and regular supply of water to the turbines. Such measures would be necessary to ensure that purposes for which the Bui Hydroelectric plant was established are consistently met. It would also be necessary that relevant stakeholders in the basin begin to discuss and coordinate across the countries involved (Ghana, La Cote D’Ivoire, Burkina Faso and Mali) to ensure that the water resources are efficiently managed, taking close consideration of the potential large losses e.g. evapotranspiration.
The Black Volta is a trans-boundary basin covering four countries – Ghana, Cote D’Ivoire, Burkina Faso and Mali. With the recent construction of the Bui Hydroelectric plant and associated dam, this has increased the possible socio-economic activities within the basin, owing to the relocation of small scale farmers and the establishment of new institutions to maintain the hydroelectric plant. With such new developments, the conservation of water resources has become critical. It is important that the water resources are managed appropriately to ensure that adequate water is available for the running of the hydroelectric plant.
The paper assessed the evapotranspiration in the basin from 2001 to 2013 to determine the spatial-temporal behaviour during this time. The study revealed that the average monthly evapotranspiration is estimated to be 0-150 mm/month for the whole period with the exemption of the year 2010 where estimates were about 200 mm/month.
The average monthly evapotranspiration were compared with the average monthly rainfall estimates over a 30-year period. This comparison showed that the higher evapotranspiration estimates coincide with the high rainfall pattern within the basin. The study provides baseline information for decision makers and stakeholders within the basin to consider an integrated approach to managing the losses (that is, evapotranspira-tion) to ensure equitable sharing of the water resources within the basin for hydropower and also small scale farming activities
The authors wish to thank Prof. Ben Maathuis of Faculty of Geo-information and Earth Observation, University of Twente, The Netherlands for his development of the ISOD toolbox and the GEONETCast toolbox. Thanks also go to staff of MODIS16 Global ET programme and LSA SAF of EUMETSAT for their continuous support to evapotranspiration studies globally. Furthermore, staff of TAMSAT research group at the Reading University are also appreciated for their contribution to spatial rainfall estimates for Africa.
The authors of this publication have no financial issues or related interest that have influenced the study and therefore, expresses no conflict of interest whatsoever.
REFERENCES
|
Alazem F, Kabo-bah AT (2012). Estimation Of Evapotranspiration In The Om Alrabeaa Region In Morroco Using The Sebs Model. In African Association of Remote Sensing of the Environment (AARSE). Morocco. |
|
|
Allen RG, Tasumi M, Trezza R (2007). Satellite-based energy balance for mapping evapotranspiration with internalized calibration (METRIC)—Model. J. Irrig. Drain. Eng. 133(4):380–394.
Crossref |
|
|
Bastiaanssen WGM (2000). SEBAL-based sensible and latent heat fluxes in the irrigated Gediz Basin. Turk. J. Hydrol. 229(1):87–100.
Crossref |
|
|
Bastiaanssen WGM, Menenti M, Feddes RA, Holtslag AAM (1998). A remote sensing surface energy balance algorithm for land (SEBAL). 1. Formulation. J. Hydrol. 212-213:198–212.
Crossref |
|
|
Bastiaanssena WGM, Pelgruma H, Wangb J, Mab Y, Morenoc JF, Roerinka GJ, van der Walai T (1998). A remote sensing surface energy balance algorithm for land (SEBAL): Part 2: Validation. J. Hydrol. 21:213–229.
Crossref |
|
|
Choudhury BJ (1991). Multispectral satellite data in the context of land surface heat balance. Rev. Geophys. 29(2):217–236.
Crossref |
|
|
Dullinger S, Dirnböck T, Grabherr G (2004). Modelling climate change-driven treeline shifts: Relative effects of temperature increase, dispersal and invasibility. J. Ecol. 92(2):241–252.
Crossref |
|
|
|
Friesen J, Andreini M, Andah W (2005). Storage capacity and long-term water balance of the Volta Basin, West Africa. Regional Hydrological Impacts of Climatic Change: Hydroclim. Variabil. 2:138. |
|
|
|
GEONETCast Centre (2014). Data Acquisition Portal. University of Energy and Natural Resources, Sunyani-Ghana. |
|
|
Hafeez M, Andreini M, Liebe J, Friesen J, Marx A, Van De Giesen N (2007). Hydrological parameterization through remote sensing in Volta Basin, West Africa. Int. J. River Basin Manage. 5(1):49–56.
Crossref |
|
|
Hulme M, Doherty R, Ngara T, New M, Lister D (2001). African climate change: 1900-2100. Clim. Res. 17(2):145–168.
Crossref |
|
|
|
Kunstmann H, Jung G (2007). Influence of soil-moisture and land use change on precipitation in the Volta Basin of West Africa. Int. J. River Basin Manage. 5(1):9–16. |
|
|
Kurukulasuriya P, Mendelsohn R, Hassan R, Benhin J, Deressa T, Diop M (2006). Will African agriculture survive climate change? The World Bank Econ. Rev. 20(3):367–388.
Crossref |
|
|
|
LANDSAF (2014). Daily ET products. |
|
|
|
LSA SAF. (2011). The EUMETSAT Satellite Application Facility on Land Surface Analysis (LSA SAF). Damstadt. |
|
|
Minacapilli M, Agnese C, Blanda F, Cammalleri C, Ciraolo G, D'Urso G, Rallo G (2009). Estimation of actual evapotranspiration of Mediterranean perennial crops by means of remote-sensing based surface energy balance models. Hydrol. Earth Syst. Sci, 13:1061–1074.
Crossref |
|
|
Moran MS, Clarke TR, Inoue Y, Vidal A (1994). Estimating crop water deficit using the relation between surface-air temperature and spectral vegetation index. Rem. Sens. Environ. 49(3):246–263.
Crossref |
|
|
|
MODIS (2014). MODIS Global ET data. |
|
|
Mu Q, Heinsch FA, Zhao M, Running SW (2007). Development of a global evapotranspiration algorithm based on MODIS and global meteorology data. Rem. Sens. Environ. 111(4):519–536.
Crossref |
|
|
Mu Q, Zhao M, Running SW (2011a). Improvements to a MODIS global terrestrial evapotranspiration algorithm. Rem. Sens. Environ. 115(8):1781–1800.
Crossref |
|
|
Mu Q, Zhao M, Running SW (2011b). Improvements to a MODIS global terrestrial evapotranspiration algorithm. Rem. Sens. Environ. 115(8):1781–1800.
Crossref |
|
|
Oguntunde PG, Friesen J, van de Giesen N, Savenije HHG (2006). Hydroclimatology of the Volta River Basin in West Africa: Trends and variability from 1901 to 2002. Physics and Chemistry of the Earth, Parts A/B/C 31(18):1180–1188.
Crossref |
|
|
|
Opoku-Duah S, Donoghue DNM, Burt TP (2008). Intercomparison of evapotranspiration over the Savannah Volta Basin in West Africa using remote sensing data. Sensors 8(4):2736–2761. |
|
|
Or D, Hanks RJ (1992). Spatial and temporal soil water estimation considering soil variability and evapotranspiration uncertainty. Water Resour. Res. 28(3):803–814.
Crossref |
|
|
Piao S, Friedlingstein P, Ciais P, de Noblet-Ducoudré N, Labat D, Zaehle S (2007). Changes in climate and land use have a larger direct impact than rising CO2 on global river runoff trends. Proc. Natl. Acad. Sci. 104(39):15242–15247.
Crossref |
|
|
Rana G, Katerji N (2000). Measurement and estimation of actual evapotranspiration in the field under Mediterranean climate: A review. Eur. J. Agron. 13(2-3):125–153.
Crossref |
|
|
Rwasoka DT, Gumindoga W, Gwenzi J (2011). Estimation of actual evapotranspiration using the Surface Energy Balance System (SEBS) algorithm in the Upper Manyame catchment in Zimbabwe. Physics and Chemistry of the Earth, Parts A/B/C.
Crossref |
|
|
Stern N (2007). The economics of climate change: The Stern review. Cambridge University Press.
Crossref |
|
|
|
Su BZ (2009). Introduction to the Surface Energy Balance System (SEBS). Enschede: ITC. |
|
|
Su H, McCabe MF, Wood EF, Su Z, Prueger JH (2005). Modeling evapotranspiration during SMACEX: Comparing two approaches for local-and regional-scale prediction. J. Hydrometeorol. 6(6):910–922.
Crossref |
|
|
Su Z (2002). The Surface Energy Balance System (SEBS) for estimation of turbulent heat fluxes. Hydrol. Earth Syst. Sci. 6(1):85–99.
Crossref |
|
|
|
Su Z, Wen J, Wan L (2003). A methodology for the retrieval of land physical parameter and actual evaporation using NOAA/AVHRR data. J. Jilin Univ. Earth Sci. 33(1):106–118. |
|
|
Sucksdorff Y, Ottle C (1990). Application of satellite remote sensing to estimate areal evapotranspiration over a watershed. J. Hydrol. 121(1-4):321–333.
Crossref |
|
|
|
TAMSAT (2014). TAMSAT Rainfall Products. |
|
|
|
Van den Hurk BJJM, Viterbo P, Beljaars ACM, Betts AK (2000). Offline validation of the ERA40 surface scheme. European Centre for Medium-Range Weather Forecasts. |
|
|
Viterbo P, Beljaars ACM (1995). An improved land surface parameterization scheme in the ECMWF model and its validation. J. Clim. 8(11):2716–2748.
Crossref |
|
|
|
ZEF (2014). Maps.
View
|