ABSTRACT
Analysis of spatial and temporal drought variability in the upper Tana River basin using Palmer Drought Severity Index (PDSI) was conducted. The drought is critical for formulation of mitigation measures in the river basin. A monthly temporal and 90-m spatial resolution was applied. This was achieved within ArcGIS environment. Climatic data for 1970 to 2010 was used for computation of the PDSI while the missing data sets were filled using Artificial Neural Networks (ANNs). The results of PDSI for dry and wet seasons at meteorological stations indicate that the time series plots for the PDSI values for dry season are generally lower than those for the wet seasons. The PDSI values for meteorological stations located at the lower elevation of the basin are lower than those located at higher elevation. On the other hand, spatially distributed drought severity based on PDSI show that the ranges of maximum and minimum drought severity values in 1970 are -0.868 to -0.804 and -0.675 to -0.610 respectively. These values of drought severity occur respectively in the north-western and south-eastern areas of the basin. PDSI values increased from the range -0.675 to -0.610 in 1970 and from -1.087 to 0.957 in 2010 for the north-eastern areas of the upper basin. The south eastern areas of the basin are more prone to drought risks than north-western parts. Use of the PDSI reflects the spatial heterogeneity and temporal variability of drought across the basin. The drought assessment offer technical approach for comprehensive understanding of drought for effective drought-induced disaster mitigation and its management, with a view to reducing adverse effects on livelihoods.
Key words: Palmer Drought Severity Index (PDSI), drought severity, upper Tana River basin, monthly resolution, drought-induced disaster.
Drought is a condition on land characterised by scarcity of water that falls below a defined threshold level. The term drought has been defined differently in numerous applications (UNDP, 2012). However, it is a challenge to quantitatively define the term. Droughts may be expressed in terms of indices that depend on precipitation deficit, soil-water deficit, low stream flow, low reservoir levels and low groundwater level. Drought may be defined differently depending on the sector involved. For example, a hydrological-drought occurs whenever river or groundwater levels are relatively low. In addition, water-resources drought occurs when basins experience low stream flow, reduced water reservoir volume and groundwater levels. The water resources drought is influenced by climatic and hydrological parameters within a river basin and drought management practices. The hydrological drought, mainly deals with low stream flows. This drought adversely affects various aspects of human interest such as food security, water supply and hydropower generation (Karamouz et al., 2009; Belayneh and Adamowski, 2013).
It is paramount to analyse and monitor drought due to its adverse effects. For the purpose of understanding drought, the hydro-meteorological variables are encapsulated into drought indices at river basin scales. These drought indices provide critical information on decision making (Quiring and Papakryiakou, 2003). In order to mitigate adverse drought impacts on water resources, ecosystems, economy and peoples livelihoods, it is paramount to undertake drought studies. Key drought studies should describe its characteristics such as temporal trends, spatial distribution of severity frequency and duration. Prior to formulation of drought mitigation mechanism in a river basin, it is essential to first describe its characteristics at the basin scale. Drought affects ecosystem response mechanisms and is thus perceived to influence the future of the global earth carbon balance (Bonal et al., 2016).
In this study, upper Tana River basin was selected because it is a very important resource in Kenya. It is clipped from the larger Tana River basin; the largest river basin in the country that provide huge water resources. The upper Tana River basin has forest land resources located along the eastern slopes of Mount Kenya and Aberdares range which have a critical role in regulating the hydrology of the entire basin (IFAD, 2012). The basin is located within a fragile ecosystem that represents all agro-ecological zones of Kenya where water resource systems, hydro- power generation and food security are negatively impacted by frequent drought occurrences.
A number of drought types have been recognized by previous researchers. According to Zoljoodi and Didevarasl (2013), there are four main categories of droughts; Hydrological, Meteorological, Agricultural and Socio-economic droughts. The first three types are called the operational droughts and can be integrated into a drought management process. Their relation can be used in development of water resources program within a river basin (Karamouz et al., 2003). Propagation of hydrological and agricultural drought starts from meteorological droughts induced by changing phenomena within the hydrological cycle (Figure 1).
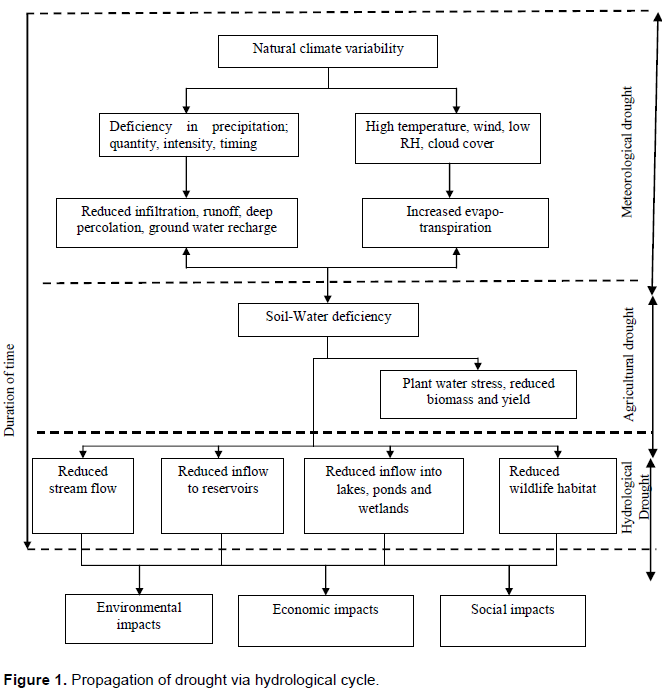
The three operational types of droughts are interconnected. For instance, Agricultural drought links meteorological and/or hydrological drought to agricultural impact. Agricultural droughts impact negatively on farming systems whenever they occur. Their impacts are normally two-fold; environmental and economic impacts. The agricultural drought is a type associated with low agricultural production, increased food insecurity, decline in output from agro-processing industries and unemployment incidents in the agricultural sector. From the environmental perspective, agricultural drought is caused by insufficient precipitation, high temperature that causes elevated rates of evapo-transpiration, increased salt concentration in the crop root zones and soils within irrigation systems (Mishra and Singh, 2010). The term environmental drought is sometimes used to address the adverse effects of extremely low flows on ecosystems, and may be analysed in the emerging field of eco-hydrology.
Based on purpose for research, drought indices have previously been developed and applied on drought studies. Some of the most common drought indices include palmer drought severity index (PDSI), standardized precipitation index (SPI), surface water supply index (SWSI), soil moisture deficit index (SMDI), vegetative index (VI) and stream flow drought index (SDI). In the present study, PDSI was used to analyse drought episodes in the uppar Tana River basin.
Several coefficients which are calculated to define local hydrological characteristics influenced by precipitation and temperature are calculated for use in PDSI. These coefficients depend on soil water capacity of the principal layers. The PDSI has been applied on a number of catchments for detecting and planning of drought relief programmes (Loucks and Van Beek, 2005). In the present study, spatial and temporal drought variability in the upper Tana River basin was analysed using Palmer Drought Severity Index (PDSI) to detect the drought prone areas and the severity drought events for the period 1970 to 2010.
Study area
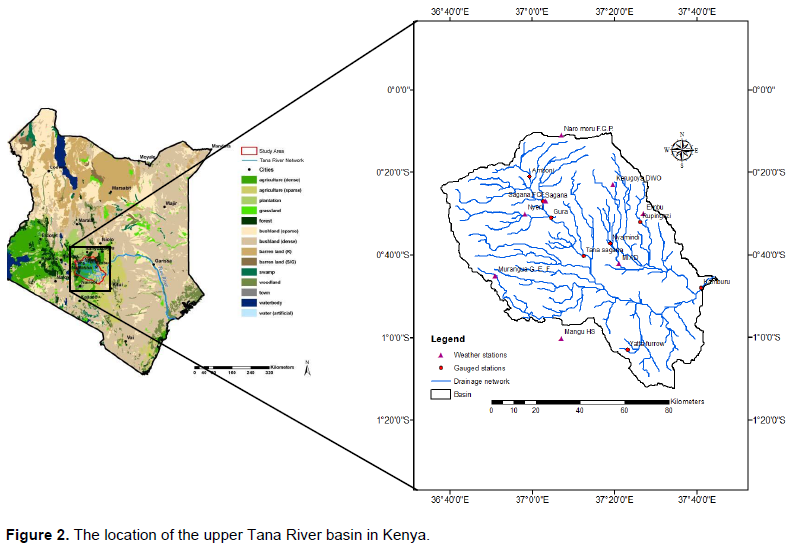
The study area; upper Tana River basin is located within latitudes 00° 05' and 01° 30' south and longitudes 36° 20' and 37° 60' east. The study area covers 17,420 km2 and is illustrated in Figure 2).
Upper Tana River basin is a portion of the Kenya’s largest rivers system called Tana River basin (Jacobs et al., 2004; WRMA, 2010). There are very important vast land and forests on eastern slopes of Mount Kenya and Aberdares range within the study area. The river basin greatly regulates the hydrological processes (IFAD, 2012) and as subsequently influence the hydro-electric generation. This basin is plays a key role in hydro-electric generation, water supply and agricultural production in Kenya.
Climatic data acquisition
The data, precipitation, potential, soil moisture content and temperature were used in computation and analysis Palmer Drought Severity Index (PDSI). The climatic data ranged from 1970-2010 (41 years) were used in this study. Part of this data was available while the missing data was estimated for all variables. The available data was on daily time step but had to be re-organized into monthly average time scales for all the variables to match with the data requirements of the present research. The daily stream and monthly flow data was obtained from the Ministry of Environment and Natural Resources, and Water Resources and Management Authority (WRMA).
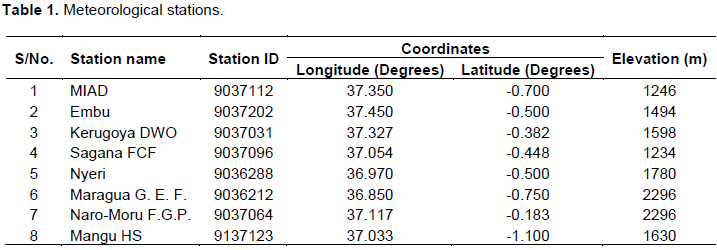
In the upper Tana River basin, data from twenty four meteorological stations were obtained from the Ministry of Water and Irrigation. The stations provided meteorological; precipitation, temperature, evaporation data. The data were then subjected to exploratory data processing. It was found out that only eight stations had reliable and sufficient data. Where the available data contained less than 20% data gaps, then these data were selected for computation of the PDSI. The eight stations used in the study (Table 1) were also objectively located within the low (LE), lower middle (LME), middle (ME) and high (HE) elevations. The stations are located at different agro-ecological zones of the basin.
Consistency test of the climatic data
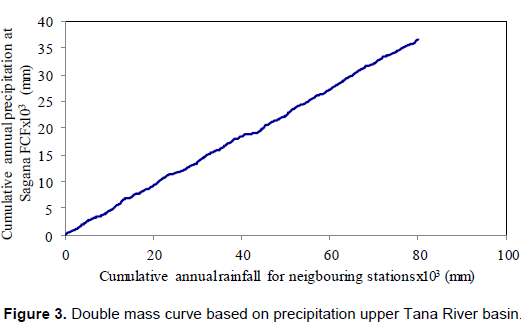
A double-mass curve was fitted for the collected hydro-meteorological data to test for consistency. The homogeinity of climatic data time series data was conducted to detect for any possible errors resulting from the data measurements. In addition, homogeneity was used to check for the fluctuations due to climate changes. The cumulative total climatic variable, precipitation were computed for each station and then plotted against the cumulative total of an adjacent station (Figure 3). Any sudden change in the gradient of the double-mass curve was considered to indicate inconsistency in the data. Although there were some changes at some points on the curves for some stations, it was considered insignificant for the present study.
Filling in missing data
The meteorological stations; 9037064, 9037112, 9037031, 9137123, 9037202, 9037096, 9036288 and 9036212 (Table 2) had continuous data for 26, 28, 35, 32, 40, 35, 40 and 23 years respectively. The data for each station was partitioned into training and validation data sets comprising 70% and 30% respectively of the total continuously recorded data.
In this study, the ANN structure for each station was obtained by considering different input neurons for different time delays; t, t-1, t-2,…, t-n, in the input layer. The number of input variables was equal to the input neurons. The initial number of hidden neurons of the ANN model architecture was determined using the procedure adapted from Belayneh and Adamowski (2012) where the hidden layer neurons were initially set at 2n+1 where n is the input neurons. The Hidden Neurons (HN) were then increased and decreased through trial and error technique for data sets at each hydrometric station. This resulted to an output that was taken as the estimated variable.
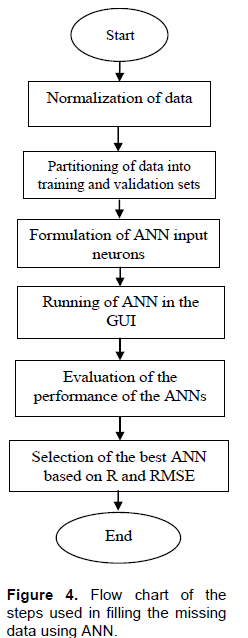
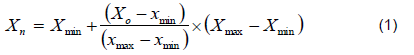
The output layer comprises neurons in all the networks that are equal to the following month’s variable value (It+1). In this study, the Feed Forward Neural Network (FFNN) and Recursive Neural Network (RNN) were applied and tested in the model training. Initially three different training algorithms were applied to train the structures. These were the back-propagation (BP), Levernberg-Marquardt (LM) and Conjugate Gradient (CG) algorithms. From preliminary results, it showed that a three-layer feed forward neural network with different input and hidden neurons was superior in performance, and that the best results were also obtained using the LM training algorithm. Thus the best ANN structure of three-layer feed forward network based on LM training algorithm was adopted for filling in of missing data in this study. The data was first normalized at each station before exporting it into the graphical user interface (GUI) of the MATLAB. This was done by applying the function given in Equation (1) which was adapted from Morid et al. (2007).
Where,
Xn = normalized value
Xmin = the selected minimum value for standardization
Xmax = the selected maximum value for standardization
Xo = original value
xmin = minimum value present in the original data set
xmax = maximum value present in the original data set.
All the input and output values for ANN were normalized to range between Xmin of equal to 0.1 and Xmax of less than 1. According to Morid et al. (2007), the values of the Xmin 0.1 and Xmax of 0.9 perform best for drought indices such as SPI and EDI. Thus these values were adapted for this study. After normalization, the various drought forecasting ranges were determined.
For each of the ANN model run on the graphical user interface (GUI) of the MATLAB performance was evaluated based on the correlation coefficient R and Mean Square Error (MSE) criteria and the best model. The best ANN models were then adopted for filling any missing data for respective hydro-meteorological stations. The steps that were followed in filling the missing data are summarized in Figure 4.
Computation of drought using PDSI
The Palmer Drought Severity Index (PDSI) was developed based on a criterion for determining the beginning and end of drought or wet period spell (Palmer, 1965; Wang, 2010). It is a simple monthly water balance model which requires rainfall, temperature and catchment soil moisture content as input parameters. This tool applies a concept of supply and demand over a two-layer model. In this concept, the difference between the quantity of precipitation needed to maintain a natural water balance level and the actual precipitation is determined. The index does not consider stream flow, reservoir water balance, and other hydro-meteorological variables that influence the drought (Karl and Knight, 1985; Yan et al., 2013a; b). The index has been modified and applied by a number of researchers. For instance Wondie and Terefe (2016) used a self-calibrated PDSI to assess drought in Ethiopia for the period 1901 to 2014).
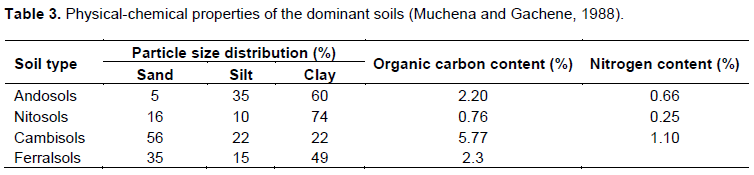
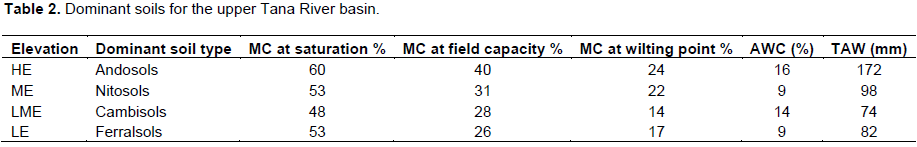
The Palmer Drought Severity Index (PDSI) was computed using precipitation, temperature and the local Available Water Content (AWC) of the soil as the input variables. The available water capacity (AWC) and Total Available Water (TAW) were estimated based on the dominant soil characteristics for the each elevation band of the upper Tana River basin. For the gauge stations within the four partitions of elevation bands, the AWC values adapted for PDSI computation were 172, 98, 74 and 82 mm which were based on values given in Table 2, for defined dominant soil types. Table 3 shows some of the physical and chemical properties of the dominant soils.
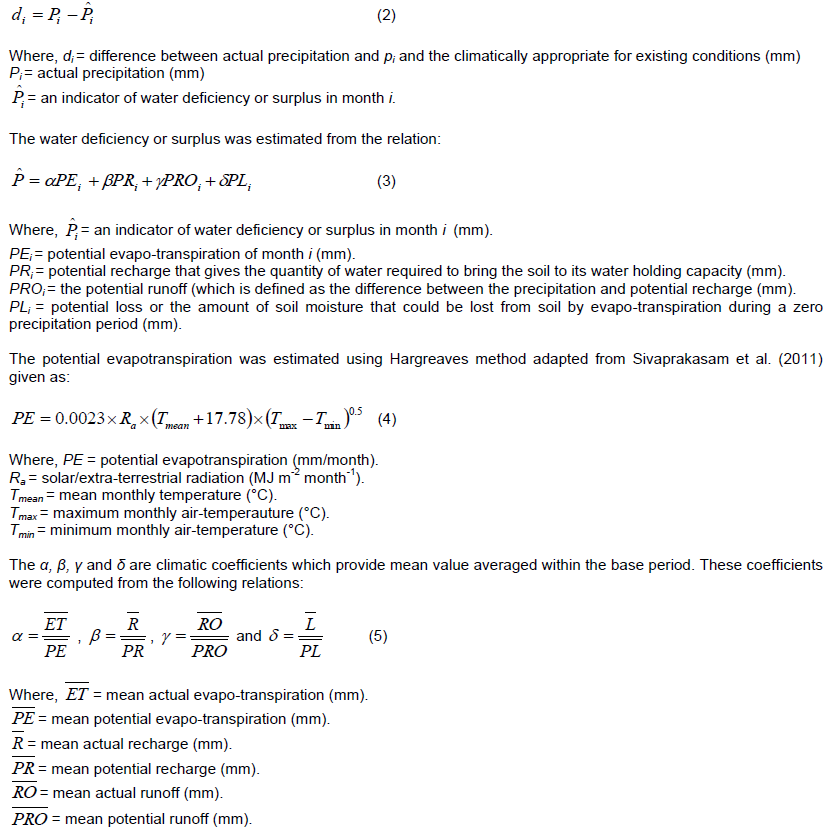
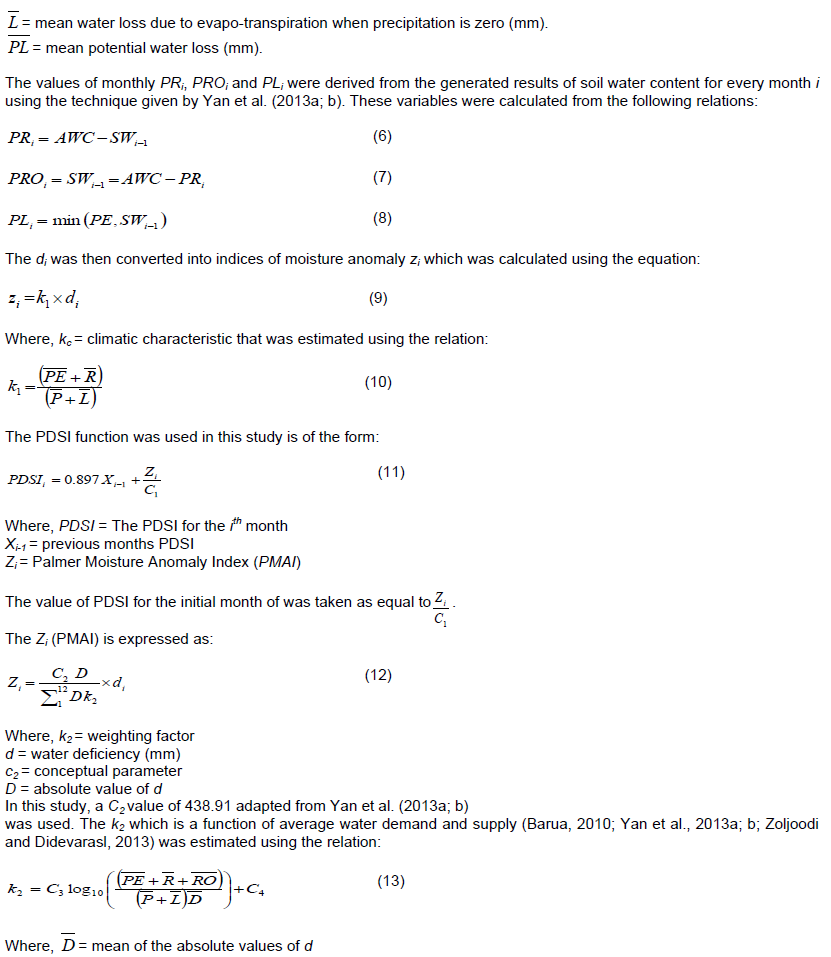
The PDSI was determined by getting the difference between actual precipitation and water deficiency or surplus in any given month i. This was achieved by applying the relation:
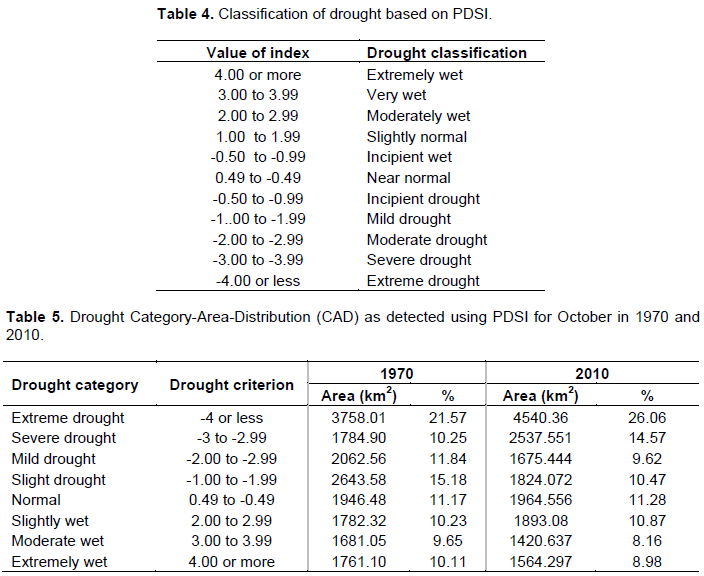
The conceptual parameters C3 and C4 were equated to 1.2459 and 3.3684 respectively adapted from Yan et al. (2013a; b). The computed PDSI values were used to classify drought conditions based on the threshold levels given in Table 4 which was adapted from Palmer (1965) and Castano (2012). The drought severity was computed for 1970 and 2010 based on the severity equation. The area for each severity class was captured using the ArCGIS and summarized in Table 5.
Computation of drought severity
Evaluation of spatial distribution of drought severity
The sum of drought severity (DId) values below zero during each year for the study period was calculated. The probability P of drought occurrence was determined by dividing the number of months that had DI values less than zero by 12 months of the year. The drought severity was then computed at each station using the relation:
Where, S = annual drought severity for a defined year
DId =The sum of drought severity values below zero during a particular year
P = probability of drought occurrence for the defined year
N=period in months in the year (=12 months in this case).
The resulting data was then used to estimate spatial distribution of drought severity using the Krigging estimator in the ArcGIS 10.1. In this study, sixteen hydrometric stations within the upper Tana River basin were used for hydrological evaluation. These stations have unique geographical location and their spatial extent was created through the application GIS. The GIS tool was used to compute and present the spatial distribution, variation and trends of droughts for PDSI.
Temporal drought patterns of the PDSI
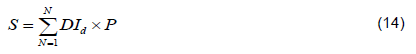
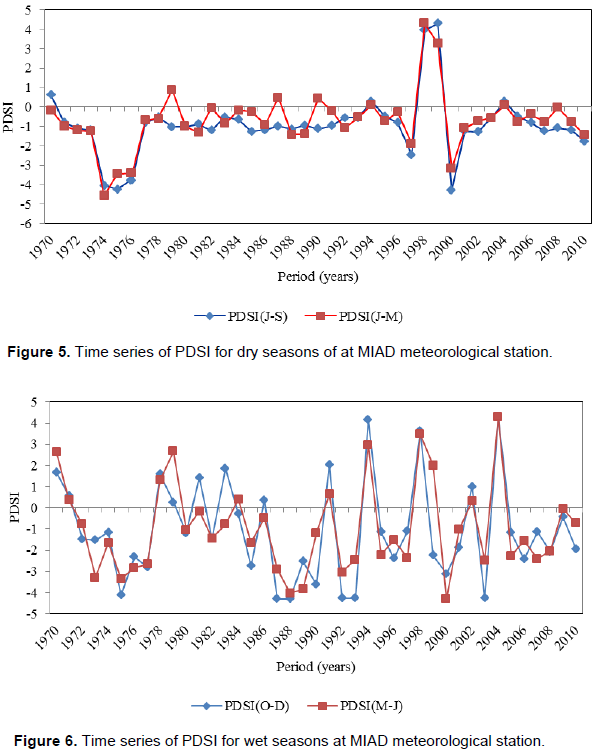
Figures 5 and 6 illustrate the frequencies and duration of integrated seasonal droughts and wet spells as detected by the PDSI. For Figures 5 to 8, within the four decades, moderate (PDSI=-2.00 to -2.99), severe (PDSI=-3.00 to -3.99) and extreme (PDSI=-4 or less) droughts were detected using the PDSI during the dry season in the MIAD station.
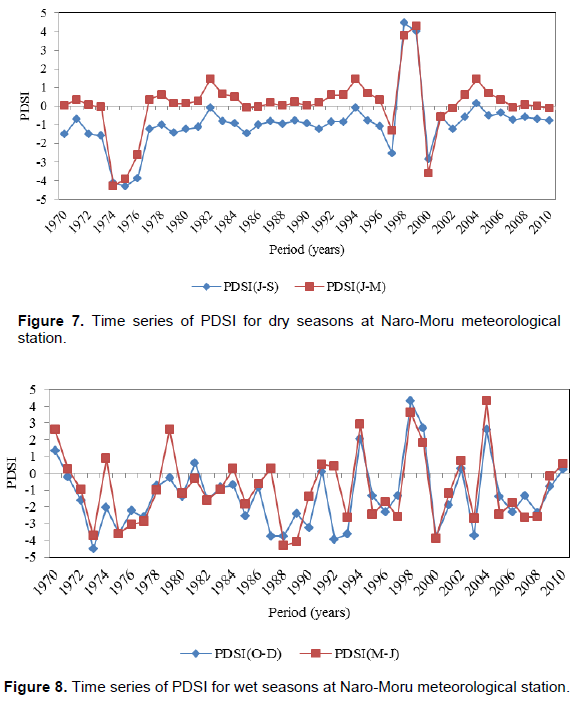
For the Naro-Moru meteorological station, moderate (PDSI=-2.00 to -2.99), severe (PDSI=-3.00 to -3.99) and extreme (PDSI=-4 or less) droughts were detected during the dry season. Figures 7 and 8 that the PDSI time series values for MIAD meteorological station (ID 9037112) located at the lower elevation of the upper Tana River basin are lower than those for the Naro-Moru station (ID 9037064).
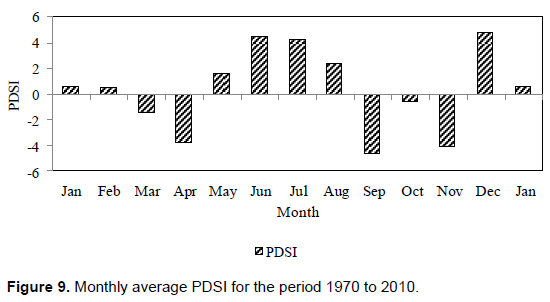
Results of the mean monthly temporal PDSI values indicate that March and April exhibit moderate (PDSI=-0.200) and extreme (PDSI=-4.00) droughts respectively. For the months of September, October and November extreme (PDSI<-4.00), incipient (PDSI=-0.5) and extreme (PDSI=-0.400) droughts are detected annually.
The rest of the months have positive PDSI values indicating wetness of different magnitudes in the river basin (Figure 9).
The area under extreme and severe droughts are 3758.01 (21.57%) and 1784.90 (10.25%) respectively for the year 1970 while the values for 2010 are 4540.36 (26.06%) and 2537.55 (14.57%) respectively as given in Table 6.
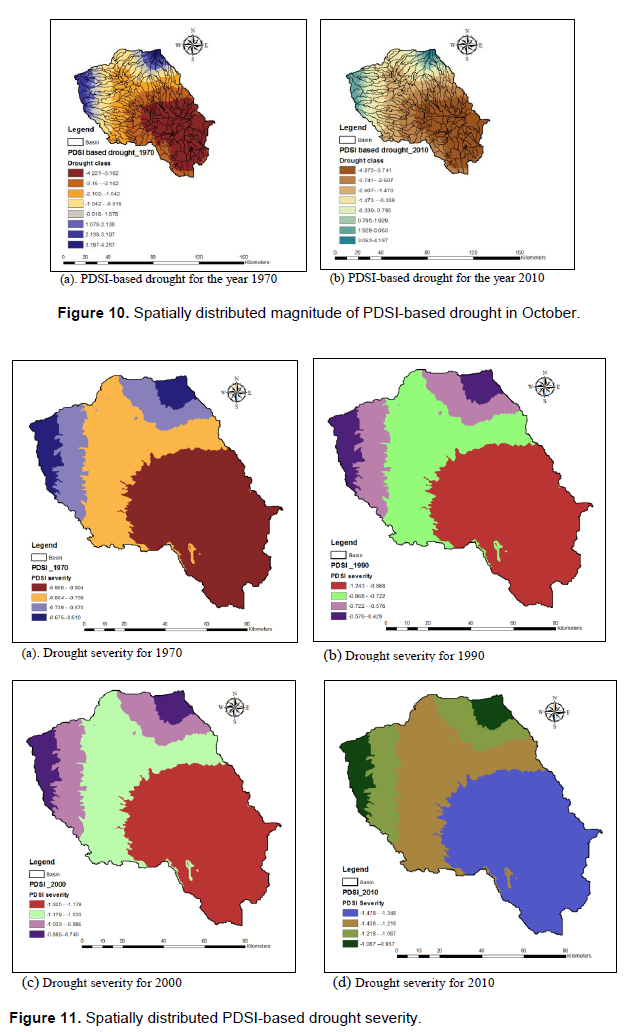
Spatially distributed drought severity based on PDSI
The results of spatially distributed drought severity based
on PDSI show that the ranges of maximum and minimum drought severity values in 1970 are -0.868 to -0.804 and -0.675 to -0.610, respectively.
The spatial and temporal drought was found to significantly change for the period 1970 to 2010. The temporal variability of drought from 1970 to 2010 is described by negative values that indicate droughts of different severity and duration while the positive ones correspond to wet conditions. The findings indicate that extreme drought occurred twice in the four decades. It is observed that for dry seasonal PDSI, the values in the months of January to March (J-M) are constantly higher than the ones for July to September (J-S). By comparing the time series PDSI values for dry and wet seasons for the meteorological stations, it can be seen that the time series plots for the PDSI values for dry season are generally lower than those for the wet seasons. The PDSI time series values for meteorological stations located at the lower elevation of the upper Tana River basin were lower than those for the stations which located at higher elevation. Thus, the PDSI results indicate that the areas within the lower elevations are more prone to drought risks than those in higher elevations. From the results of spatially distributed drought magnitude, there is a general increase in area under the extreme and severe drought as given by PDSI from 1970 to 2010. The distribution of extreme and severe drought categories dominate in the south-eastern parts of the upper Tana River basin while extreme wet and moderate wet conditions dominate the north-western areas. Thus, south-eastern parts of the basin have the highest risk of experiencing high drought magnitudes (Figure 10). However, the north-western areas have the lowest drought risks. Comparing the findings with similar research by Yan et al. (2013a; b) in Luanhe River basin, showed that the lowest PDSI values (PDSI< -4.00) are persistently observed in the north-western areas of Luanhe basin. On the other hand, the south-eastern areas of the upper Tana River basin exhibit similar lowest values of PDSI (PDSI< -4.00). The drought severity gave maximum and minimum drought severity values occurring respectively in the north-western and south-eastern areas of the basin. The maximum and minimum severity values increased from -1.478 to -1.348 and from -1.087 to -0.957 in 2010 as presented in the results. There was an increase in drought severity over the years of record (Figure 11). The trend in spatial PDSI severity values overtime compared closely with the spatial patterns trend explained as by Zoljoodi and Didevarasasl (2013). For instance, these authors showed that the PDSI severity values increased from -1.28 (1951-2005) to -7.68 (1999-2002) in Iran. In comparison with the present study, the results show that the PDSI increased from the range -0.675 to -0.610 in 1970 and from -1.087 to 0.957 in 2010 for the north-eastern areas of the upper Tana River basin. Thus, the findings can be used in decision making especially in prioritized drought mitigation measures within the river basin.
Spatial distribution of drought indicates that south-eastern parts of the basin are the most susceptible to droughts while the north-western areas are least prone to the droughts. From the results of spatially distributed drought magnitude, it can be seen that there is a general increase in area under the extreme and severe drought as given by PDSI from 1970 to 2010. The application of the PDSI reflects the spatial heterogeneity and temporal variability of drought across the upper Tana River basin. The drought assessment from this study offer technical approach for comprehensive understanding of drought for effective drought-induced disaster mitigation and its management, with a view to reducing adverse effects on livelihoods in the river basin. The findings show that the lowest PDSI values (PDSI< -4.00) are persistently observed in the north-western areas of upper Tana River basin. On the other hand, the south-eastern areas of the upper Tana River basin exhibit similar lowest values of PDSI (PDSI< -4.00). By comparing the time series results of PDSI for dry and wet seasons indicate that the temporal drought detected by PDSI values for dry season are generally lower than those for the wet seasons. The results of the study can be incorporated in drought early warning system and reduce adverse impacts of drought on water resources, ecosystems and peoples livelihoods.
The authors have not declared any conflict of interests.
REFERENCES
|
Barua S (2010). Drought assessment and forecasting using a non-linear aggregated drought index, PhD thesis, Victoria University, Australia.
|
|
|
|
Belayneh A, Adamowski J (2013). Drought forecasting using new machine learning methods. J. Water Land Dev. 18(I-IV):3-12.
|
|
|
|
|
Belayneh A, Adamowski J (2012). standard precipitation index drought forecasting using neural networks, wavelet neural networks and support vector regression. J. Appl. Comput. Intell. Soft Comput. 18(I-IV):3-12.
|
|
|
|
|
Bonal D, Burban B, Stahl C, Wagner F, Hérault B (2016). The response of tropical forests to drought-lessons from recent research and future prospects. Ann. For. Sci. 73:27-44.
Crossref
|
|
|
|
|
Castano A (2012). Monitoring drought at river basin and regional scale: application in Sicily, PhD Dessertation in Hydraulic Engineering, University of Catania, Italy.
|
|
|
|
|
Hunink JE, Immerzeel WW, Droogers P (2009). Report on green water credits for the upper Tana River Basin, Kenya Phase II-Pilot operations biophysical assessment using Soil and water assessment tool SWAT.
|
|
|
|
|
IFAD (2012). Upper Tana catchment natural resource management project report, east and southern Africa division, project management department.
|
|
|
|
|
Jacobs J, Angerer J, Vitale J, Srinivasan R, Kaitho J, Stuth J (2004). Exploring the Potential Impact of Restoration on Hydrology of the Upper Tana RiverCatchment and Masinga Dam, Kenya, a Draft Report, Texas A & M University.
|
|
|
|
|
Karamouz M, Rasouli K, Nazi S (2009). Development of a hybrid index for drought prediction: case study. J. Hydrol. Eng. 14(6):617-627.
Crossref
|
|
|
|
|
Karamouz M, Szidarovszky F, Zaharaie B (2003). Water resources systems analysis, Lewis Publishers, Florida, U.S.A
|
|
|
|
|
Karl TR, Knight RW (1985). Atlas of monthly palmer hydrological drought indices for the continuous United States, Asheville, N.C USA national climatic data centre, climatology series (3-7) report.
|
|
|
|
|
Loucks DP, van-Beek E (2005). Water resources systems planning and management, an introduction to methods, models and applications, studies and reports in hydrology, UNESCO publishing Paris.
|
|
|
|
|
Mishra AK, Singh VP (2010). A Review of Drought Concepts. J. Hydrol. 391(1-2):202-216.
Crossref
|
|
|
|
|
Morid S, Smakhtin V, Bagherzadeh K (2007). Drought forecasting using artificial neural networks and time series of drought indices. Int. J. Climatol. 27(15):2103-2111.
Crossref
|
|
|
|
|
Muchena FN, Gachene CKK (1988). Soils of the highland and mountainous areas of Kenya with special emphasis on agricultural soils, http: //wwwjstor.org, accessed on 25th May 2017.
|
|
|
|
|
Palmer WC (1965). Meteorological drought research paper 45, weather Bureau, Washington D.C, U.S.A.
|
|
|
|
|
Quiring SM, Papakryiakou TN (2003). An evaluation of agricultural drought indices for Canadian prairies. Agric. For. Meteorol. 118(1-2):49-62.
Crossref
|
|
|
|
|
Sivaprakasam S, Murugappan A, Mohan S (2011). Modified Hangreaves equation for estimation of ETo in a hot and humid location in Tamilnadu state, India. Int. J. Eng. Sci. Technol. 3(1):592-600.
|
|
|
|
|
UNDP (2012). Kenya, adapting to climate variability in arid and semi-arid lands, project report on risks posed by climate variability to delivery of water framework directives, Environ. Int. in press.
|
|
|
|
|
Wang W (2010). Drought analysis under climate change by application of drought indices and copulas, MSc thesis in Civil and Environmental Engineering, Portland State University.
|
|
|
|
|
Wondie M, Terefe T (2016). Assessment of drought in Ethiopia by using self-calibrated Palmer Drought Severity Index. Int. J. Eng. Manage. Sci. 7(2):108-117.
|
|
|
|
|
WRMA (2010). Physiological survey in the upper Tana catchment, a natural resources management project report, Nairobi.
|
|
|
|
|
Yan DH, Wu D, Huang R, Wang LR, Yang GY (2013a). Drought evolution characteristics and precipitation intensity changes during alternating dry-wet changes in Huang-Huai-Hai River basin. J. Hydrol. Earth Syst. Sci. 10:2665-2696.
Crossref
|
|
|
|
|
Yan D, Shi X, Yang Z, Li Y, Zhao K, Yuan Y (2013b). Modified palmer drought severity index based on distributed hydrological simulation. J. Math. Problem Eng. 2013:1-8.
Crossref
|
|
|
|
|
Zoljoodi M, Didevarasl A (2013). Evaluation of Spatio-temporal variability of droughts in Iran using Palmer Drought Severity Index and its precipitation factors through (1951-2005). Atmos. Clim. Sci. J. 3:193-207.
|
|