Full Length Research Paper

ABSTRACT
In tropical Sudan climate regions, agricultural activities are often affected by increasingly frequent extreme climate events (floods, droughts). With regard to current climate manifestations, this study aimed at assessing agricultural risks in the rural communities of Oti I and II. The analysis of daily, monthly and annual rainfall and temperature data for the period from 1961 to 2020 enabled to identify the risks faced by farmers in the research area. Indeed, the start (19 and 18th May, respectively at Dapaong and Mango) and end (20th October at Dapaong and 16th October at Mango) dates of the cropping seasons and the climate indices have been determined. The climate risks identified are extreme rainfall and temperature, high winds and the instability of the rain-cropping seasons characterized by uncertainty in the start (false starts), rainfall breaks, early ends and reduction of wet seasons which compromise the efficiency of agricultural activities. The coefficient of variation (CV) is 12.9% in Mango and 13.5% in Dapaong. It clearly indicates that the rural populations of the research area face a notorious irregularity in rainfall during the cropping season. In addition, water erosion of the soil also influences crop yields. From one year to another, all these manifestations hinder the normal progress of the various agricultural activities carried out in the study area. Consequently, the reduction of the crop production with high risks of increases in the prices of foodstuffs was observed.
Key words: Climate, food shortage, drought, cropping season, communities.
INTRODUCTION
Already under natural climate change, tropical monomodal climatic areas are exposed to many climatic risks due to changes in meteorological conditions recorded over the past few decades. These risks are increasing more and more and have negative impacts on Africa where crop production relies fundamentally on the climate (Houndenou, 1999). In this perspective, Yabi and Boko (2008) posit that life of agriculture and socio-economic systems in tropical latitudes is particularly linked to the development of the rainfall climate parameter. The socio-economic activities carried out in Togo are also dependent on these climatic events. It is also observed that at the national level, crop production is impacted by the deterioration of the rainy season of the 1960s (Adewi et al., 2008). Therefore, food security is challenged by repeated rainfall recessions. Apart from these phenomena, other natural disasters in addition to the 2008 floods recorded in southern Togo are corollaries.
In the savannah region, the impacts of climate risks are highly remarkable due to the progression of aridity, the high fragility of ecosystems, the low standard of living and the vulnerability of rural populations (Badameli, 2010). The dry seasons are becoming longer and longer to the detriment of the rainy seasons with high temperatures (Adewi, 2012). Indeed, in this region, the irregularity of rainfall associated with the decline in soil fertility has negative consequences on the level of agricultural profitability and therefore compromises the development of farmers (Lamboni, 2017). The municipalities of Oti I and II, which constitute the study areas, are located in this climatic environment. This part of the Savannah Region is noticeable by its almost flat topography (1 to 5%) with altitudes below 200 m. Consequently, it does not favor the runoff of rainwater (Laré, 2008) cited by Djame (2019). This flat area favors the stagnation of water and consequently the risk of flooding of agriculture land and the destruction of human settlements. In addition, it is a warmer environment than the surrounding localities with average temperatures of around 34.94°C at the Mango station. With these climatic conditions, the study area records a high frequency of precipitation and temperature extremes. Moreover, the high frequency of precipitation and the stagnation cause soil degradation. From their level of intensity, these different manifestations constitute major risks which increase the ambiguity of the agricultural incomes of the rural populations of the study area. This work therefore has the interest of diagnosing the risks related to the climatic context and their agricultural impacts in the Oti prefecture.
Study area
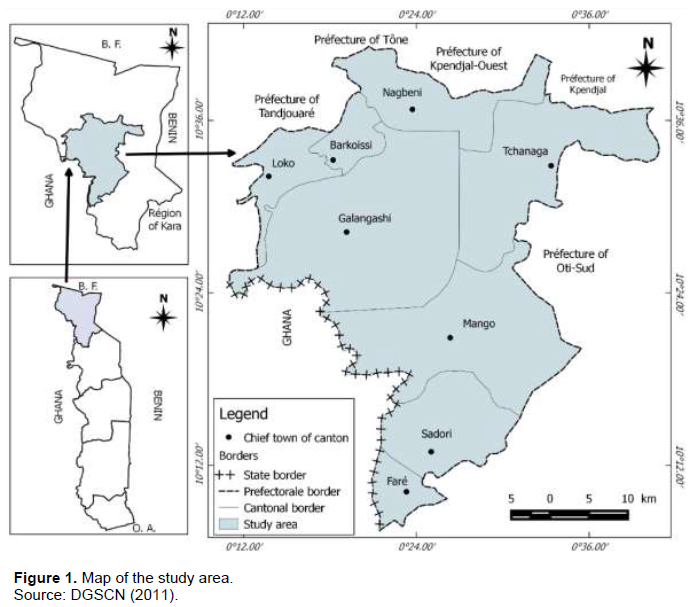
Covering an area of 4313 km2, that is, 50.92% of the total area of the region, the prefecture of Oti is located between a latitude of 10°06' and 10°40'N and a longitude of 0°10' and 0° 40'E (Figure 1). It is bordered to the north by the prefectures of Tandjouare, Tône, Kpendjal-Ouest and that of Kpendjal, to the West by the Republic of Ghana, to the East and to the South by the prefecture of Ôti-Sud.
METHODOLOGY
The data collected are the rainfall amounts from Dapaong and Mango meteorological stations over the period 1961-2020. These two stations were chosen for this study because of their synoptic character, so the meteorological parameters collected are valid over a radius of 25 km.
These include daily, monthly and annual rainfall amounts and temperatures over the period 1961-2020. These climatic parameters were extracted from the file of the Togolese Meteorological Agency (DGMN). The choice of the study period (1961-2020) is motivated by the effects of climate change observed on rural communities in the Savannah Region of Togo and to analyse it, a long data series is needed, at least thirty years.
The data analysis took into account the frequency determination of the dates of the start and end of the growing seasons and the calculation of climatic indices.
Determination of the start and end dates of the growing seasons
While considering the criteria in the determination of the beginnings and ends of the rainy seasons (Adewi, 2012; Tidiane, 2003; Yabi et al., 2013), the date of the start of the growing season (DSC) in the study area is after the 1st April when the amount of rain collected in three consecutive days is at least equal to 20 mm and when no dry period of more than seven days occurs during the following 3 consecutive decades. A start is considered late when it takes place at least 2 pentads after the average date. As for the date of the end of the growing season (FSC), it occurs after October 1 when there is no more precipitation for at least 4 following consecutive pentads. An end is considered early when it takes place at least 2 pentads before the average date. The length of the cultivating season (LSC) corresponds to the difference in days between the end and start dates of the agricultural season.
Coefficient of variation
The coefficient of variation is a type of measure of dispersion. A measure of dispersion is a quantity that is used to gauge the extent of variability of data. Thus, the coefficient of variation is used to measure the dispersion of data from the average or the mean value. This is given by the following formula:
CV= (α/µ)×100
where α: standard deviation and µ: mean.
Method for calculating climate index
The distinction of the years with extreme precipitations and temperatures as well as their frequencies was carried out. Thus, the calculation of climate indices was performed using the RClimDex 1.1 software. This software allows the calculation of basic indices and detection of changes in climate parameters. They have been chosen for the detection and monitoring of several aspects of climate change at the global level in order to assess the potential impact on activities related to agriculture, the economy and the environment. The indices listed in Table 1 were used in this study. They were calculated for the two synoptic stations (Mango and Dapaong) of the study area.
The indices recorded in Table 1 allowed the analysis of climate risks. It is based on the homogenization and quality control of data that RClimDex software was used, a process for detecting recorded errors that may exist in daily data. This version of RClimDex has been developed under R 1.84 and implemented in the R software. So, to use RClimDex, we first loaded the RClimDex, then performed quality control on the data and finally calculated the indices.
RESULTS
The different analyses were made according to the scales of the different indices and the occurrences of the beginnings and ends of the growing seasons.
Minimum and maximum temperatures at the 90th percentile
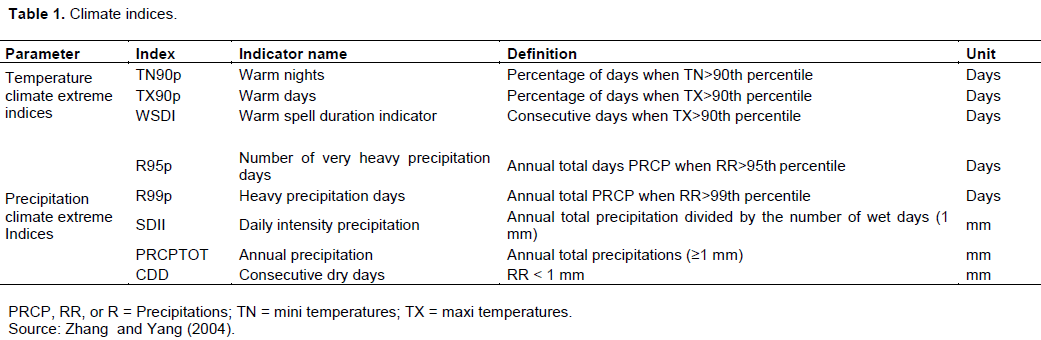
Figure 2 shows the evolution of the minimum and maximum temperature indices (TN90P and TX90P) at the 90th percentile recorded in the study area over the period 1961-2020. The interannual variation over the period from 1961 to 2020 (Figure 2) of the daily indices of TN90P and TX90P indicated upward trends with P-values of 0.38 and 0.33, respectively at the Mango station and 0.25 and 0.03 at the Dapaong station. Though the slope of TN90P and TX90P had a major effect at the Mango station, this was not the case at the Dapaong station. Indeed, at this station, the decrease of TN90P was not significant with a P-value of 0.5 which was therefore greater than 0.05. In short, it appeared that for all the thermal values, only the extremes have experienced a regular increase over the period between 1961 and 2020.
The evolution of these daily extremes associated with the 90th percentile showed that at the Mango station, the TN90P fluctuated between 0 and 31.42°C in 2019 while for TX90P, this variation went from 0 to 28.64°C recorded in 1998. At the Dapaong station, the values ??of TN90P were recorded rather in 2005 and ranged from 0 to 31.42. The TX90P of this station oscillated between 0.47°C (2012) and 30.62°C (1977). This increase in TN90P and TX90P in the study area showed a warming that resulted in an increase in hot days and hot nights. It could probably lead to drought due to the acceleration of evapotranspiration and rapid drying of cultivated land. All these phenomena also caused an acceleration of the risk of the available water reduction for different crops. Consequently, there were lower agricultural yields. Beyond these indicators on temperature extremes, the analysis of the associated consecutive hot day indices was carried out at the 90th percentile (TX90th).
Number of consecutive warm days at TX > 90th percentile
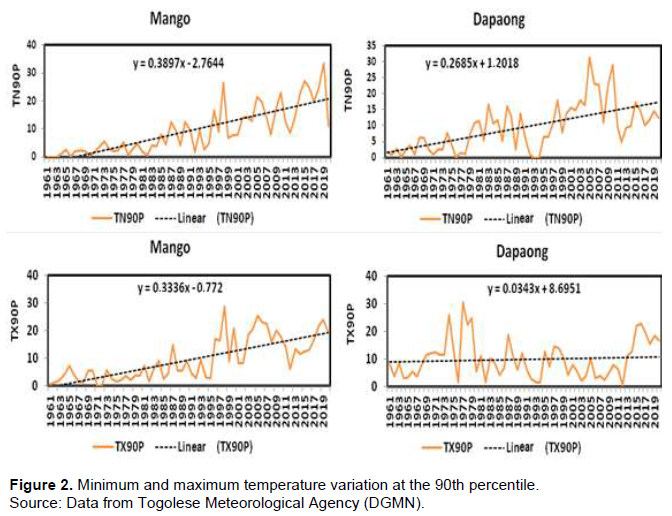
Figure 3 shows the warm sequence indicator or number of consecutive days per year with maximum temperatures above the 90th percentile (WSDI) over the period 1961-2020. The interannual evolution of warm days associated with the 90th percentile (Figure 3) indicated an upward trend in these days over the series of observations at the two stations. This increase was expressed by the positive values of the slope on the linear regression line at Mango (0.16) and Dapaong (0.05). This increase was high in Mango with a p-value of 0.016. On the other hand, this increase was not significant in Dapaong since the p-value (0.32) was higher than 0.05. At the Mango station, 1998 was an exceptional year because it recorded the greatest number of days (52 days) where the maximum temperature was above the 90th percentile. At the Dapaong station, 1977 was the year when daily maximum temperatures were above the 90th percentile threshold with a total of 29 consecutive warm days. The high frequency of these extreme thermal days above the 90th percentile was undoubtedly a risk that leads to the poor progress of the different development phases of certain crops grown in the Oti prefecture. The diagnosis of risks related to rainfall extremes associated with the 95 and 99th percentile highlighted certain events that deserve to be studied.
Evolution of rainfall extremes at the 95 and 99th percentile
Figure 4 shows the evolution of rainfall amounts associated with the 95 and 99th percentile in the study area over the period between 1961 and 2020. The analysis of the evolution of the rainfall associated with the 95th percentile from 1961 to 2020 made it possible to determine the very wet periods of this series. At the 95th percentile, these rainfall amounts varied from 0 to 470.3 mm at the Mango station and from 0 to 913 mm at the Dapaong station. There was a decrease in these rainfall amounts in Mango with a decrease of -0.58. On the other hand, in Dapaong, this trend was on the rise with a slope value of 1.52. These exceptional rainfall events varied from day to day and from year to year. The rainfall amounts associated with the 99th percentile (Figure 4) calculated from 1961 to 2020 corresponding to the annual accumulations of daily precipitation above the 99th percentile and representing extremely wet days. The interannual evolution of rainfall associated with the 99th percentile varied from 0 to 470.3 mm in Mango and 0 to 913 mm in Dapaong with respective averages of 223.62 and 82.92 mm. For example, 2007 in the Mango station and 2002 in the Dapaong station were exceptional years of rain over the study period with, respectively 470.3 and 913 mm of precipitation. However, there was an upward trend in rainfall amounts associated with the 99th percentile at Mango and Dapaong with positive values. It should be noted that this linear increase at the level of the two stations was not significant since the p-values were higher than 0.05.
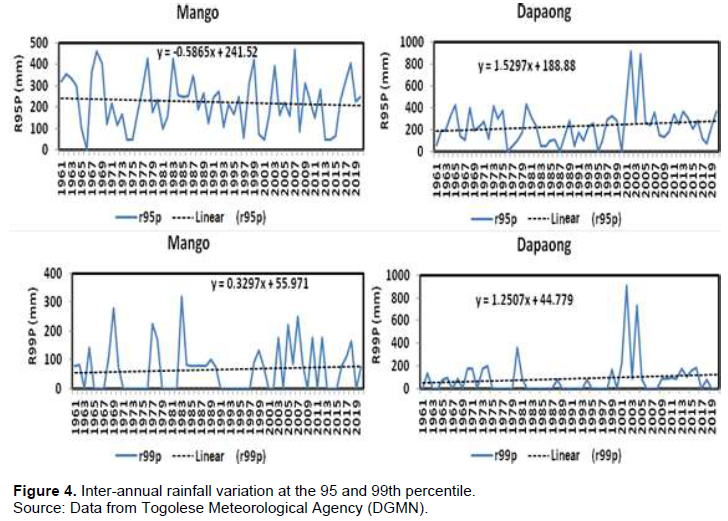
These rainfall extremes generated high risks of flooding which led to the loss of crops as the consequence of water stagnation in the fields of crops, asphyxiation of the plants of the different crops with, rotting of their roots and allocation of certain crops. In this regard, the risk analysis in relation to the indices of cumulative annual precipitation deserved to be declined.
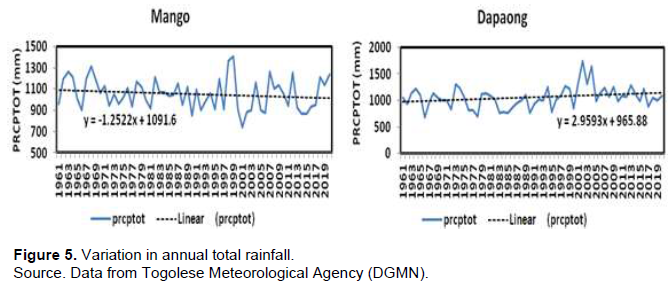
Variability of interannual precipitation accumulations
The temporal variability of the indices of annual wet-day precipitation (PRCPTOT) from 1961 to 2020 in the Oti Prefecture is as shown in Figure 5. In the Mango station, the annual total wet-day precipitation (PRCPTOT) was declining with a -1.25 value and that varies from 740.3 to 1407.8 mm. This decrease was marked by low significance with a p-value of 0.25. On the other hand, at the Dapaong station, there was an increase trend in PRCPTOT with a slope value of 2.95 and a p-value of 0.049. With regard to p-value that was greater than 0.05, there was a very significant increase. In Dapaong, the evolution of the PRCPTOT varied from one year to another with values between 683.1 and 1751.1 mm. The upward trend in PRCPTOT values justifies the recurrence of floods in the study area, while the downward trend reflects periods of drought. The years 2007 (1262.5 mm), 2012 (1255.8 mm) at the Mango station and 2002 (1751.9 mm), 2004 (1639.5 mm) and 2001 (1322.7 mm) at the Dapaong were illustrations of periods of flooding. The case of droughts was observed during the 1970s and 1980s in both stations. This was the example of 1977 (932.2 mm), 1981 (919.6 mm) and 1990 (848 mm) in Mango and 1966 (683.1 mm), 1978 (706.2 mm), 1983 (770 .9 mm) in Dapaong. In either case, the risks of agricultural activities going badly are high. Daily rainfall intensity indices present climate risks.
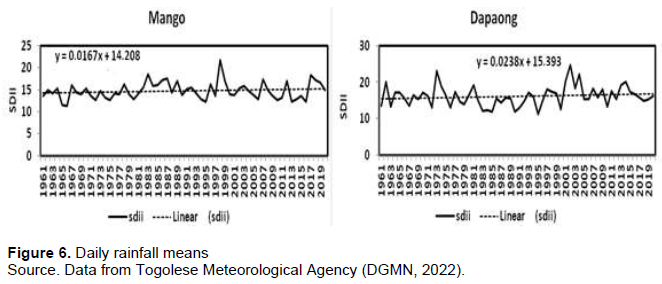
Variability of daily rainfall intensity
The analysis of Figure 6 shows the interannual variability of the daily precipitation intensity index in Mango and Dapaong over the period 1961-2020. Figure 6 shows that the frequency of daily rainfall intensity indices was increasing at the Mango and Dapaong stations with slope values of 0.01 and 0.023, respectively. This increase turned out to be less significant with almost negligible slope values. The slight increase in the daily intensity of precipitation was the result of a situation of return of intense rains over the past three decades. Indeed, over the past three decades, year 1998 and 2013 presented an exceptional situation with daily rainfall intensities ranging from 12.2 to 21.7 in Mango. In Dapaong, these intensities were between 13.3 and 24.7 during the years 2010 and 2002. These indices were important in the analysis of floods because they allowed an examination of the average heavy rainfalls since cumulative rainfall can cause flooding. The high frequency of daily rain intensity was detrimental to the efficiency of the different phases of crop development.
Seasonal variation in the number of consecutive dry days (CDD)
Figure 7 shows the number of consecutive dry days in Mango and Dapaong over the study period (1961-2020).
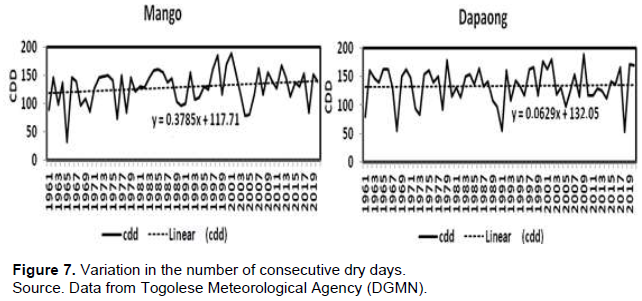
The interannual evolution of the number of wet days less than 1.0 mm showed an increasing trend in the number of consecutive dry days. This increase was more noticeable in Mango with a statistically significant slope with a value of 0.37 (P-value ≥ 0) while in Dapaong it was 0.06. The number of dry days varied from year to year and from station to station. Indeed, these days varied from 32 to 189 in Mango and 53 to 189 days in Dapaong. It should be noted that the increase in CDD was more remarkable from the beginning of 1997 until 2020 at the level of the two stations. This situation generated high risks of occurrence of zones of drought over the different periods of the growing seasons and therefore on the different phases of crop development. It provoked lower agricultural yields compared to predictions in the normal climate context.
Analysis of risks related to the progress of the cropping season
The start and end date of the cropping seasons were important parameters in the planning of agricultural operations, particularly sowing. Table 2 presents a summary of the frequencies of the start and end dates of the agricultural season.
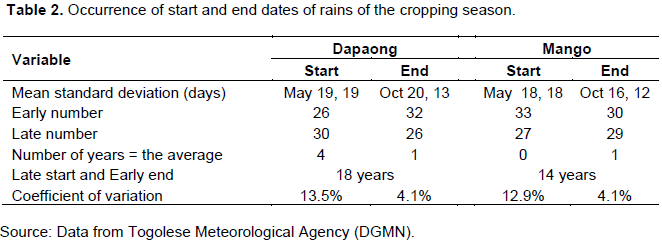
With regard to the data in Table 2, the cropping season had a variable start and end from one station to another. In an average situation, May 19 and 18 were, respectively the start dates of the growing seasons at the Dapaong and Mango stations. These mean starts observed in the 4th pentad of the month of May were not only very late but also concealed many disparities which made complex the predictions of the starts of sowing by farmers.
For both stations under study, the coefficient of variation was between 12 and 14% for the start of the cropping season. These values were at least three times higher than at the end of the season (4.1%). It showed that the FSC was more stable than the DSC in the investigated series. The same was true for the standard deviations at the start of the cropping season, which were 19 and 18 days, respectively at the Dapaong and Mango stations. These values were still clearly higher than those of the standard deviations at the end of the cropping season as indicated in Table 2. It also corroborates the relative stability of the dates for the end of the wet season. It was therefore the instability of the dates of the start of the cropping season that indicates more risks with false starts that are increasingly observed and which causes loss of seedlings and re-sowing.
As far as the early start and end dates were concerned, the Dapaong station recorded 26 years of early rain starts. The number of years with late starts was 21 while the years with late ends were 31. The Dapaong station recorded 50% of these cases and was therefore marked by more irregularity in the late starts of the cropping seasons. The climate risks hanging over agricultural activities in the study area were consequently genuine. The late start and early end of wet seasons reduced the length of cropping seasons. Some cultures failed to complete their normal development cycle. This situation affected crop.
DISCUSSION
The analysis of climate phenomena based on precipitation and temperatures helped to assess climate risks in Oti I and II communities. The direct climate risks observed are floods, droughts, violent winds, etc. In addition, there was an irregularity of the rainy-crop seasons. Indeed, the high risks of “false starts” following rainfall breaks lead to dry sequences that can reach or even exceed three pentads. The effective starts of the rains are not often well determined. These circumstances lead to a high risk of seed loss. The early ends and the shortening of the crop season are also agro-climatic parameters which induce risks of disruption of the development phases of the various agricultural speculations. These results are similar to those of the work of Badameli (2010) and Adewi and Kadouza (2012) which confirm the changes in the course of the cropping season in the Savannah and Central Region. According to the FAO (2008), the climate phenomena are due to global warming which modifies the meteorological conditions with an increase in frequency and intensity of extreme climate events. The analysis of precipitation indices clearly shows that the trend of cumulative annual total wet-days (PRCPTOT) is decreasing in Mango with a P-value of 0.25. On the other hand, at the Dapaong station, the PRCPTOT follows an upward trend with a P-value of 0.049. The rainfall amounts at the 99th percentile show an upward trend at the two synoptic stations during the period from 1981 to 2020. The same phenomenon applies for the number of consecutive dry days (32 to 189 days in Mango and 53 to 189 days in Dapaong). This trend analysis was also carried out by Koudamiloro et al. (2016) in the Ouémé watershed in Benin. These authors have been able to show from the quartiles that the maximum rainfall in the Ouémé watershed most often leads to strong runoff which carries away the seedlings and destroys the crops. The results obtained in this study also show that the farmers of the communities of Oti I and II face the complex problem of increasingly frequent floods which devastate their crops.
CONCLUSION
The ever increasing and frequent extreme climate events (floods, droughts) constitute risks feared by farmers of the municipalities of Oti I and II. The analysis of rainfall and temperature data from the Mango and Dapaong stations has identified the occurrences of consecutive dry days ranging from 32 and 189 days over the period 1961-2020. It has become a high risk that can interrupt the efficiency of the crop cycle. The study has shown that the high frequency of dry sequences is maintained by a regular increase in thermal extremes with P-values of 0.33 and 0.03, respectively at Mango and Dapaong. But, it has been observed that the intensity of daily rains has been slightly increasing for the last three decades from 1961 to 2020 as it can be observed from the data of 1988 with 12.2 and of 2013 with 21.7 in Mango. In Dapaong, it is rather the years 2002 and 2010 that recorded respective index values of 13.3 to 24.7. These values reflect the regularity of heavy rainfalls observed across the Savannah Region. These heavy rainfalls increased the risk of flooding of crops and consequently the decline in crop yields.
CONFLICT OF INTERESTS
The authors have not declared any conflict of interests.
REFERENCES
|
Adewi E (2012). Dérèglement climatique et élevage dans la Région des Savanes à l'extrême Nord-Togo. Revue Sciences de l'environnement (9):87-107. |
|
|
Adewi E, Badameli Ksm Et Dubreuil V (2008). Evolution des saisons des pluies potentiellement utiles au Togo de 1950 à 2004. Association Internationale de Climatologie (21):73-78. |
|
|
Adewi E, Kadouza P (2012). Perception paysanne de la crise pluviométrique dans la Région Centrale du Togo. Revue de Géographie AH?H?. Université de Lomé 9(6):30-41. |
|
|
Badameli KSM (2010). Impact du changement climatique actuel sur les saisons culturales dans la Région des Savanes du Nord-Togo. |
|
|
Across Disciplinary Boundaries, publication of the ITECOM Academy Presse, Dakar (Sénégal), pp. 131?153. |
|
|
Djame Y (2019). Environnement et maladies tropicales : l'exemple du paludisme dans la Région des Savanes au Nord-Togo. Thèse de doctorat de géographie, Université de Lomé, 355p. |
|
|
DGSCN (2011). Quatrième recensement de la population et de l'habitat du Togo. Du 06 au 21 novembre 2010. Togo, résultats prioritaire, 72p. |
|
|
FAO (2008). Changement climatique, énergie et alimentation. Conférence sur les nouveaux défis. Rôme, 38p. |
|
|
Houndenou C (1999). Variabilité climatique et maïsiculture en milieu tropical humide : L'exemple du Bénin, diagnostic et modélisation. Thèse de Doctorat Unique de Géographie. Université de Bourgogne, Centre de Recherche De Climatologie, 381p. |
|
|
Koudamiloro O, Dipama J-M, et Vissin EW (2016). Caractérisation des phénomènes hydroclimatiques extrêmes dans le bassin versant de l'Ouémé à l'exutoire de Bétérou au Bénin (Afrique de l'Ouest). Colloque en Hommage au Professeur Michel BOKO (1):305-317. |
|
|
Lamboni T (2017). Adaptations paysannes dans un contexte de variabilité pluviométrique dans la Région des Savanes (Nord-Togo). Thèse de doctorat de géographie, Université de Lomé, 320p. |
|
|
Lare YL, (2008). Lutte antiérosive et contraintes socio-économiques dans la Région des Savanes du Nord-Togo. Sécheresse 19(2):103-114. |
|
|
Tidiane S (2003). La variabilité climatique et ses conséquences sur l'environnement et les activités humaines en Haute-Casamance .Thèse de doctorat, Dakar, UCAD, 295p. |
|
|
Yabi I, Et Boko M (2008). Répartition spatio-temporelle des pluies au Bénin en 2005 : Analyse, implications agricoles et sociales. Association Internationale de Climatologie (21):551-556. |
|
|
Zhang X Et Yang F (2004). Climate Research Branch Environment, Downs view (ON), Canada, 23p. |
|
Copyright © 2024 Author(s) retain the copyright of this article.
This article is published under the terms of the Creative Commons Attribution License 4.0


