ABSTRACT
Over the years, erratic rainfall pattern coupled with increasing population has led to the reliance on groundwater as an alternative and sustainable source for crop irrigation to meet increasing food demand. Irrigation of crops though essential, if not done with care through good practices and use of quality water can lead to soil salinization and ecological unsustainability. This study was carried out to assess the salinity of groundwater used for irrigation in three sub catchments in the Upper Athi River Basin of Kenya. Stratified random sampling technique was used to select representative boreholes and shallow wells for the study. In all, water from 17 boreholes and 17 shallow wells spread across the study area were sampled and analysed for selected physico-chemical properties. Standard methods were used for all the laboratory analysis; temperature, pH and electrical conductivity (EC) of water samples were measured in the field. The results obtained were compared with FAO Water Quality Guidelines for Irrigation. pH ranged from 4.2 to 7.13 indicating weak acidity with about 75% samples falling below lower guideline value. EC values ranged from 467 to 1328 μS/cm which were within FAO and NEMA permissible limits for irrigation purposes. All salts ions were within permissible irrigation water suitability standards except CO3-, Cl and K+. 97% samples had above the recommended carbonate concentrations while 80% had more potassium than the recommended value with the remaining 20% being boreholes. In relation to chloride concentrations, samples from shallow wells are not suitable for sprinkler irrigation since they were above the recommended levels; however, 58% were suitable for surface irrigation. For the boreholes, chloride concentrations were suitable for both surface and sprinkler irrigation. In conclusion, the boreholes had less ions as compared to shallow wells. This research may serve as a preliminary study to provide baseline information that may direct future water quality assessment studies in the study area.
Key words: Irrigation, groundwater quality, boreholes, shallow wells, physico-chemical quality, salinity, sodicity.
Water scarcity for crop irrigation has been considered as a global problem. Irrigation water, irrespective of its source whether diverted from springs, pumped from wells or diverted from streams directly, do contain some amount of chemical substances in solution which has the potential to degrade the quality of soils and reduces crop yield (Banderi et al., 2012). All irrigation waters contain soluble salts and this has become a noted problem associated with farm lands irrigated in arid regions of the world with about one third of agricultural lands becoming saline and this extends to more than one hundred countries of different climates (Squires and Glenn, 2004). Land degradation has been estimated to be about 65% of agricultural lands in Africa, 45% in South America, 74% in Central America and 35% in Asia (CGIAR, 2003). According to Ghassemi et al. (1995), an estimated 1.2 tonnes of salt is added to every hectare of soil per year from irrigation activities.
In Kenya, approximately 40% (25 million hectares) of the land have high salt concentrations (Wanjogu et al., 2004). According to Mugwanja et al. (1995), 26,000 hectares of irrigated soils in Kenya are considered ‘salts-affected’ due to poor quality of water, poor drainage and irrigation management systems, especially in areas with high or increasing ground water tables. Arid and semi-arid lands cover approximately 80 to 83% of the country and receive less than 700 mm rainfall per year which is erratic, poorly distributed and cannot reliably support rain fed agriculture (Ndegwa and Kiiru, 2009). Irrigation schemes in the country have been abandoned after less than twenty years of operation due to salinization and many more will follow if preventive and mitigation measures are not put in place (Stein and Schulze, 1978) as cited by Wanjogu et al. (2004). Agriculture in Kenya contributes to 55% of GDP, providing about 80% of employment. It accounts for 60% of export and generates about 40% of Government revenue (Blank et al., 2002). Irrigation fed agriculture directly contributes 3% of the total GDP and provides 18% of the value of all agricultural produce (ROK, 2009).
Nevertheless, the agricultural sector has been constrained with the following: salinity, sodicity, drain ability, effective rooting depth, availability of oxygen for root growth, workability of the soil, water retention capacity, moisture availability, soil fertility, conditions of germination, ease of land clearing and freedom for layout of field plans (Wanjogu et al., 2004). Because of the erratic rainfall patterns in the study area, both large and small scale farms are exploiting groundwater resources for irrigation without paying attention to the quality and associated impacts on land and crop losses. This research sought to investigate the quality of groundwater used for irrigation purposes in three catchment areas (Theta, Thiriika and Rwabura) of the Upper Athi River basin.
Study area
Geographic settings
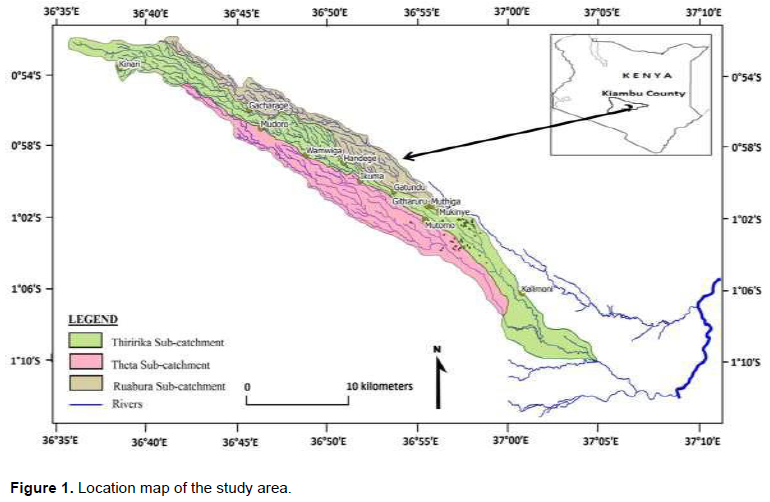
The study was carried out in three sub catchments: Theta, Thiririka and Rwabura within the Upper Athi River Basin. These three adjacent sub catchments are located in Gatundu south constituency within Kiambu County of Kenya. The study area lies between Latitudes 0° 51’ 22’’ and 01° 09’ 25’’ S and Longitudes 36° 34’ 59’’ and 37° 02’ 10’’ E. Its covers approximately 165 km2 and is bounded by Kikuyu escarpment to the North and Kiaora estate to the South. Location map of the study area is presented in Figure 1.
Topography
The altitude of the study area ranges from 1600 m above sea level at the lower zone to 2200 m above sea level in the middle and upper zones. It is hilly to the north and west and scattered hilly in the central and southern parts, while the East and South East has gentle plains. There are several valley bottoms scattered all over the centripetal drainage system, draining into the Athi River Basin. The terrain at lower parts favours gravity irrigation system which is currently being exploited on a gradual basis.
Climate
The sub catchments lie within the humid and semi humid agro-climate zones of Kenya. The upper parts of Thiririka and Rwabura sub-catchments lay within the Kikuyu escarpment forest comprising the humid zone and are the source of river Thiririka and Rwabura while that of Theta sub catchment lies within the Aberdare forest and also a humid zone and a source to river Theta and other streams. The middle parts of the sub catchments comprise the sub humid and semi humid zones and provides agricultural land where small scale agricultural activities are undertaken. The rainfall pattern is bimodal with two distinct rainy seasons with long and high rainfalls in March and May with short rain fall between October and November. The rainfall received ranges between 800 and 2000 mm with the highest being at the tea production zones. The maximum and minimum rainfall received is 257 and 33.4 mm in April and July, respectively (Gatundu Agricultural office and Rwabura Irrigation Project Report, 2013). The mean monthly evaporation experienced in the sub catchments range from 1.6 to 6.6 mm/day. On the average, the minimum evaporation rate is 75 mm in July, while the maximum is 166.6 mm in March (Rwabura Irrigation Project Report, 2013). Temperature distribution varies from humid to semi humid with the upper zone experiencing a mean annual temperature between 14oC and 18oC and the lower zones 18 oC and 22 oC. The maximum temperatures range from 25 to 34°C in August and March, whereas the minimum ranges from 9.8 to 15.4°C in February and April, respectively (Gatundu Agricultural office, 2013). Relative humidity ranges between 52 and 74.5% for dry and rainy seasons, respectively, with a monthly average of 66.7 per cent. The months of April, August and November are noted for peak humidity rises, while the least is experienced in February and March (Rwabura Irrigation Project Report, 2013). The physical features together with the climatic conditions which characterize the study area create a favourable environment for the cultivation of high value crops like coffee, tea, cereals and horticultural crops.
Geology and soils
The study area lies in the tertiary volcanic rocks region of central Kenya. Its geology can be classified as Kerichwa valley tuffs along the river valleys and the middle and upper Kerichwa valley tuffs found on the higher grounds. The study area is characterized by one soil unit nitrisols which comprises two soil types, that is, humic and rhodic nitisols. Other types that are presents but occupy small areas are umbric andosols, haplic nitisols and rhodic ferralsols. Humic nitisols are found on the upper parts of all the three catchments and rhodic nitisols found in the lower parts (Rwabura Irrigation Project Report, 2013).
Socio-economic conditions
The catchments have a total population of about 114,180 people, representing a density of approximately 593.5/km2 (KNBS, 2009). The population is denser in the lower zones with over 550 persons per square kilometre while the upper zones have 450 persons per square kilometre. There are clustered settlements around towns as a result of influx of people who migrate to live in urban areas due to employment opportunities and better infrastructural facilities. Administratively, Theta town is a ward under Gatundu north constituency, while Thiririka and its environs falls under Gatundu south constituency. The main economic activities in the study area are horticultural farming involving the growing of fruits and vegetables and cash crop farming involving the growing of coffee, tea and tissue culture bananas. In addition, most farmer also practice livestock keeping. There are small scale irrigation practices along river banks and valleys bottoms which are either pump-fed or bucket-fed. Irrigation is by furrows, sprinkler or tied- basins mainly for horticulture crops like tomatoes, kales, onions, cabbages, bananas, spinach and French beans. Most commercial farms grow tea and coffee especially in Theta sub-catchment own dams and ponds which they use for irrigation. Irrigation water management involves direction of water into the fields and specific intervals per crop. Irrigation normally varies depending on the kind of crops being irrigated. Regular irrigation is required for shallow rooted crops and those grown in shallow and light soils. Long period interval for irrigation is required for the deep rooted crops and in moderate to loamy sands.
Sampling procedure
Sampling techniques based on United States Environmental Protection Agency Method 1669 (USEPA, 1996) and Standard Operating Procedures (Joy, 2006; Ward, 2007) were followed. Sampling bottles were cleaned by washing with detergent and tap water, followed by sequential rinsing with tap water and then soaked in 10% nitric acid and finally rinsed with deionised water and openly dried for 24 h. At the sampling points, bottles were rinsed thrice with the source of water being sampled prior to sample collection.
Boreholes were purged for five minutes prior to sampling. Samples were collected by pumping directly into the sample bottles. The bottles were filled just enough, not allowing or introducing bubbles in the water and caped soon enough to prevent exposure to air and cross contamination. The bottles were labelled using permanent ink markers. In situ field parameters, that is, pH, temperature and electrical conductivity were recorded by pumping sample water into a beaker and immersing the Multi electrode water testing kit (portable OakTon 510 series). Measurements were recorded in a field note book with unique number and exact sampling location. Shallow wells were sampled using teflon bailers attached to a rope. Each bailer was disposed after use in order to prevent cross contamination. In situ field parameters were measured by collecting sample water in a beaker and immersing the Multi electrode water testing kit (portable OakTon 510 series). Prior to field sampling, the water testing kit was calibrated before field use and after every field activity prior to the next field activity.
The samples were kept in ice coolers at a temperature of 4°C and transported to Kenyatta University for analysis. All the electrodes were calibrated and checked prior to field measurements. The bulb end of the temperature electrode was carefully placed into the beaker of water and the temperature was determined after 2 min of waiting for reading to stabilize. The pH electrode was immersed in the sample and stirred gently, it was then allowed for 1 to 2 min for a stable reading and recording. Water EC was measured using EC electrode of the multi electrode water testing kit (portable OakTon 510 series). The conductivity cells and beaker was rinsed with a portion of the sample. The beaker was filled completely. The cell was inserted into the beaker. The temperature control was adjusted to that of the sample and the probe was inserted into the vessel and the conductance read.
The samples were analysed for calcium (Ca2+), magnesium (Mg2+), potassium (K+), sodium (Na+), carbonate (CO32-), bicarbonate (HCO3-), chloride (Cl-), sulphate (SO42-), nitrate (NO3-), and phosphate (PO4-3). Besides, pH and electrical conductivity in μS/cm at 25°C were also measured. The following analysis was also done:
1. Bicarbonate and carbonate were determined by titration
2. Calcium and magnesium were determined by ETDA titration
3. Sulphate was determined by spectrophotometer
4. Nitrate was determined by hydrazine reduction
5. Potassium and sodium were determined by flame photometer
6. Chloride was determined by argentometric precipitation method (Mohr’s Method).
DATA PROCESSING AND ANALYSIS
Data collected was first evaluated for accuracy by ensuring the sum of total of all cations is equal to sum of all anions in milli equivalent per litre (meq/L) (Deutsch, 1997). The accuracy of laboratory results was estimated using balance error equation in Equation 1. A balance error is acceptable when it is less than 5% (Deutsch, 1997). All the water samples were within the acceptable error level. This was done to ensure precision, reliability and relevance of the data to the study. The summary statistics such as mean and standard deviation for all independent variables with respect to sample identities were generated. Descriptive statistics such as bar graphs was used to display and explain results and compared to FAO (1985) standards. Electrical conductivity (EC) measured on the field was also used to assess salinity hazards.
Temperature, pH and total alkalinity of water sources
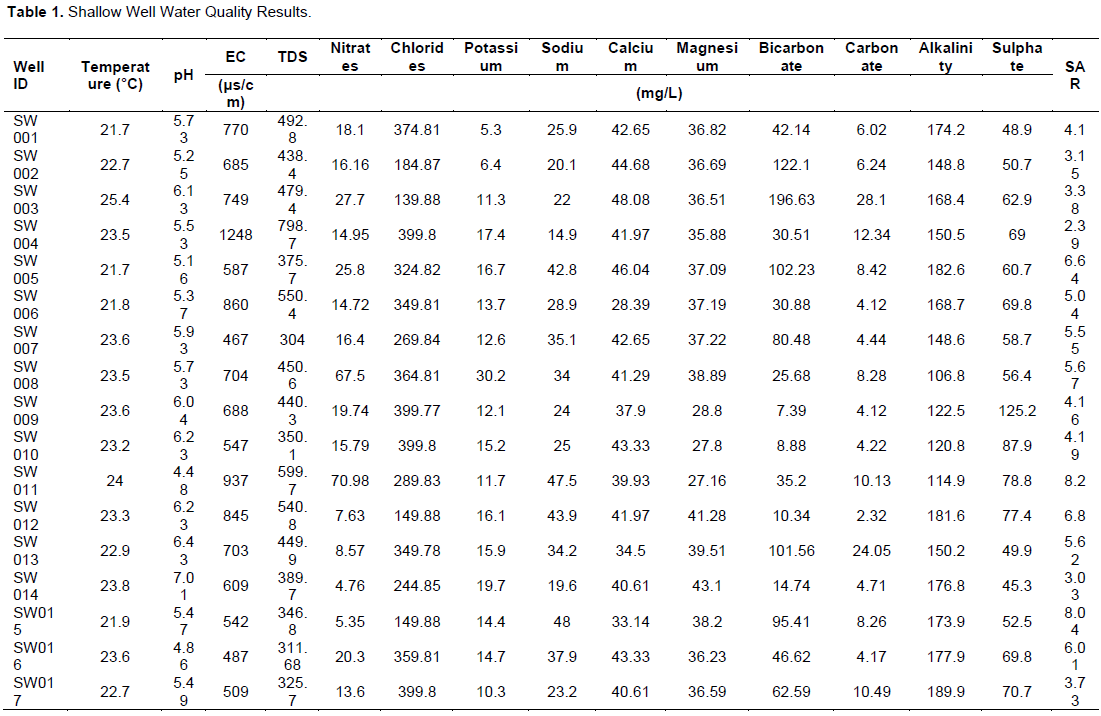
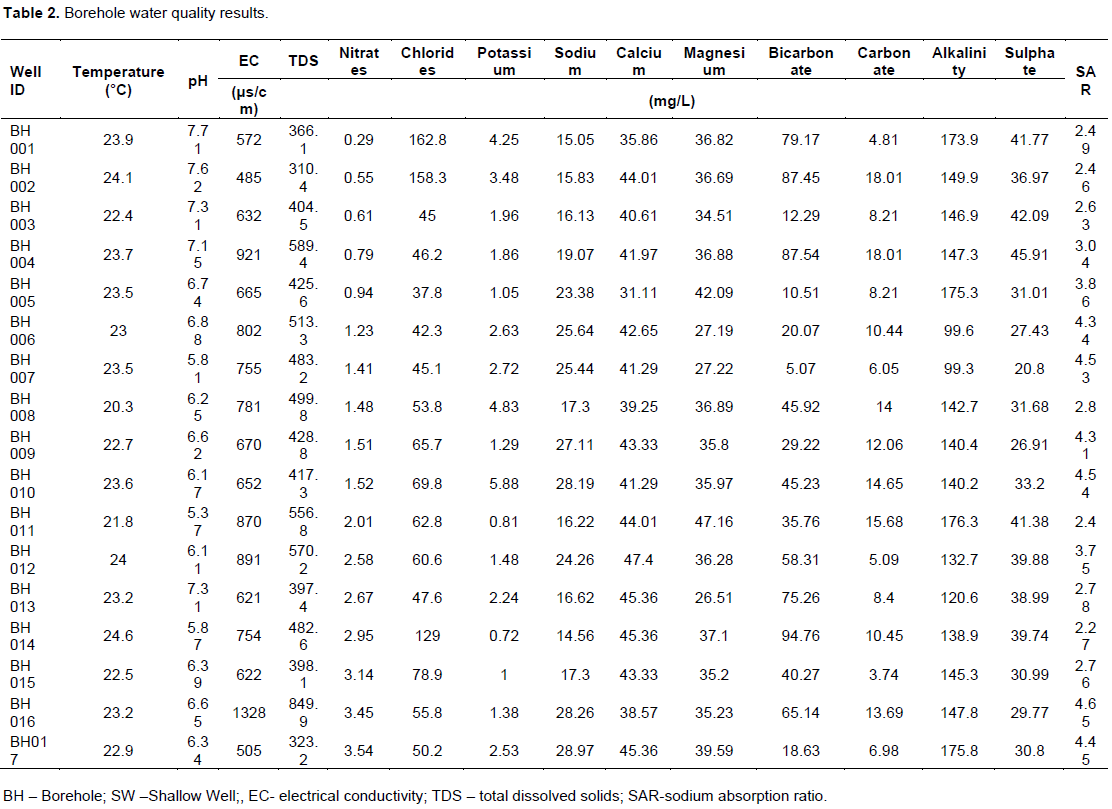
Temperature readings for both boreholes and shallow wells ranged from 20.3 to 25.4°C with an average of 23.11°C. The maximum temperature was recorded from shallow well (SW003) while the minimum from a borehole (BH008) in the Rwabura sub catchment. All the water sources fell within FAO (5 to 30°C) depending on the crop being grown) recommended temperature for irrigation. The results show that the pH of water sources was below the FAO maximum limits and samples fell within the normal pH ranges of natural waters (4 to 9) as stated by Maral (2010). The pH of sampled water in the study area ranges from 4.48 to 7.71 with the minimum from a shallow well and the maximum for both shallow well and borehole, though, the average pH (6.16) of water used for irrigation in the study area is less than the lower limits of FAO standards indicating slight acidity of groundwater sources in the catchments. This will however not have any significant effects on the soils pH in a short term since soils are high buffer systems (Maral, 2010). Nonetheless, long term use will cause excess iron and manganese in the soil which can lead to plant toxicity (Faust and Will, 2002). About 95% of samples from shallow wells and 35% of borehole had pH less than the minimum FAO recommendation of 6.5 (Table 1 and 2). This shows that, shallow wells in the study area are acidic as compared to the boreholes. Alkalinity of water sources in the sub catchments range from 99.3 to 189.9 mg/L and an average of 150.29 mg/L with the maximum and minimum recorded for a shallow well and borehole, respectively. The average for the shallow wells and boreholes were 156.30 and 144.29 mg/L respectively indicating slight alkalinity of the former as compared to the latter. All the samples are within the FAO limit and therefore will have no significant effect on soils and plant growth in the sub catchments.
ELECTRICAL CONDUCTIVITY (EC), TOTAL DISSOLVED SALTS (TDS) AND SODIUM ABSORPTION RATIO (SAR)
The most influential irrigation water quality guideline is salinity. Water with high EC or TDS is toxic to plants and causes soil degradation and therefore must be controlled. The EC value of sampled groundwater in the study area range from 467 to 1328 µS/cm with a mean of 719.5 µS/cm which according to Wilcox (1955) cited by Islam and Shamsad (2009) falls within the irrigation Water quality standard ‘excellent to good’ and ‘slight to moderate’. 50% of the sample can be classified as having excellent to good quality and the rest having slight to moderate quality. Electrical conductivity of water is a direct function of its total dissolved salts (Harilal et al., 2004). Both EC and TDS values are indicative of saline water in the absence of non-ionic dissolved constituents (Michael, 1992). Electrical conductivity correlates with estimation of TDS. However, every water resource has unique and variable dissolved salts and therefore in addition to EC, it is very important to consider TDS. The TDS of groundwater in the study area range from 304 to 849.9 mg/L with a mean of 460.63 mg/L. The maximum and minimum occurred for BH016 and SW007, respectively. The maximum SAR value permissible for irrigation water according to FAO is 9 meq/L. From this, all the water samples had values less than 9 meq/L and therefore will not cause any sodicity hazards when used for irrigation.
MAJOR SALTS ION CONCENTRATIONS IN WATER SOURCES
Toxicity problems occur when ions in irrigation water accumulate within the soil or plant or plant at concentrations that causes damage and reduced yield. The degree of damage depends on the concentrations of ion present. Results of the various cations and anions (Na+, Ca2+ and NO3-) that form salts in the water sources were compared with FAO standards to assess their possible effect on either plant and or soil.
BICARBONATE AND CARBONATE CONCENTRATIONS
Bicarbonate and carbonate ions in high concentrations in soils affect plant mineral nutrients uptake and metabolism (Phocaide and FAO, 2007). According to Kalbasi (1995), chlorosis in plants is as a result of iron nutrition disorder due to high concentrations of bicarbonate and carbonate. It has also been established that irrigation water with high bicarbonate/carbonate concentrations gives rise to the precipitation of calcium as calcium carbonate causing soil solution to become relatively enriched with sodium (DWAF, 1996).
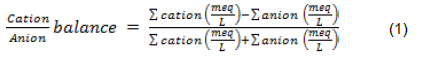
BICARBONATE CONCENTRATIONS
Figure 2 indicate the levels of bicarbonate concentration in water from the various sampling points. The results show that all the water sources have bicarbonate levels lower than the FAO upper limit except for the SW003 with a bicarbonate concentration of 196.63 mg/L. The bicarbonate concentrations in the three sub catchments range from 5.07 to 196.63 mg/L (BH007 and SW003, respectively). The average concentration for the study area is 53.67 mg/L and below the mid value of FAO (1985) permissible level. However, about 35% of water sources (SW002, 003, 005, 007, 013, 015 and BH 001, 002, 004, 013, 014) have above 75 mg/l bicarbonate concentration. Prolong application will increase the tendency for calcium and magnesium to precipitate as insoluble carbonates in soils in which they are used. The low bicarbonate content of all the water samples accounted for the low alkalinity and pH levels in the study area.
Carbonate in irrigation water becomes significant as water pH increases beyond 8.0 and exceeds 10.3. Water containing appreciable carbonates will exceede desirable bicarbonate levels as well (Maral, 2010). pH, alkalinity and bicarbonate levels were very minimal and therefore carbonate will not be an exception as confirmed in the table. The concentration of carbonate in the sub catchments ranged from 2.32 (a shallow well -SW012) to 28.1 mg/L (SW003) with an average of 9.67 mg/L. Though these values are very low, the maximum limit as per FAO (1970) cited by Banderi et al. (2012) is 3 mg/L and therefore only the water from shallow well SW012 is good for irrigation.
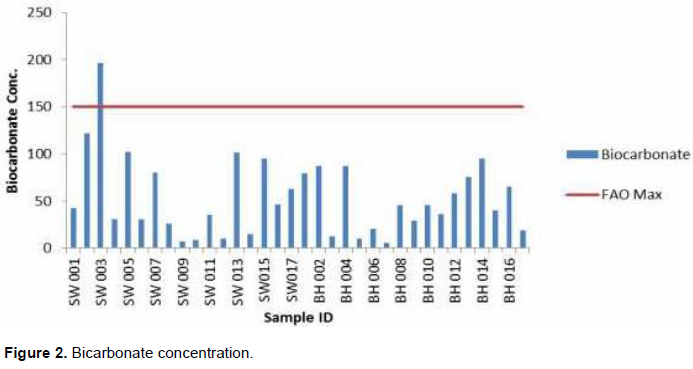
Some quantities of calcium impact positively by countering the negative effects of sodium and helps maintain good soil properties (Fipps, 2004). According to Gebauer and Ebert (2005), calcium preserves the structural and functional integrity of a plants membrane, stabilizes cell wall structure, regulates ion transport and selectivity and control ion exchange behaviour as well as cell wall enzyme activities. The calcium concentration of water samples in the study area range from 28.39 to 48.08 mg/L with an average of 41.23 mg/L with both the maximum and minimum occurring for shallow well SW003 and SW006, respectively. Calcium concentration was nearly the same across the study area. These concentrations fell within the acceptable FAO (1985) standards and therefore will not inhibit the uptake of iron from soil and induced chlorosis (Padmore, 2009) (Figure 3).
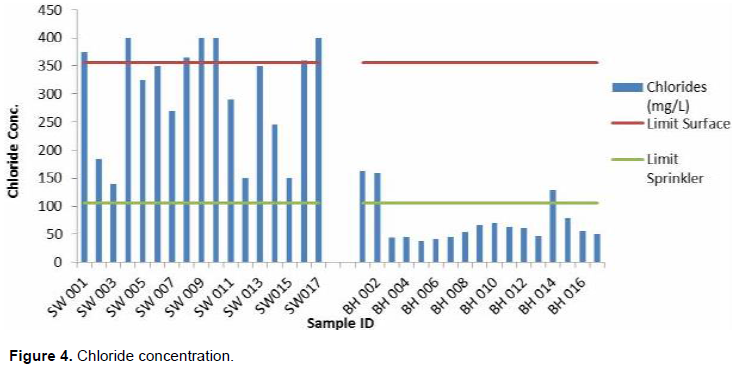
Chlorides are important anions effective in the formation of saline soils and are highly water soluble and thereby possess severe toxicity (Banderi et al., 2012). These anions cannot be precipitated at concentrations usually present in water but are readily transported through plants’ roots and conveyed to the leaves where they accumulate (DWAF, 1996). Its toxicity is common in water logged areas due to the rapid rates of its ion transport.
Concentration of chloride in all the 34 irrigation water samples varied considerably from 37.8 to 399.8 mg/L with an average value of 187.17 mg/L within the study area. From Figure 4, all the samples from the shallow wells and that of boreholes (BH001, BH002, and BH014) are not conducive for sprinkler irrigation as it may damage the plant leaves. For surface irrigation, about 21% (SW 001, SW004, SW008, SW009, SW010, SW016 and SW017) are not conducive, while the rest are conducive for irrigation.
Water with magnesium increases the potential effect of sodium on the soil when used for irrigation and its extreme deficiency also causes acidic soils which can lead to low levels of essential plant nutrients such as phosphorus and molybdenum (Maral, 2010). Excessive magnesium in water also causes water hardness which when used for irrigation deposits mineral residues on plant surfaces or foliage. As per FAO recommendations, the magnesium concentrations in samples from the study area are within the acceptable limit for irrigation purposes. It ranged from 26.51 to 47.16 mg/L for BH 013 and BH 011, respectively. The values as indicated will therefore have no effect on both the soil and plant. However, its use in conjunction with magnesium rich fertilizer must be avoided so it does not exceed soil the magnesium ratio (MR).
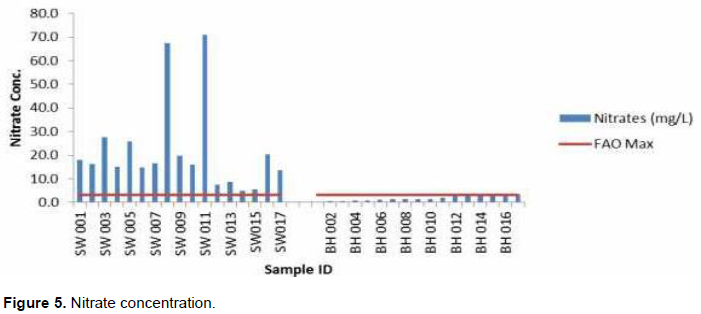
Nitrate concentrations
The nitrate concentration varied within the study area (Figure 5). The nitrate values varied from 0.3 to 71.0 and a mean of 11.7 mg/L. The maximum was observed for a shallow well and the minimum for a borehole. All the sampled shallow well in the study area have concentrations way above FAO (1985) limit, while all the boreholes are within the limit.
Sodium in minute quantities is beneficial to plants, however in excess can cause toxicity problems for some crops, especially when sprinkler irrigation is applied. The concentrations of sodium in all the samples were within the FAO permissible levels of 50 mg/L and pose no toxicity problems. Nonetheless, the continuous and long term use of water from points SW 005 (42.8 mg/L), SW 011 (47.5 mg/L) and SW 012 (43.9 mg/L) is not advisable or should be used with care since they have high levels of sodium. The sodium concentration across the study area ranges from 14.56 to 48 mg/L.
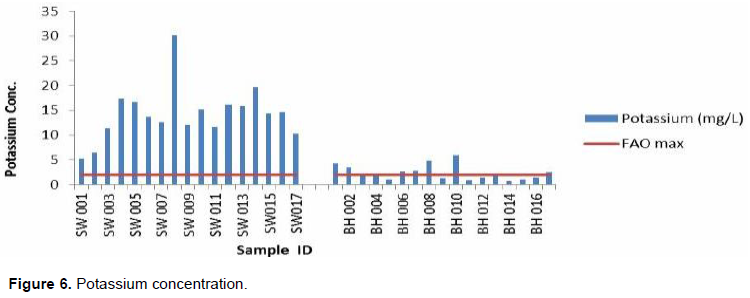
Potassium levels of the study area range from 0.72 to 30.2 with a mean of 8.35 mg/L. The maximum observed for a shallow well (SW008) and the minimum for a borehole (BH014) as well. It is also observed that samples from all the shallow wells were above the required FAO limit with 50% of samples from boreholes also having concentration above the FAO required limit (2 mg/L) (Figure 6). This means that, there will be a possibility of magnesium deficiency and iron chlorosis in the study area when used for irrigation as suggested by Fipps (2004).
Sulphate is a major anion in many irrigation waters. Its toxicity is not much of a problem; however, extremely high concentration may interfere with uptake of other nutrients by plant. According to FAO (1985), water with a sulphate concentration of 0 to 20 meq/L is considered as a usual range in irrigation water. This value when converted in mg/L is very high (above 200 mg/L). In the study area, the highest concentration was 125.2 mg/L, indicating that the water samples in relation to sulphate are safe for irrigation purposes without restriction.
Groundwater samples were assessed for their quality in terms of their potential for irrigation. The results show that groundwater in the study area were slightly acidic. Majority of samples also recorded TDS and EC values less than FAO maximum allowable concentration. Chloride ion concentration was generally high as compared to other ions. Calcium ion concentration was generally high as compared to other cations. Bicarbonate, calcium, magnesium, sodium and sulphate ions of groundwater were within the acceptable limit for irrigation, while the rest have no sodium adsorption ratio (SAR) values, suggesting suitability of groundwater from the study area for irrigation. It can also be derived from the results that, the boreholes were of ample quality as compared to the shallow well. The boreholes had less concentration of ions as compared the shallow wells, however, the results in general indicate that groundwater in the three sub catchments is suitable for irrigation purpose in a short term. This research may serve as a preliminary study to provide baseline information that may direct future water quality assessment studies in the study area.
The authors have not declared any conflict of interests.
REFERENCES
|
Banderi A, Mohammad MS, Hamdi H, Shomeli M, Ali SD (2012). Water quality assessment of Amir Kabir sugarcane agro-industry with respect to agricultural and drinking views. J. Environ. Ecol. 3(1):11-28.
Crossref
|
|
|
|
Blank HG, Mutero CM, Rust HM (2002). The changing face of irrigation in Kenya: Opportunities for anticipating change in Eastern and Southern Africa. International Water Management Institute pp.14-16.
|
|
|
|
|
Consultative Group on International Agricultural Research (2003). Water and People in catchments. Challenge program on water and food. Cali, Colombia.
|
|
|
|
|
Department of water affairs and forestry (1996). South African Water Quality Guidelines (second edition) Volume 4: Agricultural Use: Irrigation.
|
|
|
|
|
Deutsch WJ (1997). Groundwater Geochemistry: Fundamentals and applications to contamination. New York, USA.
|
|
|
|
|
USEPA (1996). Method 3050B Acid digestion of sediments, sludge's and soils, 2nd revision U.S environmental protection agency, office of solid waste.
|
|
|
|
|
FAO (1985) Water Quality for Agriculture, Irrigation and drainage paper No. 29, Rev.1. Food and Agriculture Organization of the United Nations, Rome.
|
|
|
|
|
Faust JE, Will E (2002). Irrigation Water Quality for Greenhouse Production, Agricultural Extension Service, University of Tennessee.
|
|
|
|
|
Fipps G (2004). Irrigation water quality standards and salinity management strategies, Texas cooperative extension, Texas, USA.
|
|
|
|
|
Gatundu Agricultural Office (2013). Gatundu south constituency, Kiambu county, Kenya.
|
|
|
|
|
Gebauer J, Ebert G (2005). Soil salinity in Sudan and the possibilities of irrigation. WaWi 3:47-49.
|
|
|
|
|
Ghassemi F, Jakeman AJ, Nix HA (1995). Pakistan. In: Salinisation of land and water resources: human causes, extent, management and case studies. University of New South Wales Press Ltd, Sydney 369-395.
|
|
|
|
|
Harilal CC, Hashim A, Arun PR, Baji S (2004). Hydro geochemistry of two rivers of Kerala with special reference to drinking water quality. J. Ecol. Environ. Conserv. 10(2):187-192.
|
|
|
|
|
Islam MS, Shamsad SZKM (2009). Assessment of Irrigation water quality of Bogra District in Bangladesh. Bangladesh J. Argil Resour. 34(4):597-608.
|
|
|
|
|
Joy J (2006). Standard Operating Procedure (SOP) for Manually Obtaining Surface Water Samples, Version 1.0. Washington State Department of Ecology, Olympia, WA, SOP Number EAP015.
|
|
|
|
|
Kalbasi M (1995). Iron chlorosis in fruit trees. Isfahan University of technology press publication 13.
|
|
|
|
|
Kenya National Bureau of Statistics (2009). Economic survey 2009, Government Printer, Nairobi: KNBS.
|
|
|
|
|
Maral N (2010). Soil and water analysis techniques for agricultural production a thesis submitted to the graduate school of natural and applied sciences of Middle East technical university.
|
|
|
|
|
Michael AM (1992). Irrigation theory and practices, Vikash Publishing House Pvt. Ltd., New Delhi-India, pp. 686-740.
|
|
|
|
|
Mugwanja PN, Mochiemo GO, Osoro CM (1995). Management of salt affected soil in Taveta sub-district, Coast Provinces. Proceedings at the International Workshop integrated soil management for sustainable use of salt affected soils. Manila Philippines.
|
|
|
|
|
Ndegwa GM, Kiiru I (2009). Investigation on soil and water quality as affected by irrigation in Turkana District, Kenya. J. Agric. Sci. Technol. 1(12):17-36.
|
|
|
|
|
Phocaide A, Food and Agriculture Organization of the United Nations (2007). Handbook on pressurized irrigation techniques, Rome: FAO.
|
|
|
|
|
Padmore C (2009). Irrigation salinity – causes and impacts, PRIMEFACT 937. Wagga Wagga Agricultural Institute, Department of Primary Industries, Orange Wagga Wagga NSW 2650.
|
|
|
|
|
Republic of Kenya (2009). National Irrigation and Drainage Policy, Ministry of water and irrigation, Nairobi, Kenya.
|
|
|
|
|
Rwabura Irrigation Project Report (2013). Gatundu Agriculture Office. Kenya.
|
|
|
|
|
Squires VR, Glenn EP (2004). Salination, Desertification, and Soil erosion, In: The Role of Food, Agriculture, Forestry and Fisheries in Human Nutrition, [Ed. Victor R. Squires], in Encyclopaedia of Life Support Systems (EOLSS), Developed under the Auspices of the UNESCO EOLSS Publishers Oxford UK.
|
|
|
|
|
Stein C, Schulze C (1978). Land use and Development Potential in the arid regions of Kenya. Appl. Sci. Dev. Institute Sci. Cooperation 12:47-64.
|
|
|
|
|
Wanjogu SN, Gicheru PT, Maingi PM, Nyamai M (2004). Saline and sodic soils in the Drylands of Kenya, Nairobi, Kenya.
|
|
|
|
|
Ward B (2007). Standard Operating Procedure (SOP) for the collection and field processing of metals samples, version 1.3. Washington State Department of Ecology, Olympia.
|
|
|
|
|
Wilcox LV (1955). Classification and use of irrigation waters. U.s. Deptt. Of agriculture cire, 969, washington, d.c. P 19.
|
|