ABSTRACT
The existence of genetic variation is essential in plant breeding for increasing yield, wider adaptation, selection of parents for hybridization, desirable quality, and pest or disease resistance. This study was planned to investigate genetic variability based on cluster analysis of groundnut cultivars based on morpho-agronomic traits. The crop was sown in randomized complete block design (RCBD) during the 2015 wet season across four locations in Ethiopia. The cluster analysis based on average linkage (UPGMA) of 16 groundnut genotypes, measured for 17 oil traits showed that the most distinct genotypes were Werer-963 and Behagudo (D=10.48), between Werer-963 and Tole-1 (D=10.32), and between Tole-1 and Sedi (D=9.86). The cluster mean analysis based on oil traits and quality parameters has grouped genotypes into 3 clusters. The first cluster constituted 9 genotypes that showed non-significant above average performance for oleic acid, eicosenoic acid, lignoceric acid, total monounsaturated fatty acids (TMUS), total unsaturated fatty acids (TUS) and oleic to linoleic acid ratio (O/L). Thus, such genotypes can be used for improvement of oil quality traits. The second cluster consisted of three genotypes that showed significant above average performance for stearic acid, arachidic acid, behenic acid, grain yield (GY) and oil yield (OY), but non-significant and above average performance for oil content, oleic acid, total saturated fatty acids (TS), TMUS and O/L ratio indicating that genotypes in the second cluster can be used for improvement of GY, OY and also oil quality traits.
Key words: Cluster means, agro-morphological traits, unweighted pair group method with arithmetic mean (UPGMA), hybridization, genetic variability.
The genetic divergence analysis estimates the extent of diversity existing among selected genotypes. Improvement in yield and quality is normally achieved by selecting genotypes with desirable character combinations existing in the nature or by hybridization. The parents identified on the basis of the divergence analysis would be more promising (Singh et al., 2013). The crosses between parents with suitable genetic divergence are generally the most responsive for yielding the most promising segregants. However, satisfactory results are obtained only if the germplasm employed in the cross also present high values for the traits of interest (Fu and Somers, 2009).
Various algorithms have been used to study genetic diversity in cluster analysis, of which UPGMA and Ward’s methods are the most popular approaches. Of the algorithms, UPGMA, Ward’s method applied for cluster analysis and exploring genetic diversity and grouping of plant materials in the past, the UPGMA is the most valid method in accordance with the relationship of family based on their genetic material (Mohammadi and Prasanna, 2003). Chaining effect in UPGMA model is considered as the major drawback on application of this approach in cluster analysis and results in confusions in interpretation of the results. Ward’s approach is similar to UPGMA method but without having chain effect issues (Mohammadi and Prasanna, 2003). The objective of the present study was to observe the genetic variability among different genotypes of groundnut by using cluster analysis so that the genotypes possessing traits that could be used for improvement of grain yield and oil quality traits could be selected and traits that contribute for the improvement of agronomically important traits could be selected.
The experiment was carried out across four locations viz. Fedis, Mechara (locations in Eastern Ethiopia), Pawe and Guba (locations in Western Ethiopia) during 2015 growing season under rain fed condition. The experimental materials consisted of sixteen groundnut genotypes including local variety and varieties that were released by Ethiopian Institute of Agricultural Research (EIAR) and Universities from 1976 to 2012. Before starting laboratory experiment moisture content of seeds was reduced to 5%.Oil content and fatty acid profile determination was carried out based on the following techniques:
Total lipid from the seed sample was quantitatively extracted according to the method of Folch et al. (1957). Total extractable fat was determined gravimetrically and expressed as %fat (w/w) per 100 g seed. The extracted fat was stored in a polytop (glass vial, with push-in top) under a blanket of nitrogen and frozen at –20°C pending fatty acid analyses. Iodine value was determined with the Hanus method (AOAC nr. 920.158, 1990). Fatty acids were trans-esterified to form methyl esters using 0.5 N NaOH in methanol and 14% boron trifluoride in methanol (Hur et al., 2004.). Nonadecanoic acid (C19:0) was used as internal standard. FAMEs from fat were quantified using a Varian 430 flame ionization GC, with a fused silica capillary column, Chrompack CPSIL 88 (100 m length, 0.25 mm ID, 0.2 μm film thicknesses). Analysis was performed using an initial isothermic period (40°C for 2 min). Thereafter, temperature was increased at a rate of 4°C/min to 230°C. Finally an isothermic period of 230°C for 10 min followed. FAMEs n-hexane (1μl) was injected into the column using a Varian CP 8400 Autosampler. The injection port and detector were both maintained at 250°C. Hydrogen, at 45 psi, functioned as the carrier gas, while nitrogen was employed as the makeup gas. Galaxy Chromatography Software recorded the chromatograms.
Fatty acid methyl ester samples were identified by comparing the retention times of FAME peaks from samples with those of standards obtained from Supelco (Supelco 37 Component Fame Mix 47885-U, Sigma-Aldrich Aston Manor, Pretoria, South Africa). Fatty acids were expressed as the proportion of each individual fatty acid to the total of all fatty acids present in the sample. The following fatty acid combinations were calculated: total saturated fatty acids (SFA), total monounsaturated fatty acids (TMUS), polyunsaturated fatty acids (TPUS), total unsaturated fatty acids (TUS) and TPUS/TS ratio. Data were recorded for oil content and major fatty acid composition and other oil quality parameters.
Genetic divergence was measured using Euclidian distance (D). Agglomerative hierarchical cluster analysis was used to determine differences and similarities among the genotypes, and the distance measure used was Euclidian distance as the parameter that best reflects the differences existing among the genotypes (Kendall, 1980). Factor analysis used the covariance matrix of traits (Harman, 1967) to generate factor loadings and communalities using the method of principal component extraction. UPGMA clustering method was performed to obtain dendrogram and sort genotypes and traits into clusters. All data analyses were carried out based on 12 agro-morphological and 17 oil traits using SAS 9.2 software (SAS Institute, 2011) and Genes software VS 2016.6.0 (Cruz, 2013).
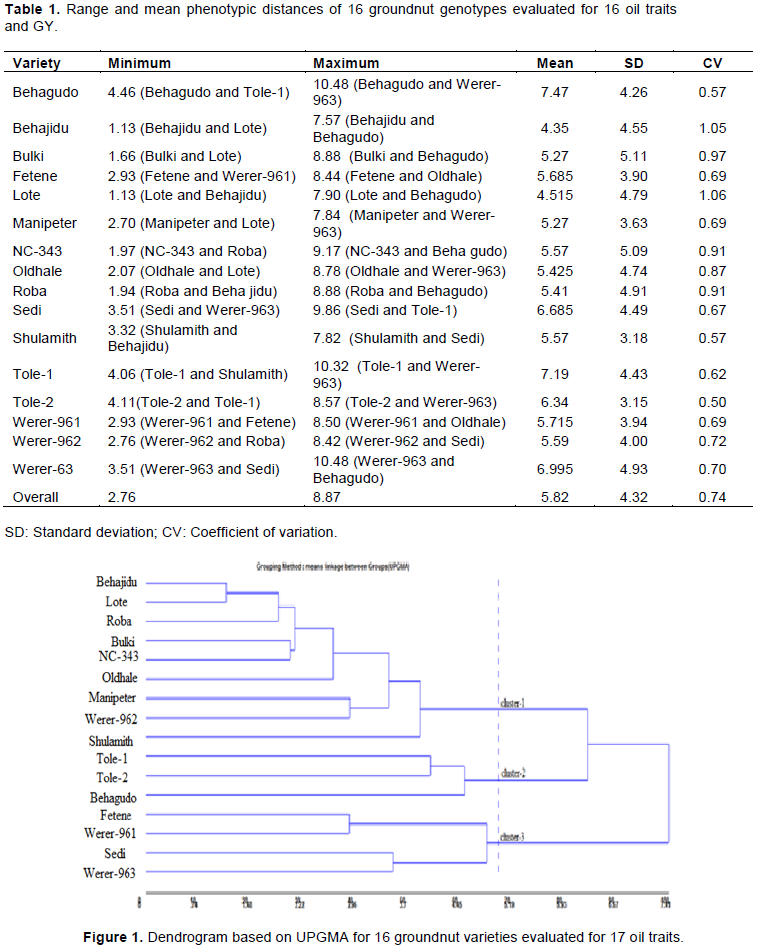
The Euclidian distance matrix (D) and its correlation (Table 1) were worked out for 16 groundnut genotypes evaluated for 17 oil traits. The distance matrix was used to study genetic diversity among the genotypes based on clustering method. The most divergent genotype pairs were those having greater D while the most similar were those having less D. The most similar groups were formed between Beha jidu and Lote (D=1.13); between Bulki and Lote (D=1.66); and also between NC-343 and Roba (D=1.97). Such pairs for comparing similarity standards are not recommended for use in breeding programs for hybridization since they avoid restriction in genetic variability and derail the gains to be obtained by selection (Cruz et al., 2004). On the other hand, the most divergent pairs were between Werer-963 and Behagudo (D=10.48), between Werer-963 and Tole-1 (D=10.32), and between Tole-1 and Sedi (D=9.86). The large divergence, in principle, allows recommending the crossing among such pairs of varieties in order to maximize heterosis and increase possibility of segregants in advanced generations (Cruz et al., 2012). Genetic divergence of groundnut genotypes through distance matrix based on Euclidian distance (D) revealed that there was small range of genetic diversity from 1.13 (between NC-343 and Roba) to 10.48 (between Werer-963 and Beha gudo).
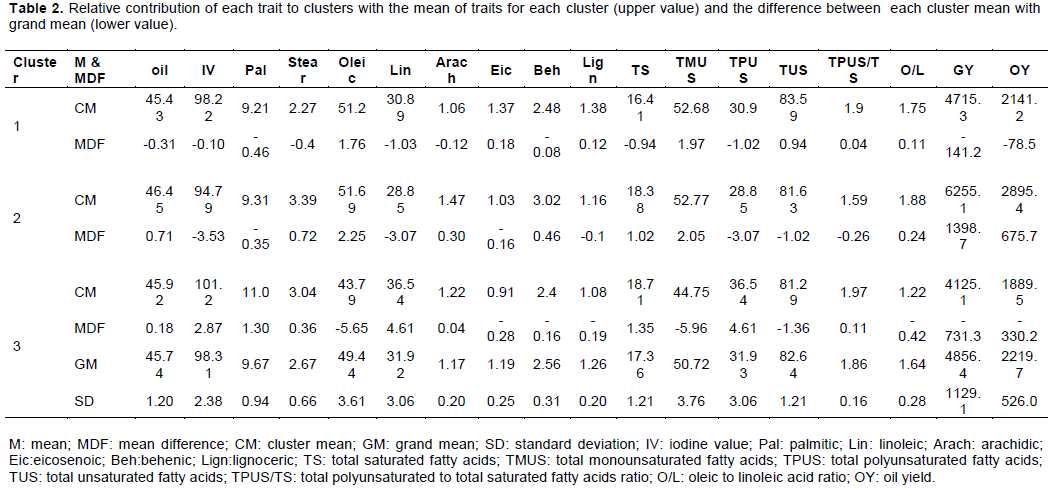
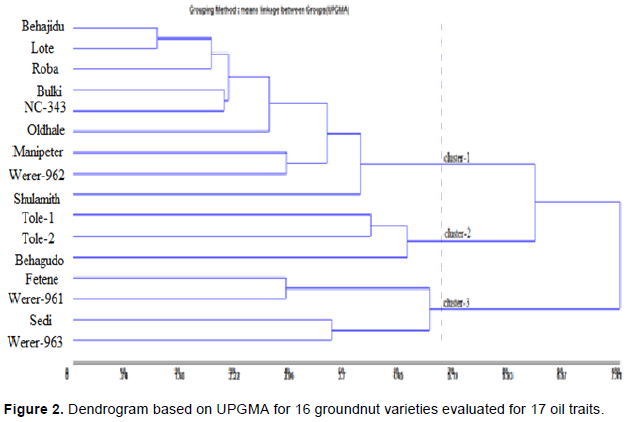
The cluster mean analysis based on oil traits and quality parameters has shown that the cutting point was determined at a mean plus standard deviation distance that was found to be 5.25, based on which 3 clusters were obtained. Varieties in same cluster do not significantly differ from one another. Thus, they belonged to the same group or cluster (Figure 1). The first cluster constituted 9 varieties that have shown non-significant above average performance for oleic acid, eicosenoic acid, lignoceric acid, TMUS, TUS and O/L ratio. Thus, such varieties can be used for improvement of oil quality traits. The second cluster consisted of three varieties that have shown significant above average performance for stearic acid, arachidic acid, behenic acid, GY and OY, but non-significant and above average performance for oil content, oleic acid, TS, TMUS and O/L ratio indicating that varieties in the second cluster can be used for improvement of GY, OY and oil quality traits. The third cluster consisted of four varieties, with significant above average performance for IV, palmitic acid, linoleic acid, TS, TPUS, TPUS/TS, but non-significant above average performance for oil content and stearic acid. The varieties in this cluster may be used for improvement of oil content but not for oil quality traits.

The cluster mean analysis based on oil traits and quality parameters (Table 2) has shown that the cutting point is determined at a mean plus standard deviation distance that was found to be 5.25, based on which 3 clusters were obtained (Figure 2). Genotypes in the same cluster do not significantly different from one another. Thus, they belong to the same group or cluster. The first cluster constituted 9 genotypes that have shown non-significant above average performance for oleic acid, eicosenoic acid, lignoceric acid, TMUS, TUS and O/L ratio. Thus, such genotypes can be used for improvement of oil quality traits. The second cluster consisted of three genotypes that have shown significant above average performance for stearic acid, arachidic acid, behenic acid, GY and OY, but non-significant and above average performance for oil content, oleic acid, TS, TMUS and O/L ratio indicating that genotypes in the second cluster can be used for improvement of GY, OY and oil quality traits. The third cluster consisted of four genotypes, with significant above average performance for IV, palmitic acid, linoleic acid, TS, TPUS, TPUS/TS, but non-significant above average performance for oil content and stearic acid. The genotypes in this cluster may be used for improvement of oil content but not for oil quality traits.
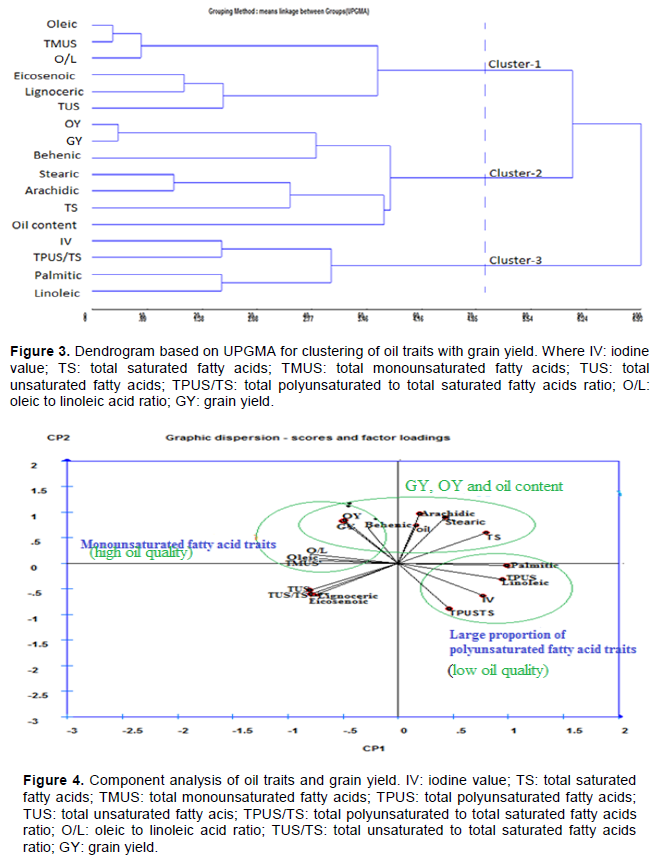
The clustering dendrogram based on UPGMA for genetic correlation of oil traits and grain yield is shown in Figure 3. The cutting point for grouping dendrogram into clusters were based on the mean Euclidian distance of traits plus standard deviation which was found to be 5.25, that resulted in the grouping of 16 oil traits and GY into 3 clusters. The first cluster consisted of oil quality traits: oleic, O/L ratio, TMUS, TUS, eicosenoic and lignoceric acids indicating such traits can be equally used as determinant of oil quality based on fatty acid composition, thus breeders can use any one of them for improvement of oil quality. Both OY and oil content traits were grouped with grain yield in the second cluster, this showed that there could be possibility of breeders to improve OY and oil content with GY. The third cluster consisted of low oil quality traits including linoleic acid, TPUS/TS, IV and palmitic acid. The most similar traits were TMUS and oleic acid followed by OY and GY indicating that both of these traits are equally important, having same purpose, that is no need to use both of them together for selection rather using one of them is sufficient. On the other hand, among the most distantly related were oil content with iodine value (IV), and oil content with oleic acid indicating that breeding for both oil content and oil quality can be achieved through intercrossing since simultaneous selection for both oil quantity and quality could be a rare event.
The PCA for oil traits and grain yield (Figure 4) has shown that GY and OY were closely related with both oil content and oil quality (oleic traits) since the angle between them relative to principal axis was less than 90°. However, oil content may not be closely related to high oil quality traits: oleic acid, O/L ratio and TMUS as the angle between oil content and oleic traits being obtuse (>90°) showing that it is difficult to make selection of a genotype having both high oil content and high oil quality. However, oil content can be improved with both grain yield and low oil quality traits: linoleic acid, TPUS and TPUS/TS since it formed acute angle with them. The vectors of Oleic acid and O/L ratio were nearly perpendicular to that of oil content indicating a weak correlation. Thus, it is possible to have genotypes with low oil and high O/L ratio. The earlier mentioned associations among different confectionery traits and also with yield indicate a possibility of selecting genotypes with complementary traits for breeding high yielding confectionery grade cultivars. These findings are in agreement with previous studies by Dwivedi et al.(1993), Anderson et al. (1998), Singkham et al. (2010) who found negative relation between oleic acid with linoleic acid, and O/L ratio with linoleic acid in groundnut; Ajay et al. (2012) who found divergent genotypes for confectionary quality traits in groundnut.
The cluster mean analysis for biochemical analysis of oil traits has shown genotypes in cluster-2 and 3 as promising for improvement of most important traits in oil crops including grain yield, oil content, oil yield and oil quality traits. High oil quality traits: oleic, O/L ratio, TMUS, TUS, eicosenoic and lignoceric acids indicating such traits can equally be used as determinant of oil quality based on fatty acid composition, thus breeders can use any one of them for improvement of oil quality. Both OY and oil content traits were grouped with grain yield in the second cluster. This showed that there could be possibility of breeders to improve OY and oil content with GY. Oil content with iodine value (IV), and oil content with oleic acid were among the most distantly related traits indicating that breeding for both oil content and oil quality can be achieved through intercrossing since simultaneous selection for both oil quantity and quality could be a rare event.
The authors have not declared any conflict of interest.
REFERENCES
|
Ajay BC, Gowda MVC, Rathnakumar AL, Kusuma VP, Abdul Fiyaz R, Holajjer P, Ramya KT, Govindaraj G, Prashanth Babu H (2012). Improving Genetic Attributes of Confectionary Traits in Peanut (Arachis hypogaea L.) Using Multivariate Analytical Tools. Journal of Agricultural Science 4(3):243-258.
Crossref
|
|
|
|
Anderson PC, Hill K, Gorbet DW, Brodbeck BV (1998). Fatty acid and amino acid profiles of selected peanut cultivars and breeding lines. Journal of Food Composition and Analysis 11:100-111.
Crossref
|
|
|
|
|
Cruz CD, Regazzi AJ, Carneiro PCS (2012). Modelos biométricos aplicados ao melhoramento genético. 4th ed. UFV, Viçosa.
|
|
|
|
|
Cruz CD, Regazzi AJ, Cameiro PCS (2004). Modelos biometricos aplicados ao melhoramento genetico. UFV, Vicosa P.480.
|
|
|
|
|
Cruz CD (2013). Genes-a software package for analysis in experimental statistics and quantitative genetics. Acta Scientiarum 35(3):271-276.
Crossref
|
|
|
|
|
Dwivedi SL, Nigam SN, Jambunathan R, Sahrawat KL, Nagabhushanam GVS, Ragunath K (1993). Effect of genotypes and environment on oil content (quality parameters and their correlation in peanut (Arachis hypogaea L.). Peanut Science 20:84-89.
Crossref
|
|
|
|
|
Folch J, Lees M, Sloane-Stanley GH (1957). A simple method for the isolation and purification of total lipids from animal tissue. Journal of Biological Chemistry 226:497-509.
|
|
|
|
|
Fu Y, Somers D (2009). Genome-Wide Reduction of Genetic Diversity in Wheat Breeding. Crop Science 49:161-168.
Crossref
|
|
|
|
|
Harman HH (1967). Modern factor analysis. 2nd ed. University of Chicago Press. Chicago P 124.
|
|
|
|
|
Hur SJ, Ye BW, Lee JL, Ha YL, Park GB, Joo ST (2004). Effects of conjugated linoleic acid on colorand lipid oxidation of beef patties during cold storage. Meat Science 66:771-775.
Crossref
|
|
|
|
|
Kendall M (1980). Multivariate Analysis (Second Edition). Charles Griffin and Co London.
|
|
|
|
|
Mohammadi SA, Prasanna BM (2003). Analysis of genetic diversity in crop plants-salient peanutandits wild relatives (Arachis L.-Leguminosae). Theoretical and Applied Genetics 85:550-560.
Crossref
|
|
|
|
|
SAS Institute (2011). SAS enterprise guide, Version 9.2. SAS Inst., Cary, NC, USA.
|
|
|
|
|
Singh SR, Ahmed N, Lal S, Ganie SA, Amin M, Jan N, Amin A (2013). Determination of genetic diversity in onion (Allium cepa L.) by multivariate analysis under long day conditions. African Journal of Agricultural Research 8(45):5599-5606.
|
|
|
|
|
Singkham N, Jogloy S, Kesmala T, Swatsitang P, Jaisil P, Puppala N, Patanothai A (2010). Estimation of heritability by parent-offspring regression for high oleic acid in peanut. Asian Journal of Plant Sciences 9:358-363.
Crossref
|
|