ABSTRACT
The study of fatigue crack behavior in welded structures using AE technique during crack initiation and propagation is discussed in this paper. This was achieved both theoretically and experimentally using four point bending testing. A new averaging index known as AE intensity was used to analyze the fatigue crack initiation conditions in the specimen. A theoretical model based on acoustic emission energy rate was developed to determine the critical fatigue level and crack extension. The results were compared with fatigue crack growth using a non-contact non-destructive testing method known as the digital imaging correlation. It was realized that, AE technique was able to detect the unset of a crack at a length of 8 μm in welded connection and 10 μm in the base metal, this proved that, crack initiates faster in welded connection than base metal.
Key words: Acoustic emission, fatigue, initiation, propagation, digital imaging correlation.
A major setback in engineering structures is the early detection of an emerging crack to prevent progressive damage, monitoring the progress of a detected crack and predicting remaining useful life of the structure. Maintenance cost can be severely reduced in civil engineering structures if cracks are detected earlier and necessary remedies taken. Several methods have been used to determine how a crack starts, when it starts and how long it takes for a cracked structure to finally collapse. Acoustic Emission (AE) is discussed to be the most effective non-destructive testing (NDT) method for monitoring fatigue crack growth in civil engineering structures because of its real time monitoring system (Pullin et al., 2005; Boris et al., 2012; Rabiei and Modarres, 2013; Grosse and Ohtsu, 2008; Aggelis et al., 2011; Khamedi et al., 2010). No universally accepted definition of a “small” crack, has been defined, however several researchers have proposed cracks less than 1 mm long (<0.001 m) as small (Anderson, 1995; Schijve, 1967). In this paper, the AE technique is applied in the detection of crack development, fatigue crack initiation and monitoring the propagation of structural steel and butt welded specimens designed from lowly stressed areas of a collapsed steel bridge. This was carried out experimentally under two peak loads.
Acoustic emission technology has been successfully correlated with linear elastic fracture mechanics (LEFM) parameters such as crack length, crack growth rate and stress intensity for the evaluation and the assessment of remaining fatigue life in relation to load cycles (Nykänen et al., 2005; Biancolini et al., 2006; Han et al., 2011). In related literatures, the AE count rate, with respect to loading cycles has also been represented by a power law similar to the Paris–Erdogan crack propagation law (Singh et al., 2007; Harris and Dunegan, 1974; Shigeishi et al., 2001). These power laws provide a natural link between non-destructive acoustic emission monitoring and qualitative fracture mechanics methods for predicting the rate of crack propagation (Roberts and Talebzadeh, 2003). A model describing the relationship between AE count rate and stress intensity range by relating the energy released rate during crack extension to AE counts was presented by Harris and Dunegan (1974). In other literatures, cumulative AE counts were used in predicting remaining life of steel specimens with notch (Carpinteri et al., 2007). The purpose of this paper is to apply AE technique in the early detection of cracks in real time to reduce maintenance cost and unforeseen catastrophe in civil engineering structures.
Crack initiation
Acoustic emission parameters such as count, rise time and amplitude are used to characterize the crack initiation behavior of the specimens. The sudden release of high peak AE counts corresponds to crack initiation; however this might also be due to plastic deformation, micro-cracking and background noise. A new averaging index called AE-intensity is proposed to combine multiple features of an AE signal for detecting the onset of cracks to reduce uncertainties and determine the early abrupt jumps in AE events, which correspond to crack initiation as shown in Equation 1. Noise signals are characterized by higher rise times; however when the sensors are close to the crack, faster rising times are recorded (Aggelis et al., 2011). In addition, crack-related signals also comprise higher amplitudes as well as higher counts. Therefore, it can be concluded that the signals with lower rise time, higher amplitudes and higher counts correspond to crack growth rather than noise. Estimation of crack initiation time can be implemented by simultaneous evaluation of these AE features. The first appearance of a high amplitude, high count, and low-rise time AE signal corresponds to crack initiation.

where E′ is equal to Young’s modulus E under plane stress conditions and to under plane strain conditions. is Poisson’s ratio, t is the specimen thickness, and a is the crack length.A relationship proposed by Yu is:
Equation 8 is used to estimate the crack extension in the specimen using Acoustic emission energy rate.
Specimens design
The standard four point bending (4PB) specimens were designed from Q345 (Chinese code) steel and butt weld in accordance with ASTM E647 standards. An initial pre-crack length of 0.5 mm was created at the bottom of the specimen. The mechanical properties of the materials used for the specimens are shown in Table 1. The specimens had dimensions of the width (W) = 40 mm, thickness (B) =16 mm. A pre-crack length (a) of 0.5 mm was notched using the MTS machine at a frequency of 10 Hz. The E50 electrodes were used for welding specimen by shield metal arc welding method. The weld types were full penetration butt welds. The specimens’ surfaces were mechanically polished by grinding and buffing to ensure their smoothness.
Experimental methods
Fatigue tests were carried out on a servo-hydraulic testing machine with maximum load capacity of 250 kN at ambient temperature (300K). All specimens were tested under sinusoidal cyclic loading at a frequency of 8 Hz and load ratio (R) of 0.1 at two peak loads of 16 and 20 kN respectively to study the effect of peak loads on fatigue crack propagation. The AE signals were detected by using two broad band piezoelectric sensors with frequency range of 10 kHz to 2 MHz. Vaseline was used at the interface between the sensors and the specimen surface to obtain proper signals. A preamplifier of 40 db gain was used to capture the AE signals. AE signals generated during the fatigue tests were recorded by SWAES full-waveform acoustic. In order to make sure that the signals were obtained from the cracked area, the linear source location was applied using the pencil lead break method (Nivesrangsan et al., 2007; Hamstad, 2007).
Ordinary paints (black and white) were sprayed on the specimens’ surface as speckle patterns in a sweeping motion. DIC images were captured using charged couple device (CCD) cameras which were symmetrically positioned at a stereo angel of 30°. The Images were taken after every 10 s during the fatigue loading period. The images were analyzed using commercially available image correlation software Vic-3D from Correlated Solutions Incorporators (Singh et al., 2007), by capturing a reference image from a reference cycle and deformed images at the same load level in later cycles. All experimental systems were triggered at the same time for effective comparison of results.
Crack initiation
Quantitative analysis of the data proved that, there was no AE event believed to be caused by crack initiation during the first 10,000 cycles of monitoring the tests, even though some AE signals were recorded due to background noise. For experiment of the base metal specimen at peak load of 16 kN the first jump in AE intensity (sudden increase of 62%) was detected at approximately 18700 cycles, which is an indication that crack initiation was taking place. Similar observation achieved for other tests. The numbers of cycles for crack initiation were 10,400 experiments for the welded specimen at peak load of 16 kN. Results from the crack tip opening displacement gauge represented a crack length of 8 um. Cumulative AE intensity was calculated for the time of crack initiation and for the entire crack growth duration. A linear correlation was observed between the cumulative AE intensity and crack sizes. As shown in (Figure 1), linear correlation between AE Intensity and small crack growth exists in the entire crack length range (Figure 2).

The slopes of the lines from those three experiments are apparently similar to within ±10%. The length of initial crack at the estimated initiation time could be quantified using the linear relationship between the cumulative AE intensity and crack length. Back extrapolation method was used to estimate the actual crack initiation length at the time of observation of the first jump in AE-Intensity event for each experiment. The results show that cumulative AE counts as well as cumulative AE amplitude have increasing correlation with the measured crack sizes. Obviously there is a remarkable similarity between the correlation of AE amplitude and AE counts with the small crack size. The total crack initiation length studied was 0.5 mm AE signals were detected at a crack length of about 8 um.
Crack extension
Based on the LEFM principles, the crack length vs. number of fatigue cycles were plotted in Figure 3 using Equation 9.


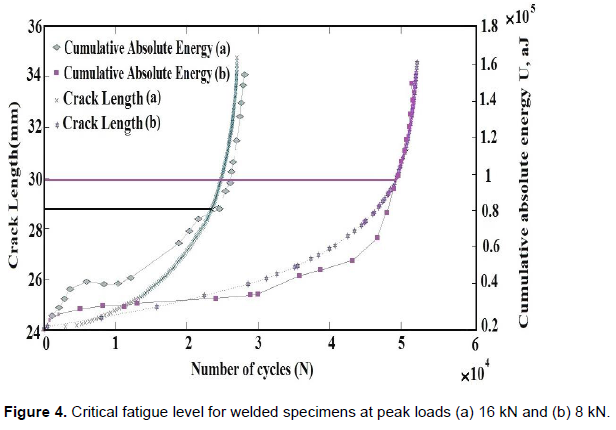
In order to determine crack growth and AE constants, AE data were picked below the critical level of fatigue crack growth. The critical levels of crack growth in the specimens were determined from the cumulative absolute energy and crack length versus load cycles plotted at the various peak loads (a = 16 kN, b = 8 kN) for both welded specimen (Figure 4) and base metal (Figure 5) respectively. As seen from the figures, the critical level of fatigue crack growth for the weld at 16 kN occurred at crack length of 29.1 mm, for welded specimen at 8 kN the critical level occurred at a crack length of 29.9 mm. The critical fatigue levels for base metal were also recorded at crack length of 30.6 and 31.8 mm for both 16 and 8 kN peak loads respectively.Figures 6 and 7 show the plot of crack growth rate and absolute energy rate versus stress intensity factor range for the welded specimens (a and b). The linear least square regression method was applied to obtain the logarithm of the above named constants, where after, the constants c, Be, were estimated. The constants m, and p indicates the slope of the line while the logs of (c and, Be,) determines the location of the straight line. It is evident from the above results that, AE absolute energy rate is an efficient means of determining the critical level of fatigue cracking in steel structures. Critical fatigue crack level in the welded specimen is reached earlier than in the base metal and at a lower AE energy rate, this suggest that, crack propagates faster in the welded specimen than in the base metal.


Using the theoretical model developed, the remaining fatigue life was predicted from the critical fatigue level to fracture using Equation 7.
The theoretically predicted extension was compared with experimental results from digital imaging correlation (DIC) for verification. Thorough discussion of the DIC technique has been reported by (Mathieu et al., 2012; Luo et al., 1993; McNeill et al., 1987; Carroll, 2011; Roux and Hild, 2006). Figures 8 and 9 show DIC strain (a) and displacement (b) images for base metal and welded specimen respectively during critical fatigue cycles at peak loads of 16 kN. The plots of experimental (DIC) and theoretically predicted fatigue crack extension for both base metal and welded specimens at two peak loads are shown in Figures 10 and 11 respectively. It is observed that crack propagated faster in the welded specimens under higher peak loads than the base metal specimens.
As discussed earlier on, crack propagates faster in the welded specimen than in the base metal specimen due to micro-structural differences. It is also evident that, AE absolute energy rate is a convenient way of determining the critical fatigue levels as compared to AE count rates (Roberts and Talebzadeh, 2003). Slight deviations were found between the AE results and the DIC results close to the point of fracture due to DIC image distortions at the point of fracture. For the DIC analyses, deviations possibly resulted from inappropriate application of speckle pattern, possibilities of dust on the specimens’ surface after application of patterns, and calibration errors. The presence of back ground noise disturbed the AE signals detected during crack initiation stage, however, AE technique was able to detect cracks at a length less than 8 um.
The authors have not declared any conflict of interests.
REFERENCES
|
Aggelis DG, Kordatos EZ, Matikas TE (2011). Acoustic emission for fatigue damage characterization in metal plates. Mech. Res. Commun. 38:106-110.
Crossref
|
|
|
|
Anderson TL (1995). Fracture Mechanics-Fundamentals and Applications, 2nd ed. CRC Press.
|
|
|
|
Biancolini ME, Brutti C, Paparo G, Zanini A (2006). Fatigue cracks nucleation on steel, acoustic emission and fractal analysis. Int. J. Fatigue 28:18-1825.
Crossref
|
|
|
|
Boris AZ, JM Caicedo, Yu J, Ziehl P (2012). Deterministic and probabilistic fatigue prognosis of cracked specimens using acoustic emissions. J. Constr. Steel Res. 76: 68-74.
Crossref
|
|
|
|
Carpinteri A, Lacidogna G, Pugno N (2007). Structural damage diagnosis and life-time assessment by acoustic emission m onitoring. Eng. Fract. Mech. 74:273-289.
Crossref
|
|
|
|
Carroll J (2011). Relating fatigue crack growth to microstructure via multi-scale digital image correlation. PhD Dissertation University of Illinois at Urbana-Champaign.
|
|
|
|
Grosse CU, Ohtsu M (2008). Acoustic emission testing: basics for research- application in civil engineering. Library of congress control number: 2008930125.
|
|
|
|
Hamstad MA (2007). Acoustic Emission Source Location in Thick Steel Plate by Lamb Modes. J. Acoustic Emission 25:194-214.
|
|
|
|
Han Z, Luo H, Cao J, Wang H (2011). Acoustic emission during fatigue crack propagation in micro-alloyed steel and welds. Mater. Sci. Eng. 528:7751-7756.
Crossref
|
|
|
|
Harris DQ, Dunegan HL (1974). Continuous monitoring of fatigue-crack growth by acoustic emission techniques. Experimental Mech. 14:71-81.
Crossref
|
|
|
|
Khamedi R, Fallahi A, Oskouei AR (2010). Effect of martensite phase volume fraction on acoustic emission signals using wavelet packet analysis during tensile loading of dual phase steels. Mater. Des. 31:2752-2759.
Crossref
|
|
|
|
Luo PF, Chao YJ, Sutton MA, Peters WH (1993). Accurate measurement of three dimensional deformations in deformable and rigid bodies Using Computer Vision. Exp. Mech. 33(2):123-132.
Crossref
|
|
|
|
Mathieu F, François H, Stéphan R (2012). Identification of a crack propagation law by digital image correlation. Int. J. Fatigue 36:146-154.
Crossref
|
|
|
|
McNeill SR, Peters WH, Sutton MA (1987). Estimation of stress intensity factor by digital image correlation. Eng. Fract. Mech. 28:101-112.
Crossref
|
|
|
|
Nivesrangsan P, Steel JA, Reuben RL (2007). Source location of acoustic emission in diesel engines. Mech. syst. Signal Process. 21:1103-1114.
Crossref
|
|
|
|
Nykänen T, Li X, Björk T, Marquis G (2005). A parametric fracture mechanics study of welded joints with toe cracks and lack of penetration. Eng. Fract. Mech. 72(10):1580-1609.
Crossref
|
|
|
|
Pullin R, Holford KM, Baxter MG (2005). Modal analysis of acoustic emission signals from artificial and fatigue crack sources in aerospace grade steel. Key Eng. Mater. 293:217-226.
Crossref
|
|
|
|
Rabiei M, Modarres M (2013). Quantitative methods for structural health management using in situ acoustic emission monitoring. Int. J. Fat 49:81-89.
Crossref
|
|
|
|
Roberts TM, Talebzadeh M (2003). Fatigue life prediction based on crack propagation and acoustic emission count rates. J. Constr. Steel Res. 59:679-694.
Crossref
|
|
|
|
Roux S, Hild F (2006). Stress intensity factor measurements from digital image correlation: Post-processing and integrated approaches. Int. J. Fract. 140:141-157.
Crossref
|
|
|
|
Schijve J (1967). Significance of fatigue cracks in micro-range and macro-range. ASTM STP 415:415-459.
|
|
|
|
Shigeishi M, Colombo S, Broughton KJ, Rutledge H, Batchelor AJ, Forde MC (2001). Acoustic emission to assess and monitor the integrity of Bridges. Constr. Building Mater. 15:35-49.
Crossref
|
|
|
|
Singh PJ, Mukhopadhyay CK, Jayakumar T, Mannan SL, Baldev R (2007). Understanding fatigue crack propagation in AISI 316 (N) weld using Elber's crack closure concept: Experimental results from GCMOD and acoustic emission techniques. Int. J. Fatigue 29:2170-2179.
Crossref
|