ABSTRACT
Rice is recently introduced in Ethiopia, rice production is expanding very fast. However, the grain quality of the high yielding varieties in the country is not well characterized. The present study was carried out to evaluate some important physical characteristics and nutritional qualities of 15 rice genotypes. The experiment was conducted at Bahirdar University food and nutrition laboratory from July to August, 2015. AT 401, IR 66946 and IR 73055 had significantly the longest kernel. Most of the genotypes had bold type of appearance which is a good physical characteristic. The 1000 kernel weight was good in most of the genotypes except for IR 72048 and IR 72593. IR 55179, IR 59418 and IR 71810 had the highest bulk density and were round shaped. The chalkiness was minimum in genotypes IR 70023 (5.63%), IR 71991 (11.27%) and IR 72048 (11.91%). The protein and fiber content was higher in AT 401, IR 70023 and IR 71901. IR 29 was superior in fat content. The correlation between the physical and nutritional characteristics was very minimum which indicates the independency of the two. Although the nutritional and physical characters are within the acceptable range, there would be a chance for improvement of both quality since it contributes through selection and crossing.
Key words: kernel, genotype, physical characteristics, nutrition content.
Rice is one of the most strategic crops in Africa, and particularly in Ethiopia (Kijima et al., 2008). Ethiopia being the second most populous nation in sub-Sahara Africa, rice is one of the target commodities that have received due emphasis in promotion of agricultural production and is considered as the “Millennium Crop”. Ethiopia has considerably vast suitable ecologies for rice production which are unsuitable for production of other food crops (MOARD, 2010).
Rice is an economically important crop that is entirely used as a food for human population (Otegbayo et al., 2001). It is known by its nutritional diversification with wide range of adaptation that led to evolution of thousands of varieties having diverse cooking, eating and nutritional characters (Bhattacharya, 2005). Because of these wide ranges of diversification, rice is widely consumed all over the world (Hossain et al., 2009). The functional quality of rice may be considered from the point of view of size, shape and appearance of the grain, milling quality, cooking properties and nutritional contents (Bhonsle and Sellappan, 2010).
The grain length, breadth and length/breadth ratio are determining factors especially considered in cooking, and this mostly depend on consumer’s preference. Rice grain is classified as long, medium and short depending on their length (IRRI, 2015). Moreover, based on their ratio, it can be slender, bold and round (Dipti et al., 2002, 2003). The increase in length of rice kerenel is more desirable than the increase in breadth (Hossain et al., 2009). In Bangladesh small grain varieties are highly preferred for Polo, firni and other dishes. Modern varieties have short to medium bold translucent appearance (Biswas et al., 1992).
Rice is the main source of carbohydrate for more than 33% of the world population (Thongbam et al., 2012). It is known to have high quantity of carbohydrate; most of the studied rice varieties contain more than 80% carbohydrate (Thomas et al., 2013; Oko and Ugwu, 2011). High carbohydrate content in rice indicates good source of energy. Rice is a poor source of protein but it has high quality protein (lysine) because of its unique nutritional composition (Thongbam et al., 2012). Rice supplies more than 50% the total protein in most rice consuming countries (Diako et al., 2011). Protein content in most of the studied varieties ranged from 5.3 to 11.5% (Thongbam, 2012; Diako et al., 2011).
Fat content of rice ranges from 0.5 to 3.5% (Oko and ugwu, 2011) but the bran of rice is known by its high fat content up to 22.5% in some traditional varieties (Ravi et al., 2012). Indica type of rice has lower fat content than japonica type (Thongbam et al., 2012). Amylose content of rice has inverse relation with lipid content that as amylose content increases fat content decreases and vice versa (Thongbam et al., 2012).
In the past few years of research conducted in rice in Ethiopia, most of the objectives were focused on increasing in productivity. Thus, there is a lack of information on grain quality of the released rice varieties in Ethiopia. Therefore, the present study was conducted to evaluate some important physical characteristics and nutritional qualities of fifteen rice genotypes.
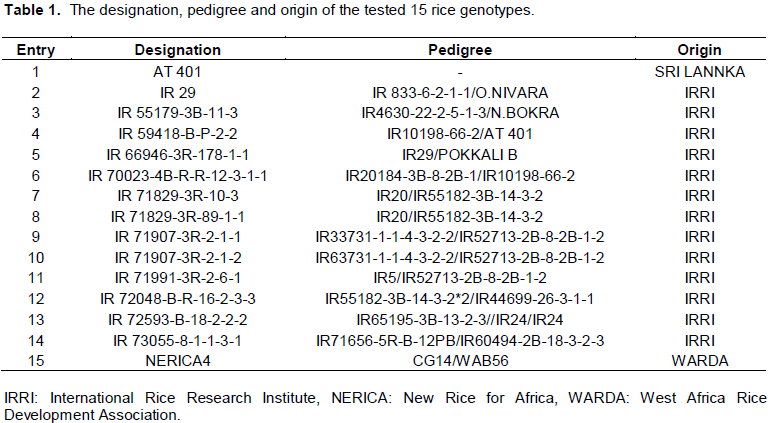
The study was conducted at the food and nutrition laboratory of Bahirdar University from July to August, 2015. The grain samples were collected from Werer Agricultural Research Center (WARC). The rice genotypes were under field evaluation at WARC for the last two years for their yield and other agronomic traits. The tested 15 rice genotypes are listed in Table 1. For sake of simplification, the long names of some genotypes will be shortened in the results section by using only the first 7 characters.
Physical analysis
Paddy kernel size /dimension (breadth, length and thickness) were measured using a digital caliper (± 0.001mm). The length, breadth and thickness of 25 kernels of each genotype were measured, and average value was taken. To obtain paddy shape, the following equation was used: Length-to-breadth ratio= average paddy length/average paddy width. The weight of 1000 kernels was determined by counting 1000 kernels, and taking their weight using electronic weighing balance. Bulk density was calculated by taking the weight samples of non-broken rice grains in 100 L using a standard laboratory hectoliter weight apparatus (EASY-WAY hectoliter weight test machine) as described in the AACC (2000) Method No 55 to10.
To determine chalkiness, 200 whole grains werw selected randomly and visual rate of chalky property was used to measure chalkiness based on standard evaluation system (Ravi et al., 2012). In order to select and segregate the chalky grains (over 20% chalkiness), the percentage of chalky grains were determined using the equation:
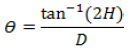
To determine the angle of repose of the paddy rice grains, a tube with 110 mm diameter and 120 mm height is kept vertically on a horizontal glass floor and filled with the sample from a height of 150 mm. The tube is slowly raised over the glass floor so that the whole seed could slide and form a heap. The angle of repose is calculated using the following equation (Ravi et al., 2012).
Where, θ is the angle of repose in degrees, H and D are the height and diameter of the heap in mm, respectively.
Proximate/Nutritional analysis
Protein content was calculated by taking nitrogen content of the rice samples. The nitrogen content of each rice genotype was determined by improved micro-Kjeldahl method 46-11 (AACC, 2000). About 1 g of flour sample was weighed into Kjeldahl digestion flasks, and catalyst mixture (K2SO4 and CuSO4.5H2O) was added into each flask. Then 15 mL of concentrated H2SO4 (98%) was added in to the sample until digestion is complete at 350°C, and the solution ibecame clear white. After complete digestion (when the digested sample becomes colorless or light blue), the samples were allowed to cool. After the samples were cooled, 50 mL of distilled water was added into each digestion flask followed by 50 mL of 40% NaOH. Immediately, the contents are distilled by inserting the digestion tube line into the receiver flasks that contains 25 mL of 4% boric acid solution.
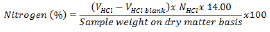
The collected ammonia distillate was then titrated against a standardized 0.1N HCl until the end of the titration is attained (where the titration color changes from green to pink). Then the volume of HCl consumed to reach the titration end point was read from the burette, and the nitrogen content percentage was calculated as follows:
Where: VHCl is volume of HCl in L consumed to the end point of titration, VHCl blank is volume of HCl consumed in L to titrate the blank (sample containing all chemicals for Kjeldahl procedure except digestible sample), NHCl is the normality of the HCl used and 14.00 is the molecular weight of nitrogen. A conversion factor of 5.97 was used to convert %N to %protein (AOAC, 1970). Urea was used as a control for calibration in the analysis.
For determination of fat content, 250 mL clean boiling flasks were oven dried at 105 to 110°C for about 30 min, and cooled in desiccator. About 2.0 g of samples were weighed accurately into labeled thimbles.
The dried boiling flasks were weighed correspondingly and filled with about 300 ml of petroleum ether (boiling point 40 to 60°C). The extraction thimbles were plugged tightly with cotton wool. After that, the Soxhlet apparatus was assembled and allowed to reflux for 6 h. The thimble was removed with care and petroleum ether collected from the top container, and drained into another container for re-use. After that, the flask was dried at 105 to 110°C for 1 h when it was almost free of petroleum ether. After drying, it was cooled in a desiccator and weighed. Then, the rice sample fat content (%) was computed as follows (AOAC, 2000).
For determination of crude fiber content, rice samples were digested in 1.25% H2SO4 followed by 1.25% NaOH solution and crude fiber content was determined according to AACC method (2000). Then total carbohydrate was determined by subtracting the sum of the total values of crude protein, lipid, crude fiber, moisture and ash constituents of the sample from 100.
Data analysis
For each genotype, the data were taken three times from the same sample. They were subjected to analysis of variance (ANOVA) in completely randomized design (CRD) using GLM procedure of SAS (statistical analysis system) version 9.0 (SAS, 2002). Comparison of treatment means at 5% level of probability was done using least significant difference (LSD) test. To investigate the interrelationship of physical and nutritional characteristics simple linear correlation analysis was conducted.
Physical characteristics of the fifteen rice genotypes
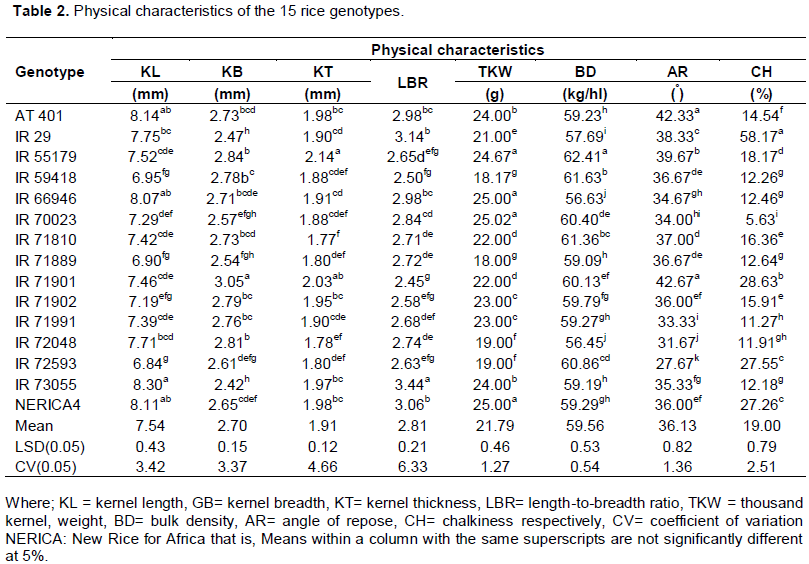
The length, breadth, thickness and length-to-breadth ratio of the 15 rice genotypes ranged from 6.84 to 8.3 mm, 2.42 to 3.04 mm, 1.78 to 2.14 mm and 2.45 to 3.44 respectively (Table 2). The grain length of IR 73055, AT 401, NERICA 4 and IR 66946 were significantly (P < 0.05) longer than all others except IR 29, and IR 72048. IR 71901 was significantly (P < 0.05) higher in breadth than all others. Significant differences (P < 0.05) were observed among rice genotype for grain thickness. The thickest grains were found in IR 55179 and IR 71901. As well, significant differences (P < 0.05) were observed for length-to-breadth ratio with IR 73055 having the highest value followed by IR 29 and NERICA 4.
The angle of repose was significantly low in genotypes IR 72593 and IR 72048 whereas, IR 71901, AT 401 and IR 55179 had the highest angle of repose. According to Mohsenin (1986), the standard value of angle of repose for paddy rice was identified to be 35.83°. The slight increase in angle of repose may be attributed to increase in friction due to increase moisture content during the storage period of paddy rice. Six genotypes had good milling out turn but the released variety NERICA 4 (36°) was slightly susceptible to breakage (Table 2).
Genotypes IR 70023, IR 71991 and IR 72048 had significantly (P < 0.05) smaller chalkiness value while IR 29, IR 71901 and IR 72593 had significantly higher chalkiness (Table 2). The rice varieties having minimum amount of chalkiness is considered as good quality grains in comparison with chalky ones (Bhonsle and Sellapan, 2010). The greater amount of chalkiness in the grain indicates that it is more prone to grain breakage during milling, which results in lower head rice recovery (Kush et al., 1979). This is caused by loose arrangement of starch granules with air spaces which is initiated by different environmental stresses such as drought, disease and high temperature (Lang et al., 2013). Although it is not significantly (P < 0.05), the highest NERICA 4 (the released variety) had high amount of chalkiness followed by IR 29, IR 71901 and IR 72048 which makes it more prone to breakage.
Proximate composition analysis
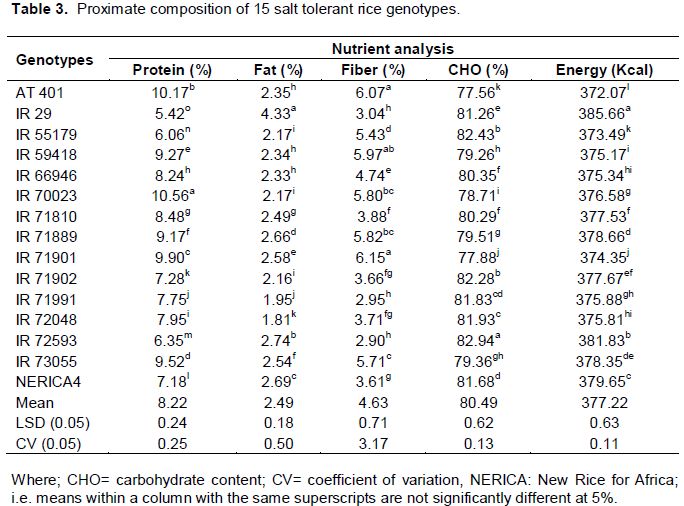
Protein content
The analysis revealed significant differences of protein content among the 15 rice genotypes. The protein content of 10.56% in IR 70023 was the highest. It was followed by AT 401, IR 71901, IR 73055 and IR 59418 (Table 3). The lowest protein contents were found in IR 29, IR 55179 and IR 72593. Generally, the protein content of the 15 rice genotypes ranged from 5.3 to 10.55%. This result agrees with earlier findings by Diako et al. (2011) who found a range of 5.10 to 5.9% on physicochemical characterization of four commercial Ghanaian varieties, and 7.77 to 11.48% on evaluation of indigenous rice cultivar in India (Thongbam et al., 2012). Although the protein content of rice is very low compared to other cereals, it has high quality protein because of its unique composition of essential amino acids such as lysine (Rani, 2006).
Fat content
IR 29, IR 72593, NERICA 4 and IR 71889 were found with significantly higher fat content while IR 71991, IR 71902, IR 55179 and IR 70023 had significantly lower amount of fat (Table 3). The study of Oko and Ugwu (2011) on local rice varieties at Abakaliki region, Nigeria indicated that the fat content of rice varieties ranged from 0.5 to 3.5%. The present study showed higher range of fat content (1.81 to 4.33%).
Fiber content
The fiber content of the 15 rice genotypes ranged from 2.90 to 6.15%. The genotypes with significantly (P < 0.05) higher crude fiber content were IR 71901 and AT 401. Genotype IR 72593, IR 71991 and IR 29 had significantly smaller fiber content (Table 3). The fiber content ranges from 2.90 to 6.15% which is much more than the finding of Oko et al. (2012) who found 1.00 to 2.50% in the study of 20 local and newly introduced varieties in Ebonyi state, Nigeria But Fadaei and Salehifar (2012) found that the fiber content in the husk of rice is 3 to 5 times higher.
Carbohydrate content
The carbohydrate content of the 15 rice genotypes was ranged from 77.56 to 82.94% (Table 3). The analysis of variance showed significant differences (P < 0.05) among genotypes. Genotype IR 72593 with 82.9% had the highest carbohydrate content. It was followed by IR 55179 and IR 71902. Genotypes AT 401, IR 71901 and IR 70023 had the lowest contents of carbohydrate. The high percentage carbohydrate contents of these rice varieties could make them good sources of energy (Oko and Uwgu, 2011). Rice is the main source of carbohydrates for more than one third of the people in world (Thongbam et al., 2012). The energy value measures the available amount of energy obtained from food through cellular respiration (Thomas et al., 2013). The energy content was significantly (P < 0.05) high in IR 29, IR 72593 and NERICA 4. The lowest energy content was found in AT 401, IR 55179 and IR 71901 (Table 3).
Correlation among physical characteristics and nutritional composition
Kernel length had significant correlation with length-to-breadth ratio, kernel thickness, bulk density and thousand kernel weight (Table 4). It was positively correlated with length-to-breadth ratio (r = 0.75**) and thousand kernel weight (r= 0.65***) which indicates that the more slender the rice grain, the longer the grain and the greater the weight. The correlation between kernel length with length-to-breadth ratio was also found positive in the experiments of Odenigbo et al. (2014), Rafii et al. (2014) and Seraj et al. (2013) on the study of correlation of grain quality traits in aromatic rice lines. A study by Mia et al. (2012) on aromatic fine grain rice showed that the grain weight increases with kernel length that agrees with the present finding. The study of Basri et al. (2015) on four local varieties in India also reveals positive correlation of grain weight and length.
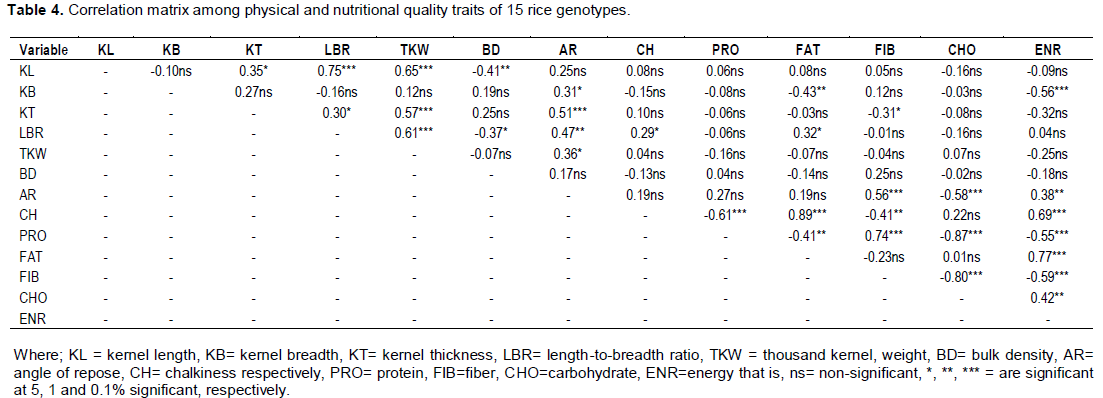
There was positive and significant correlation between kernel thicknesses with 1000 grain weight (0.57***) and angle of repose (0.51***). The positive correlation of kernel width and thickness with angle of repose reveals the increase in breadth and thickness increases the susceptibility of rice grains to breakage during milling. Length-to-breadth ratio had positive and significant correlation with angle of repose (r = 0.47**), and 1000 kernel weight (r= 0.61*). This indicates that as length-to-breadth ratio increases rice grain is more prone to breakage. Thomas et al. (2013) found negative correlation between length-to-breadth ratio, and 1000 kernel weight on grain quality study of marketed milled rice varieties in Penang, Malaysia which is not at par with the present result. This may be due to varietal difference but logically the present finding is supported because it is obvious that the increase in length will add on the weight of the rice kernels. Chalkiness significantly correlated to protein, fat, fiber and energy; but the relation was negative with protein (r = -0.61***) and positive with fat (r= 0.89***) and energy (r= 0.69***).
Protein content and other nutritional parameters were not correlated with most of the physical characters with the exception of chalkiness, angle of repose and kernel breadth. This shows that the variations in physical characteristics did not affect the nutritional content of rice grains. The relation between protein and other nutritional parameters such as carbohydrate (r=-0.87***) and energy (r=-0.55***) was negative and very highly significant, while it was positive and very highly significant with fiber (r=0.74***). The relation between fat and energy content (r= 0.77) was very highly significant and positive. Thongbam et al. (2012) found negative correlation between protein and carbohydrate content and positive correlation between protein and fat content in their study of grain quality of indigenous Indian rice cultivars. There was very highly significant and negative correlation between fiber, carbohydrate (-0.80***) and energy content (-0.59***).
The appearance of kernel is very important for consumers to judge the quality of rice (Dipti et al., 2003), but the preference of consumers differ from one place to another. Long grain is known to attract high market price (Alka et al., 2011).
The classification of IRRI (2015) showed that rice kernel with length-to breadth-ratio greater than 3.0 is classified as slender; ratios between 2 and 3 are bold grains, while ratios < 2 are round. Therefore, the present findings showed that three genotypes (IR 29, IR 73055 and NERICA 4) had slender type of grain, and the others had bold type that can be preferred by most of the consumers. The thousand kernel weight (TKW) ranged from 19 to 25 g. According to Ravi et al. (2012) when TKW is less than 20 g, it indicates the presence of immature and damaged grains. Thus, all of the tested 15 genotypes had minimum number of immature grains with the exception IR 72048 and IR 72593.
Genotypes IR 70023, IR 66946, NERICA 4 and IR 72593 had significantly (P < 0.05) highest TKW which is good indication of firm and bold grains. The bulk density of the fifteen rice genotypes ranged from 56 to 62 kg/hl. Bulk density is related to the shape and length-to-breadth ratio; where the more round the kernel the higher the bulk bulk density (Ravi et al., 2012). Genotypes IR 55179, IR 59418 and IR 71810 had significantly (P < 0.05) higher bulk density which indicated their roundness, while IR 66946 and IR 72048 had significantly (P < 0.05) lowest bulk density that falls under slender type of kernel. Fat content influences the taste of cooked rice, rice with high fat content tends to be tastier and they have less starch (Taira and Fujii, 1979). Some genotypes are found with low carbohydrate contents, this low carbohydrate content may be attributed to the high moisture content which also affected the milling quality and other environmental factors (Oko and Uwgu, 2011).
The authors have not declared any conflict of interests.
The financial support of EAAP and SARD-SC Rice project is greatly acknowledged. The authors also thank Mr. Agumass Admassaie for his support in the laboratory analysis.
REFERENCES
|
AACC (2000). American Association of Cereal Chemists. Approved methods of American Association of Cereal Chemists.10th eds. St Paul, Minnesota, USA.
|
|
|
|
Alka IC, Ituma JO, Ekwu FC (2011). Physical and chemical properties of some selected rice varieties in Ebony state. Niger. J. Biotechnol. 22:40-46.
|
|
|
|
|
AOAC (2000). Association of Official Analytical Chemists. Official Methods of Analysis 17th (eds). Washington DC, USA Association of official Analytical Chemists.
|
|
|
|
|
Basri F, Sharma HP, Jain P, Mohato G (2015).Grain quality and starch evaluation of local varieties of rice (Oryza Sativa L.) growing in Jarkahand state, India. International Journal of Current Research 7(1):11895-11900.
|
|
|
|
|
Bhattacharya KR (2005). The chemical basis rice end-use quality. In: Toriyama K., Heong K. L. Kardly B. (eds) Rice is life: scientific perspectives for the 21st century. Proceedings of the World Rice Research Conference held in Tsukuba, Japan, 4-7 November 2004 2005 pp. 246-248.
|
|
|
|
|
Bhonsle SJ, Sellappan K (2010). Grain Quality evaluation of traditionally cultivated rice varieties of GOA, India. Recent Res.Sci. Technol. 2(6):88-97.
|
|
|
|
|
Biswas SK, Banu B, Kabir KA, Begum F, Choudhury NH (1992). Physicochemical properties of modern and local rice varieties of Bangladesh. Bang. Rice J. 3:128-131.
|
|
|
|
|
Diako C, Manful JT, Johnson PN, Sakyi DE (2011).Physicochemical Characterization of Four Commercial Rice Varieties in Ghana. Adv. J. Food Sci. Technol. 3(3):196-202.
|
|
|
|
|
Dipti SS, Bari MN, Kabir KA (2003). Grain Quality Characteristics of Some Beruin Rice Varieties of Bangladesh. Pakistan J. Nutr. 2(4):242-245.
Crossref
|
|
|
|
|
Dipti SS, Hossain ST, Bari MN, Kabir KA (2002).Physicochemical and Cooking Properties of Some Fine Rice Varieties. Pakistan J. Nutr. 1(4):188-90.
Crossref
|
|
|
|
|
Fadaei V, Salehifar M (2012). Rice husk as a source of dietary fiber. Scholars Res. Libr. 3 (3):1437-1442.
|
|
|
|
|
Hossain MS, Singh AK, Zaman FU (2009). Cooking and eating characteristics of some newly identified inter sub-specific (indica/japonica) rice hybrids. Sci. Asia 35:320-25.
Crossref
|
|
|
|
|
IRRI (2015). International Rice Research Institute. Quality seed rice. (1st eds) Rice Production Manual module 3. Los Banos, Philippines.
|
|
|
|
|
Kush GS, Paule CM, Dela CN (1979). Rice grain quality evaluation and improvement at IRRI. In: Proceedings of the workshop on chemical aspect of rice grain quality, IRRI, Los Banos, Philippines pp. 21-31.
|
|
|
|
|
Kijima Y., Otsuka K, Futakuchi K (2008). The development of agricultural markets in sub Saharan Africa: the case of rice in Uganda. Afr. J. Agric. Resour. Economics 8(4):253-264.
|
|
|
|
|
Lang NT, Xa TT, Luy TT, Buu BC (2013). Rice breeding for grain quality in the Mekong delta. Omonrice 19:54-60.
|
|
|
|
|
Mia AB, Das MR, Kamurzzaman M, Talukder NM (2012). Biochemical traits and phyico-chemical attributes of aromatic fine rice in relation to yield potential. Am. J. Plant Sci. 3:1788-1795.
Crossref
|
|
|
|
|
MOARD (2010). Ministry of Agriculture and Rural Development National Rice research and development strategy of Ethiopia. MOARD, Addis Ababa, Ethiopia P 48.
|
|
|
|
|
Mohsenin NN (1986). Physical properties of plant and animal materials (2nd eds). Gorder and Breach science publisher.Newyork USA P 891.
|
|
|
|
|
Odenigbo AM, Ngadi M, Ejebe C, Woin N, Nedindeng S (2014). Physicochemical, cooking characteristics and textural properties of TOX 3145 milled rice. J. Food Res. 3(2):82-90.
Crossref
|
|
|
|
|
Oko AO, Ugwu SI (2011).The proximate and mineral compositions of five major rice varieties in Abakaliki, South-Eastern Nigeria. Int. J. Plant Physiol. Biochem. 3(2):25-27.
|
|
|
|
|
Otegbayo BO, Osamuel F, Fashakin JB (2001). Effect of parboiling on physico-chemical qualities of two local rice varieties in Nigeria. The J. Food Technol. Afr. 6(4):130:32.
|
|
|
|
|
Rafii MY, Zakiah MZ, Asfaliza R, Haiffa MD, Latif MA, Malik MA (2014). Grain quality performance and heritability estimation in selected F1 rice genotypes. Sains Malaysiana 3(1):1-7.
|
|
|
|
|
Rani SN, Pandey MK, Prasad GS, Sudharshan I (2006). Historical significance, grain quality features and precision breeding for improvement of export quality basmati varieties in India. Indian J. Crop Sci. 1(1-2):29-41.
|
|
|
|
|
Ravi U, Menon L, Gomaty G, Parimala C, Rajishewari R (2012). Quality analysis of Indigenous organic Asian Indian variety- Salem samba. Indian J. Tradit. Sci. 11(1):114-22.
|
|
|
|
|
Seraj S, Hassan L, Begum SN, Sarker MM (2013). Physico-chemical attributes and correlation among grain quality traits of some exotic aromatic rice lines. J. Bangladesh Agric. Univ. 11(2):227-232.
|
|
|
|
|
Taira H, Fujii K (1979). Influence of cropping season on lipid content and fatty acid composition of lowland nonglutinous brown rice. Nippon Sakamotsu Gakkai Kiji. J. Crop Sci. 48:220-228.
|
|
|
|
|
Thomas R, Wan-Nandiah WA, Bhat R (2013). Physicochemical properties, proximate composition and cooking qualities of locally grown and imported rice varieties marketing in penang, Malaysia. Int. Food Res. J. 20(3):1345-1351.
|
|
|
|
|
Thongbam PD, Tarentoshi P, Raychaudhury M, Durai A, Das SP, Ramesh T, Patiram KT, Ramya KT, Abdul FR, Ngachan SV (2012). Studies on grain and food quality traits of some indigenous rice cultivars of North-eastern Hill Region of India. J. Agric. Sci. 4(3):1-12.
|
|