Full Length Research Paper
ABSTRACT
Being the backbone of the Ethiopian economy, agricultural practice has been traditionally dominated for centuries by small-scale farmers. Even though small-scale irrigation is practiced in the study area, its impact on household income is not analyzed systematically for further policy action. This study was conducted to evaluate the impact of participation in small-scale irrigation on household income in Abay Chomen district. In this study, two-stage sampling technique was used to select 167 target respondents. The primary data were collected using an interview schedule and conducting of focus group discussions and key informant interview. Various documents, such as published journals, policy documents, were reviewed to collect secondary data. Propensity score matching method of impact evaluation has been employed. The Propensity Score Matching model result revealed that participation in small-scale irrigation had a significant effect on household income. Since participation in small-scale irrigation have significant effect in improving household income, the government, especially Irrigation Development Office of the district should attempt to hamper factors that hinder participation in small-scale irrigation and enhance factors that initiate participation to improve participation in small-scale irrigation and hence household income in the study area.
Key words: Household income, participation, propensity score matching, small-scale irrigation
INTRODUCTION
In spite of agriculture status as the backbone of the Ethiopian economy, agricultural practice has been traditionally dominated for centuries by small-scale farmers and its performance has long been adversely affected by shortage of rain and water that left many to sustain their lives on famine relief support (Abebe et al., 2011). From the total production, about 97% of Ethiopia’s food crops are produced by rain-fed agriculture, whereas only 3% is from irrigated agriculture (FAO, 2015). Due to high dependency on rain-fed agriculture, other topographic and low adaptive capacity along with other related factors, Ethiopia ranks the ninth most susceptible country in the world to natural disasters and weather-related shocks (Tongul and Hobson, 2013). But the small-scale irrigation (SSI) contributes to poverty alleviation by enhancing productivity which leads to an increase in income and promoting economic growth and employment (Garcia-Bolanos et al., 2011). Irrigation also changes the lives of the rural households by increasing their production and productivity. A rapid increase in the area covered by irrigation, especially small-scale water use, provides farmers with opportunities to raise output on a sustainable basis and contribute to the reliability of food supplies (FAO, 2012). This indicates that there should be new means of production through irrigation water application by smallholder farmers rather than strongly relying on rain-fed agriculture. Hence, increasing the opportunity and reducing the hindrance to irrigation participation needs to be made because irrigation is one means by which agricultural production can be increased to meet the growing food demands in Ethiopia, since agriculture still plays a critical role in the economy.
There are different traditional and modern irrigation technologies that can be applied in Sub-Saharan Africa (Kay, 2001). Out of these, a wide range of well-established traditional technology options available for use by smallholders include bucket watering, water harvesting, swamp irrigation, spate irrigation, flood plain irrigation using seasonal water and shallow aquifers, as well as groundwater irrigation. All irrigation technologies have the potential to raise the productivity of water and labour (Abebe et al., 2011). Trickle and sprinkle irrigation along with piped supplies technologies are particularly relevant to smallholder farmers in developing countries because they are constrained in many ways, which makes them a priority for development efforts (Mwangi and Kariuki, 2015).
Ethiopia is a rich country in water resource and most of the time it is termed as a water tower of East Africa because of its abundant water resource availability (Adugna, 2014). It has a huge potential of water resource which accounts for 122 billion meter cube annual surface runoff and 2.9 billion meter cube groundwater, though it is characterized by uneven spatial and temporal distributions (Tesfa and Tripathi, 2015). However, Ethiopia is using very little of its abundant water resource potential for irrigated agriculture (ATA, 2016). Even though there is no similar evidence about the potential it have from different sources, Ethiopia has a high irrigation potential. The estimated total irrigable land potential in Ethiopia is 5.3 Mha assuming use of existing technologies, including 1.6 Mha through rain water harvesting and ground water (Awulachew, 2010).
Recent source indicates that, the total area of irrigated land in Ethiopia increased from 885,000 ha to 2.4 million ha from 2011 to 2015 with a plan of increasing irrigated land to 4 million by 2020 (ATA, 2016), including the 658,340 ha of land developed with high and medium irrigation schemes (NPC, 2015). Nevertheless, there is a plan to expand the high and medium schemes to about 954,000 ha by the end of the GTP-II (2019/20). Evidence also shows that, in Ethiopia, farm size per household is 0.5 ha and the irrigated land per households’ ranges from 0.25 - 0.5 ha on average (MoA, 2011).
The population of the world is increasing and hence the food demand, but not the supply side. Sources indicate that compared to 2009, by 2050, 70% more food production is required to meet the global food demand and 100% for developing countries (Dubois, 2011). This shows that the growth in food demand for developing countries is very high as compared to developed countries, and this phenomena is the same for Ethiopia. The population of Ethiopia has been increased and it is above one hundred million currently (United Nations, 2017). To feed this highly increasing population, extensive system of increasing the agricultural product may not satisfactorily work since the supply of land is constant. The impact of participation in small-scale irrigation is significant in the world, because irrigation plays a fundamental role in world food provision. However, until recent years, it has performed below expectations in Sub-Saharan Africa (Garcia-Bolanos et al., 2011).
The farmers in Abay Chomen district fails to produce when there is shortage of rainfall despite its plenty of water resource potential that can be applied to agriculture. The farmers in the study area, Abay Chomen district, has been affected by the extreme events of climate change such as drought, flood and hailstone that lead the farmers to crop failure in different years (DOoARD, 2016). Nonetheless, irrigation can change the life of rural households (Abebe et al., 2011) and this can help the farmers overcome the problem of shortage of rainfall and crop failures due to hailstorm and flood. In addition to this, according to Dereje and Desalegn (2016), small-scale irrigation (SSI), both directly and indirectly, has a great impact on enhancing farmers’ livelihoods through different dimensions, such as diversification of crops grown, as well as increased agricultural production, household income, but the impact of the irrigation on household income is not analyzed systematically in the study area, even though impact evaluation is the major policy issue. Because there was no study conducted on irrigation impact analysis conducted in the study area, therefore, the objective of this study is to analyze the impact of irrigation practice on household income in Abay Chomen district.
RESEARCH METHODOLOGY
Description of the study area
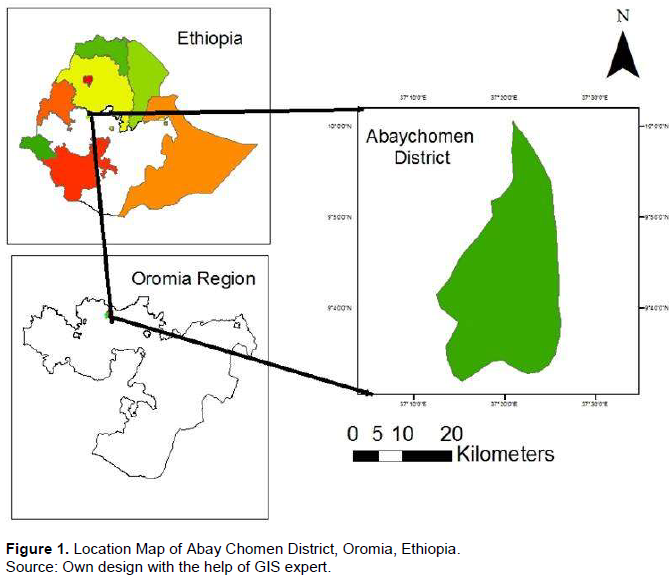
Abay Chomen District is one of the 9 districts in Horro Guduru Wollega zone of Oromia Regional State of Ethiopia, containing 19 kebeles, located at 9° 31’ 42” to 9° 59’ 48” N latitude and 37° 10’ 03” to 37° 28’ 44” E longitude and the capital of the district Fincha town is 289 km northwest of Addis Ababa. The District is bordered on the east by Ababo Guduru district, on the southeast by Guduru district, on the south by Fincha River, on the south west by the Jimma Geneti district, on the northwest by Amuru Jarte district and on the north by the Abay River which separates it from the Amhara region. The area receives high rainfall in one season of the year. The total area of the District is estimated to be 801.7 km2; approximately 45, 37, 4, 3 and 11% of the total area are cultivated land, non-cultivated, water bodies, settlements, and woodlands and forests, respectively (Tegbaru, 2014) (Figure 1).
The Ethiopian population projection was conducted by national CSA (Central Statistical Agency) for 2017, based on 2007 national census. The national Central Statistical Agency reported a total population for Abay Chomen district to be 64,672, of whom 33,263 (51.43%) were male and 31,409 (48.57%) were female; 15,232 or 23.55% of its population were urban dwellers (CSA, 2013).
The altitude of the study area range from 1,061 to 2,492 m above sea level (masl) with two agro ecological zones, mid-highland and low land. The northern part of the district (low land), which is mainly situated at altitude ranging from 1,138 to 1,687 masl in the Nile River Basin, is owned by Fincha Sugar Factory and is entirely being used for irrigated sugarcane (Saccharum officinarum L.) production. At altitudes ranging from 2,213 to 2,492 masl (mid- highland), smallholder farmers practice mixed farming systems that integrate both crops and livestock (animals used for traction, meat and milk). These areas are under intensive cultivation and maize (Zea mays L.), teff (Eragrostis tef (Zucc.) Trotter), bread wheat (Triticum aestivum L.), niger seed (Guizotia abyssinica), barley (Hordeum vulgare L.) and faba bean (Vicia faba L.) are the major crops grown by rain-fed agriculture (CSA, 2013). Crops most commonly produced by irrigated farming are maize, potato, green pepper and tomato (DOoARD, 2016). Areas situated at altitude ranging from 1,061 to 1,138 and 1,687 to 2,213 masl are mainly woodlands and forests, and non-cultivated escarpments (Tegbaru, 2014).
The recent years meteorological data of the nearby representative stations, Fincha Sugar Factory and Shambu Meteorological Stations showed that the mean annual minimum and maximum temperatures of the district are 13.4 and 27.2°C, respectively, and the mean annual rainfall is 1,399 mm (Tegbaru, 2014). The area has a uni-modal rainfall pattern for about 5 months from mid May to October and the highest intensity of rainfall is recorded in the month of July. The area is characterized as hot to warm moist lowland and tepid to cool moist mid-highlands based on the classification of agro-ecological zones of Ethiopia (Alemayehu, 2006).
Sampling method and sample size
The household was the basic sampling unit. In this study, a two-stage sampling technique was used to generate the required primary data. In the first stage, three kebeles from 16 non-urban, mid-high land farmer kebeles in the district were selected randomly.
In the second stage, by stratifying the households into participant and non-participant, a probability proportional to sample size sampling procedure was employed to select 167 sample households. From the total sample, 80 participants and 87 non-participants were randomly selected, after preparing sample frame of participants and non-participants in the selected kebeles. But five observations (three participants and two non-participants) were excluded from the analysis due to missing values and 162 sample (77 participants and 85 non-participants) were used in the analysis. This sample size is assumed to represent the population, since the district is more or less homogeneous in terms of climate, resource endowment and other factors related to the issue of the study.
To determine the representative sample from the study area, the formula for sample size determination adjusting degree of precision to 0.07 due to shortage of resource, following Cochran (1977) has been used. Also, the sample size from each kebele was determined by proportionality formula.
Therefore, sample size is determined by Formula 1:
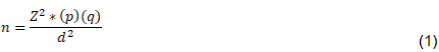
where n = sample size; Z = standard normal deviation (1.81 for 93% confidence level); P = 0.5 (The proportion of the population participating in irrigation, that is 50%) due to unknown variability; q = 1-P =0.5 (50%). The two equal proportions (p and q) is based on sampling rule after Cochran (1977) for unknown variability of the population; d = desired degree of precision, (0.07) in this case.
Types of data, data sources and methods of data collection
For this study, quantitative and qualitative data from primary sources and secondary information were used. The source for primary data was the sample farmers in Abay Chomen district and the source for secondary data are local offices, higher governmental organizations, different publications and policy documents. To obtain primary data, semi structured questionnaire, with both closed and open-ended questions was used as a tool to collect data from sample households. For the sake of conducting this study, important variables on economic, social and institutional factors related with the households in the study area were collected. The variables involve both qualitative and quantitative nature. Qualitative data was collected on variables such as sex, accessibility of different service, whereas distance to the market, number of oxen, education level are some of the quantitative variables considered for constructing the propensity score.
For collection of primary data, enumerators, with at least secondary education that can speak local languages were recruited. Necessary care was taken in recruiting the enumerators. They were given an intensive training on data collection procedures, interviewing techniques and the detailed contents of the questionnaire. The households’ questionnaire was translated into local language (Afaan Oromoo), to convey the questions effectively to the rural interviewees and it was pre-tested, filled by the trained and experienced enumerators. Strict supervision was made by the researcher during the course of the survey. Secondary information was collected from documents and publications of different organizations and relevant local offices as well as journal documents. Moreover, available documents such as policies, strategies, guidelines and reports relevant to irrigation has been reviewed.
Methods of data analysis
There are several methods by which impacts can be evaluated under non-experimental or quasi-experimental approaches. These include randomized selection methods, propensity score matching, regression discontinuity design, difference-in-difference and instrumental variable estimation methods (Khandker et al., 2010).
The difference in difference design for empirical analysis of causal effects has a long history in and outside econometrics and it is one of the most heavily used empirical research designs to estimate the effects of policy changes or interventions in empirical microeconomics nowadays (Lechner, 2010). Difference in difference could be an attractive choice when using research designs based on controlling for confounding variables or using instrumental variables is deemed unsuitable, and at the same time, pre-treatment information is available (Albouy, n.d.). It has the advantage that the basic idea is very intuitive and thus easy to understand for an audience with limited econometric education. Compared for example to matching methods, it has the further advantage that there is no need to control all confounding variables, since we have double difference. In many applications, time is an important variable to distinguish the treated and control groups in difference in difference (Roberts and Lemmon 2007). Difference in difference has the assumptions such as the model in equation (Outcome) is correctly specified, the error term is on average zero and error term is uncorrelated with the other variables in the equation (Albouy, n.d.). This method is best applied under the mentioned assumptions and merits.
Regression discontinuity (RD) is one of the rigorous non-experimental impact evaluation approach that can be used to estimate program impacts in situations in which candidates are selected for treatment based on whether their value for a numeric rating exceeds a designated threshold or cut-point (Jacob and Zhu, 2012). It is based on the cut-off point in observable characteristic, often called the rating variable. RD techniques are considered to have the highest internal validity (the ability to identify causal relationships in this research setting), but their external validity (ability to generalize findings to similar contexts) may be less impressive, as the estimated treatment effect is local to the discontinuity (Baum, 2013). The treatment is not randomized, but there is some process that deterministically dictates whether a unit is treated or not, cut-off point. In this design, units receive treatment based on whether their value of an observed covariate is above or below a known cut-off (Calonico et al., 2013). But when using instrumental variable for causal inference, one must assume the instrument is exogenously generated as if by a coin-flip (Lee and Lemieux, 2010). This implies that in the instrumental variable method there is a randomized variable that is correlated with the treatment.
Propensity score matching (PSM) has two key underlying assumptions (Baum, 2013). The first one is conditional independence; there exists a set X of observable covariates such that after controlling for these covariates, the potential outcomes are independent of treatment status. The other one is common support, for each value of X, there is a positive probability of being both treated and untreated. It is used when it is possible to create a comparison group from a sample of non-participants closest to the treated group using observable variables. Both groups are matched on the basis of propensity scores, predicted probabilities of participation given some observed variables. Propensity score matching consist of four phases most commonly: estimating the probability of participation, that is, the propensity score, for each unit in the sample, selecting a matching algorithm that is used to match beneficiaries with non-beneficiaries in order to construct a comparison group; checking for balance in the characteristics of the treatment and comparison groups; and estimating the program effect and interpreting the results (Caliendo and Kopeinig. 2005).
For several underlying conditions, the propensity score matching method was used in this particular study. Propensity Score Matching (PSM) is used when it is possible to create a comparison group from a sample of non-participants closest to the treated group using observable variables. Both groups are matched on the basis of propensity scores, predicted probabilities of participation given some observed variables. Propensity score matching consist of four phases most commonly: estimating the probability of participation, that is, the propensity score, for each unit in the sample; selecting a matching algorithm that is used to match beneficiaries with non-beneficiaries in order to construct a comparison group; checking for balance in the characteristics of the treatment and comparison groups; along with estimating the program effect and interpreting the results (Caliendo and Kopeinig, 2005).
In this study, the propensity score matching has been used for analyzing the impact of irrigation practice on household income for several reasons. Firstly, there was no baseline data on participants and non-participants as it is common in many research works conducted on impact evaluation. Second, the participants in small-scale irrigation may be self-selected to participate. Furthermore, the available field data was based on a cross-sectional survey. Finally, it is possible to identify some features, in this case socio-economic, institutional and physical characteristics, to match the participants and non-participants.
The interest of this study was to determine the average treatment effect on the treated (ATT) of irrigation practice. But the estimation of this effect is impossible based on the before and after because of absence of baseline data and it needs substituting the counterfactual mean of treated, by the mean outcome of untreated (Caliendo and Kopeinig, 2005). Even though it is possible based on the ‘with and without’ data, it will be a biased estimator under selectivity biasness. To solve this problem, PSM was used because it provides an appropriate solution (Rosenbaum and Rubin, 1985). It accounts for sample selection bias due to observable differences between treatment and comparison groups. It controls for self-selection by creating a statistical comparison group by matching every individual observation of the treatment group with individual observations from the control group with similar observable characteristics.
There are different matching algorithms that can be used to determine the treatment effect on the treated in PSM. But the most common matching algorithms used in PSM include: nearest neighbor matching, radius matching and kernel matching. These matching methods use different means of matching the treated to the control group to determine the average effect of a given program participation or intervention.
The matching algorithms were tested to be used in the estimation of the impact of participation in small-scale irrigation and the best of the three was selected after undertaking the test for the three most common PSM algorithms. But there is no clear rule for determining which algorithm is more appropriate in each context. However, a key issue that has been considered was that, the selection of the matching algorithm implies a bias/efficiency trade-off. For instance, by using only one nearest neighbor we guarantee that we are using the most similar observation to construct the counterfactual. This minimizes the bias, since the characteristics between both units will be, in general, very similar. However, using this technique ignores a lot of information from the sample, since many untreated units are not used for the estimation. Therefore, the reduction in the bias comes with an increase in the imprecision of the estimates caused by a higher variance, that is, a decrease in efficiency. On the other hand, when using many neighbors, the estimator is more efficient since it exploits a larger quantity of information from the untreated pool, but at the expense of increasing the bias by using poorer matches.
The choice of the matching algorithms was based on the most important tests to reduce the bias and inefficiency simultaneously. These tests include mean bias, number of matched sample, value of pseudo R square, and number of the balanced covariates. When considering the mean bias, the one with lowest mean bias is better matching algorithm. Based on number of samples matched, the one with the highest matched number of observation is the best and selected. When coming to the value of the pseudo R square after matching, the matching algorithm with the lowest pseudo R square is the best matching algorithm. On the other hand, the matching algorithm with the highest number of balanced covariates is more appropriate. Hence, based on the overall test of these criteria, the kernel caliper matching algorithm was selected and used in the determination of the effect of participation in irrigation on household income.
EMPIRICAL RESULTS AND DISCUSSION
Impact of small-scale irrigation on household income
This part of the work is concerned with the impact evaluation of participation in small-scale irrigation by farmers on household income. The impact evaluation in this particular case of study was conducted by the use of propensity score matching (PSM) method of impact evaluation mainly because of the absence of baseline data. PSM consists of four phases: estimating the probability of participation, that is, the propensity score, for each unit in the sample; selecting a matching algorithm that is used to match beneficiaries with non-beneficiaries in order to construct a comparison group; checking for balance in the characteristics of the treatment and comparison groups; along with estimating the program effect and interpreting the results (Stuart, 2010). Therefore, the above main issues are now presented.
Estimation of propensity score
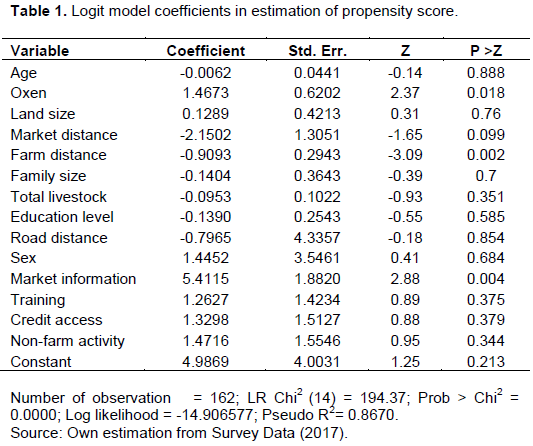
Any model relating a binary variable to a set of predictors can be used. In this study, the propensity scores are constructed using the logit regression, because it is the most common model for propensity score estimation as stated in Stuart (2010). The overlap condition was determined for the total observations, and in order for the propensity scores to correctly estimate the probability of participation, the characteristics included in the propensity score estimation has been well-considered and were exhaustive. However, it is very important that characteristics which may have been affected by the treatment are not included in the estimation of propensity score. Table 1 shows the value of the covariates related with the estimation of propensity scores for the individual observations, that is, the probability of assigning the observation to participate in small-scale irrigation.
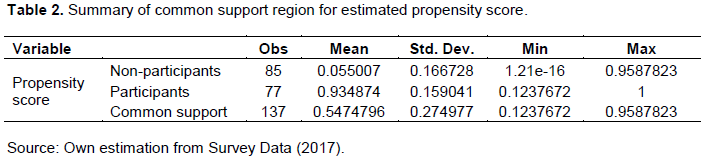
The common support region (overlap condition) for the estimated propensity score is constructed based on the summary statistics of the participants and non-participants. Therefore, the common support region was determined by taking the maximum of the minimums and minimum of the maximums for the two groups’ propensity scores. Based on this technique, the common support region was found to be between the value of propensity score of 0.1237672 and 0.9587823 (Table 2). As a result of the overlap condition, 25 observations (8 non-participants and 17 participants) were found to be out of the common support and hence they were excluded from the observations used to analyze the impact of participation in small-scale irrigation on household income (treatment effect on the treated).
Selecting a matching algorithm
Once the propensity scores are estimated, units in the treatment group (beneficiaries) are then matched with non-beneficiaries with similar propensity scores, or probability of participating in the program. There are a number of matching algorithms which can be employed in undertaking the impact evaluation to get the effect of the treatment. The most common matching algorithms used in PSM include: nearest neighbor matching, radius matching and kernel matching. These matching methods use different means of matching the beneficiaries to the control group to determine the average effect of certain program participation or intervention.
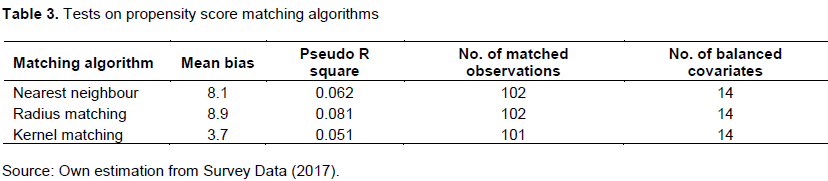
The test for three common matching algorithms in PSM with different criteria was used to test among the matching algorithms and within the matching algorithm under different scenarios (different caliper distance and number of nearest neighbor). The simultaneous test of the matching algorithms, the mean bias, the number of matched observations, the number of balanced covariates and the value of the pseudo R square for best nearest neighbor matching are 8.1, 102, 14 and 0.062; for radius matching are 8.9, 102, 14 and 0.081, for kernel matching are 3.7, 101, 14 and 0.051, respectively (Table 3). Based on these values of the test, the matching algorithm with the lowest mean bias, lowest pseudo R square, approximately equal number of matched observations and equal number of balanced covariates compared to other matching algorithms, kernel matching is found to be the best, in addition to the fact that this matching algorithm consists of more information in estimating the effect which reduces the variance. Therefore, kernel caliper matching was selected because it represents the best matching algorithm. Hence, kernel matching algorithm was selected as the best matching algorithm under PSM and it was used to estimate the impact of participation in small scale irrigation on household income.
Checking for balance
Once units are matched, the characteristics of the constructed treatment and comparison groups should not be significantly different; this implies that the matched units in the treatment and comparison groups should be statistically comparable. Balance is tested using a t-test to compare the means of all covariates included in the propensity score in order to determine if the means are statistically similar in the treatment and comparison groups. This test (t-test) is preferred when the evaluator is concerned with the statistical significance of the results (Solivas et al., 2007). If balance is not achieved, that is, the means of the covariates are statistically different, a different matching option or specification should be used until the sample is sufficiently balanced. In this case, the balance for the covariates is tested for balance in the mean of covariates across the participants and non-participants and it revealed that the balanced test of the covariates is satisfied by t-test. In addition to the above statistical test, and for the balance of covariates to be trustworthy, the absolute standardized differences of means of covariates should be less than 25% and the overall absolute mean bias should be between 5 and 2% (Rubin, 2001). These criteria has also been satisfied because the individual covariates mean difference between participants and non-participants is less than 25% and the overall absolute mean bias is 3.7% which is between 5 and 2%. The result of the test is given in Table 4.
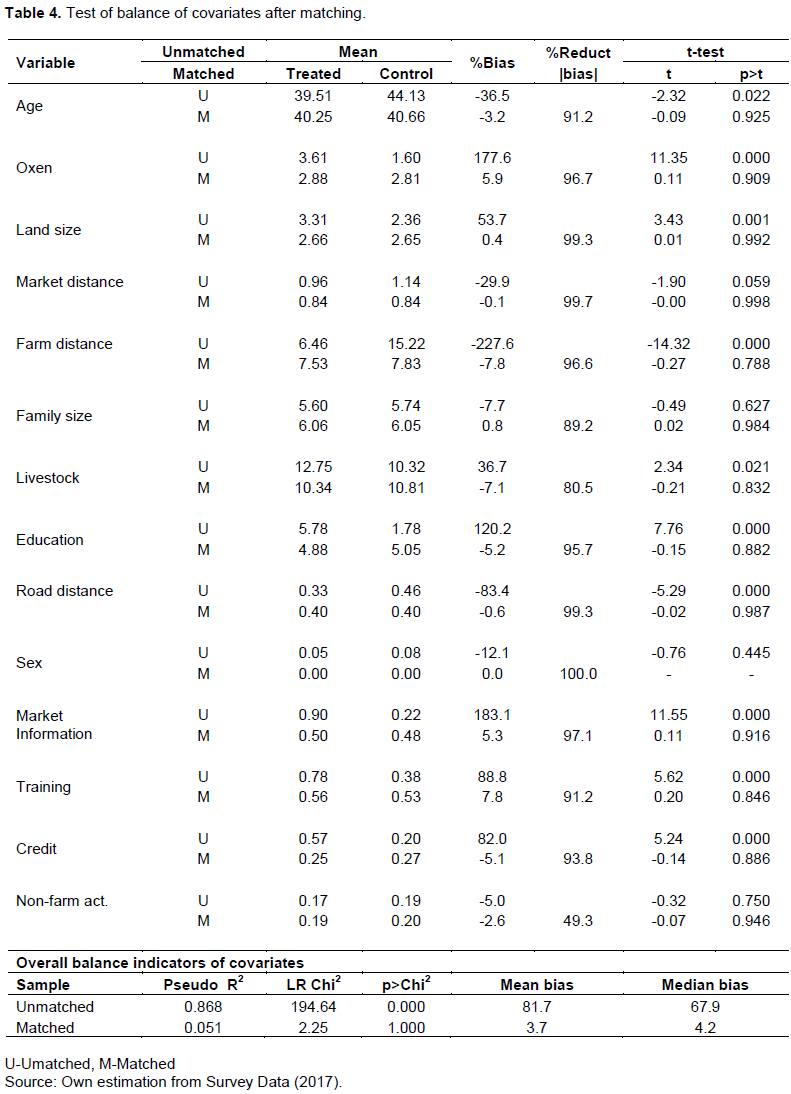
From the result of testing for balance of the covariates between the treated and comparison group, it shows that there was no significant difference between the two groups on the covariates after matching because the t-test shows absence of significant difference. Therefore, the covariate balance criteria are satisfied.
Estimation of the effect of treatment and interpretation of results
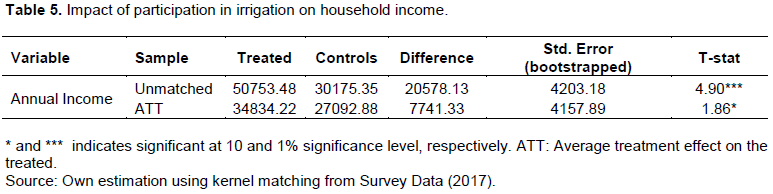
Estimation of the impact of a certain technology intervention is based on the above mentioned steps of propensity score matching when we do not have the baseline data. Following the estimation of propensity scores, the implementation of a matching algorithm, and the achievement of balance, the intervention’s impact may be estimated by averaging the differences in outcome between each treated unit and its neighbor or neighbors from the constructed comparison group. The difference in averages of the subjects who participated in the intervention and those who did not can then be interpreted as the impact of the program. The impact evaluation of the average treatment effect on the treated of participation in small-scale irrigation for this study was conducted using kernel matching. Bootstrap method was used to estimate standard errors for matching estimator to account for the fact that the propensity score is also estimated. Table 5 shows the impact of participation in small-scale irrigated farming on household income.
After estimating the treatment effect, sensitivity analysis, Rosenbaum bound estimation was conducted between the gamma values of 1 and 3, by adding 0.25 on 1 and continuing up to 3, to test whether the treatment effect on the treated is sensitive to the hidden bias (unobservables). The sensitivity analysis is conducted at gamma 1, 1.25, 1.5…3. The analysis result indicated that the average treatment effect on the treated is not sensitive to an increase in hidden bias (unobservables) up to 200%.
From Table 5, the average treatment effect on the treated is about ETB 7741 and it is significant at 10% significance level. This finding is consistent with certain studies conducted on impact of participation in irrigated farming on household income using propensity score matching (Nicoletti, 2011; Dillon, 2011; Hadush, 2014; Shiferaw and Mengistu, 2015). Therefore, irrigation practice in the study area should be encouraged and the problems hindering small-scale irrigation practice should be attempted to be solved by government and any other stakeholders. The estimation was conducted by the three matching algorithms radius matching, kernel matching and nearest neighbour to show that the estimation is robust. Kernel matching and nearest neighbour matching showed almost similar results but the result from radius matching was insignificant.
CONCLUSION AND RECOMMENDATION
This study examined the impact of small-scale irrigation practice on household income by the farm households in Abay Chomen district. The study used descriptive statistics and propensity score matching for data analysis obtained from sample households’ interview concerning small-scale irrigation in the study area. The sample of 162 of the farm households selected by multi-stage sampling technique were used in the analysis excluding five samples with missing values.
The estimation of propensity score was conducted by using the commonly used logit model. The choice of matching algorithm was based on different criteria, mean bias, pseudo R square, number of matched observations and number of balanced covariates. Based on these criteria, kernel matching was selected and used for the analysis because it has been found relatively the best fitting alternative. After testing, the balance of covariates after matching the estimation of the treatment effect on the treated was conducted using kernel matching. The estimation result revealed that the impact of small-scale irrigation practice on household income was significant. The result indicated that the mean income of participant households in small-scale irrigation practice was significantly higher than those households not participating in small-scale irrigation in Abay Chomen district.
The study revealed that there is positive significant impact on the income of participant household income as a result of participation in small-scale irrigation. Therefore, the government and any concerned stakeholder should work on how to expand the utilization of small-scale irrigation in Abay Chomen district, so that it would directly improve the income of farming households and indirectly contribute to the economic development of the country as a whole.
CONFLICT OF INTERESTS
The authors have not declared any conflict of interests.
REFERENCES
|
Abebe E, Bihon K, Gebremedhin Y (2011). Determinants of land allocation to irrigation and its wealth effect: Evidence from northern Ethiopia. Journal of the Drylands 4(2):310-319. |
|
|
Albouy D (n.d.). Program Evaluation and the Difference in Difference Estimator. Economics 131 section note: 1- 4 |
|
|
Alemayehu M (2006). Country Pasture/Forage Resource Profiles. Food and Agricultural Organization of the United Nations (FAO), Rome, Italy. fao.org |
|
|
Awulachew SB (2010). Irrigation Potential in Ethiopia. Constraints and opportunities for enhancing the system. International Water Management Institute (IWMI). |
|
|
Baum CF (2013). Propensity Score Matching, Regression Discontinuity, Limited Dependent Variables. Applied Econometrics, Boston College, Massachusett, USA. |
|
|
Caliendo M, Kopeinig S (2005). Some Practical Guidance for the Implementation of Propensity Score Matching. Discussion Paper No. 1588. |
|
|
Calonico S, Cattaneo M, Titiunik R (2013). Robust Data-Driven Inference in the Regression-Discontinuity Design. The Stata Journal 5(2):1-32 |
|
|
Cochran WG (1977). Sampling Techniques, 3rd Ed., New York: John Wiley and Sons, Inc. ISBN 0-471-16240-X |
|
|
Central Statistical Agency (CSA) (2013). Population Projection of Ethiopia for All Regions at Woreda Level from 2014 – 2017. Addis Ababa, Ethiopia. Unpublished source. |
|
|
Dereje M, Desalegn K (2016). Assessment of the impact of small-scale irrigation on household livelihood improvement at Gubalafto District, North Wollo, Ethiopia. Agriculture 6(3):01-22. |
|
|
Dillon A (2011). The effect of irrigation on poverty reduction, asset accumulation, and informal insurance: Evidence from Northern Mali. World Development 39(12):2165-2175. |
|
|
Abay Chomen District Office of Agriculture and Rural Development (DOoARD) (2016). Annual Report on Rain-fed and Irrigation Agriculture. Unpublished source. |
|
|
Dubois O (2011). The state of the world's land and water resources for food and agriculture: managing systems at risk. Earthscan. ISBN: 9781849713276 |
|
|
Ethiopian Agricultural Transformation Agency (ATA) (2016). Annual Report, Addis Ababa, Ethiopia. |
|
|
Food and Agricultural Organization (FAO) (2012). Comprehensive Africa Agriculture Development Programme, Corporate Document Repository. |
|
|
Food and Agricultural Organization (FAO) (2015). Ethiopia Country Highlights on Irrigation Market Brief. UNFAO, Rome, Itally. Prepared under Food and Agricultural Organization of United Nations (UNFAO)/International Finance Corporation (IFC) cooperation. |
|
|
Garcia-Bolanos M, Borgia C, Poblador N, Dia M, Seyid OMV, Mateos L (2011). Performance assessment of small irrigation schemes along the Mauritanian banks of the Senegal River. Agricultural Water Management 98(7):1141-1152. |
|
|
Hadush H (2014). Adoption and Impact of micro Irrigation on Household Income: The case of Eastern Tigray (Doctoral dissertation, Mekelle University). |
|
|
Jacob R, Zhu P (2012). A Practical Guide to Regression Discontinuity. www.mdrc.org, accessed on November 14, 2017. |
|
|
Kay M (2001). Smallholder irrigation technology: Prospects for Sub-Saharan Africa (No. 3). Food and Agriculture Organization. books.google.com |
|
|
Khandker SR, Koolwal GB, Samad HA (2010). Handbook on Impact Evaluation: Quantitative Methods and Practices. World Bank Publications. |
|
|
Lechner M (2010). The Estimation of Causal Effects by Difference-in-Difference Methods. Foundations and Trends in Econometrics 4(3):165-224. |
|
|
Lee DS, Lemieux T (2010). Regression Discontinuity Designs in Economics. Journal of Economic Literature 48(1):281-355. |
|
|
Ministry of Agriculture (MoA) (2011). Small-Scale Irrigation Situation Analysis and Capacity Needs Assessment, Addis Ababa, Ethiopia. Unpublished source |
|
|
Mwangi M, Kariuki S (2015). Factors Determining Adoption of New Agricultural Technology by Smallholder farmers in Developing Countries. Journal of Economic and Sustainable Development 6(5): 208-216. |
|
|
Nicoletti CK (2011). Rural prosperity initiative: Propensity-score analysis of income and crop production effects from a comprehensive micro-irrigation program in Zambia (Doctoral dissertation, Colorado State University). |
|
|
National Planning Commission (NPC) (2015). Ethiopian second five year (2015/16-2019/20) Growth and Transformation plan, Addis Ababa, Ethiopia. |
|
|
Roberts MR, Lemmon M (2007). The Response of Corporate Financing and Investment to Changes in the Supply of Credit, Working Paper, University of Pennsylvania. |
|
|
Rosenbaum PR, Rubin DB (1985). Constructing a control group using multivariate matched sampling methods that incorporate the propensity score. The American Statistician 39(1):33-38. |
|
|
Rubin DB (2001). Using propensity scores to help design observational studies: Application to the tobacco litigation. Health Services & Outcomes Research Methodology 2:169-188. |
|
|
Shiferaw S, Mengistu K (2015). Impact of irrigation technologies on rural households' poverty status: the Case of Fogera District, North-Western Ethiopia. Agris on-line Papers in Economics and Informatics 7(1):59-67. |
|
|
Solivas ES, Ramirez GM, Manalo AN (2007). The propensity score matching for correcting sample selection bias. In 10th National Convention on Statistics (NCS), EDSA Shangri-La Hotel, Mandaluyong City, Philippines pp. 1-2. |
|
|
Stuart EA (2010). Matching methods for causal inference: A review and a look forward. Statistical science: Review Journal of the Institute of Mathematical Statistics 25(1):1-21. |
|
|
Tegbaru B (2014). Fertility Mapping Of Soils Of Abay-Chomen District, Western Oromia, Ethiopia. Unpublished MSc Thesis, Haramaya University. |
|
|
Tongul, H, Hobson M (2013). Scaling Up an Integrated Watershed Management Approach through Social Protection Programmes in Ethiopia: The MERET and PSNP schemes. Hunger, Nutrition, Climate Justice. A New Dialogue: Putting People at the Heart of Global Development, 15-16 April 2013, Dublin, Ireland. |
|
|
United Nations (2017). Department of Economic and Social Affairs, Population Division World Population Prospects: The 2017 Revision, Key Findings and Advance Tables. Working Paper No. ESA/P/WP/248. |
|
|
Tesfa W, Tripathi SK (2015). Watershed management in highlands of Ethiopia: A Review. Open Access Library Journal 2(06):1. file.scirp.org |
|
Copyright © 2024 Author(s) retain the copyright of this article.
This article is published under the terms of the Creative Commons Attribution License 4.0


