Full Length Research Paper
ABSTRACT
Sesame post-harvest loss and its determinants in Kafta Humera, Ethiopia of cross-sectional data were obtained from interviewing 128 producers and measurement at 56 fields. The loss found were at harvesting (16.41%), drying (50.44%), un-threshed (11.55%), piles transportation (9.9%), storage (6.73%), cleaning (3.2%), and leads total loss of 23.7% (4260 Birr/ton). The significant determinants of sesame post-harvest loss found were sesame produced, weather, transportation mode, piles transported distance, stacking days, educational level, farm distance, land size, and extension contact. This study so recommends strengthening education, extension, credit, nearby follow up, and frequently visit for reducing sesame post-harvest loss. Introduction of sesame harvesting and drying technologies and machineries are also better in reducing sesame post-harvest losses.
Key words: Kafta Humera, sesame, small-scale, post-harvest loss.
INTRODUCTION
Sesame is one of the important oilseed crops well adapted to semi-arid tropical regions. It best performs on well drained, moderately fertile soils of light to medium texture with temperature ranging from 20 to 35°C (Wijnands et al., 2007). It is one of the six priority crops in the agricultural growth programme of Ethiopian (SBN, 2013). In Ethiopia, sesame is being produced as cash crop by more than 867,347 small-scale producers who cultivate 0.42 million hectares of land and produces 0.29 million tons (CSA, 2015). Nationally, sesame accounts for 3.35% of total area and 1.1% of total grain production (CSA, 2015). In Ethiopia, it is produced in Western Tigray lowlands, North Gondar, Welega, Benishangul Gumuz and South-Omo; where Western Tigray and North Gondar lowlands contributed more than 68% of the national sesame aggregated product. In Ethiopia, the share of production and productivity as 39, 29 and 21% obtaining 0.66, 0.704, and 0.735 ton/ha productivity by Amhara, Tigray and Oromia, respectively which contribute for the national yield of 0.687 ton/ha (CSA, 2015).
Over the past years, sesame production shows greater increase in area and total production but decreasing in yield. Looking on its trend, nationally sesame covered 0.14 million hectares to produce 0.12 million tons in 2004/2005 (Kindie, 2007) which has increased to 0.29 million tons production in 0.42 million hectares of land in 2014/2015 (CSA, 2015). But, its productivity declines from 0.847 ton/ha in 2004/2005 (Kindie, 2007) to 0.735 ton/ha in 2013/2014 (CSA, 2014) and further to 0.687 ton/ha in 2014/2015 (CSA, 2015).
In Tigray region, 176030 small-scale producers (CSA, 2015) and more than 1100 commercial farms (KHLAdO, Documented file on list of farmers in Kafta Humera district with their land size allocated, 2015) were engaged in sesame production that had supplied 88.7% of their total sesame production (CSA, 2014). According to CSA (2014), Tigray region had scored the second rank in terms of area coverage and production which was 28.74 and 29%, respectively. Within the region, Western zone Tigray had got the lion share in the region’s sesame area (76.33%) and production (76%) for the average productivity estimated to be 0.7 ton/ha (CSA, 2015). In Kafta Humera district, sesame own majority and leading economic importance (KHARDO Annual Report, 2015). The district also provided employment for more than 370000 seasonal laborers coming from other zones of Tigray, Amhara, Oromia and SNNP regions (KHARDO Annual Report, 2014).
Post-harvest loss is the loss of grain between the moments of harvest and consumption that occurs at all stages of post-harvest handling; processing, transportation, storage, packaging, and marketing. Generally, it is estimated that by 2050 the current population will reach 10.3 Billion showing an increase of the current food demanders by 33% (UN March, 2013), which requires food supply to increase by 60% (Alexandratos and Bruinsma, 2012). It is also understandable that most of the formerly conducted studies in developing countries were focusing on cereal crops. In Ethiopia, particularly in Western zone Tigray, sesame is an important cash crop; even though, its post-harvest loss at harvesting, drying, threshing and storage were high, estimated at 15 to 26% of the total production (Kahsu et al., 2014). Regardless of the high percentage of grain loss, as far as the researcher’s knowledge is concerned beyond estimation of the amount loss, there was no study conducted on the sources of post-harvest loss and its possible solutions. It is also fact that food availability could be improved by increasing production and/or reducing loss by addressing the possible loss contributing factors. So, estimating post-harvest loss of sesame grain and identifying its source in the study area was important to design mechanisms to minimize the loss. Considering these problems, the objectives designed are to estimate post-harvest loss from small-scale producers and to identify its major sources in Kafta Humera district.
Theoretical framework
From the farmer’s perspective (producer or decision- making units), in microeconomics (production economics) principles, it is indicated that farmers are rational in decision making for their business. This is to mean that small scale farmers are utility maximizers based on their allocation of the limited resources they have. So, this study summarizes as the rational choice theory which is also known as the rational allocation theory is the basic theory employed for the farmer’s decision making along resource allocation in sesame production and post-harvest loss reduction in the study area.
From the consumer’s perspective, in partial market equilibrium theory, it is explained that if the market is competitive market or free market economy, the amount supplied of a single commodity equates with the quantity demanded; so that, the price re-adjusts the quantity. But, if there is disturbance in the quantity that is if the quantity supply is lower than the quantity demanded, then the commodities price will raise up so consumers are forced to pay higher price regardless of their income level. This disturbance in partial market equilibrium may further lead to affect the consumers with lower income level. The reduction in supply amount could rise due to many cases out of which due to lower productivity and high post-harvest losses take the larger share. So, partial equilibrium theory is the basic theory in this study associated with the sesame marketing effect of its post-harvest loss.
METHODOLOGY
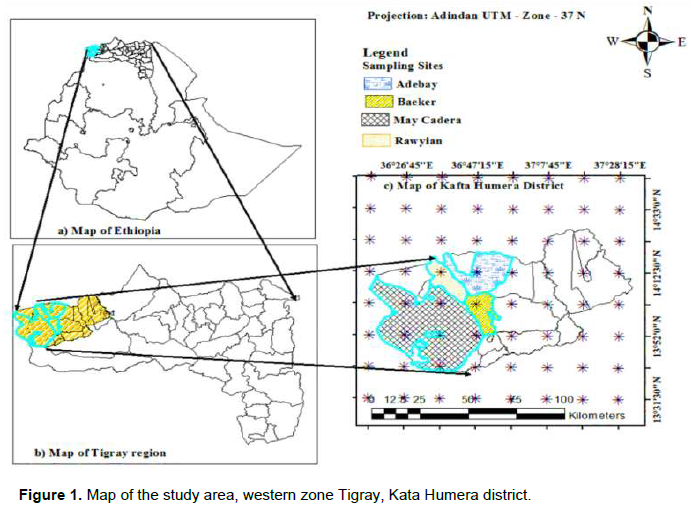
The study was conducted in Tigray regional state, Western zone, Kafta-Humera district. The district has a population of 53945 male, 49792 female and total of 103692 with 26352 households covering an area of 4542.33 km2 with 396852 ha cultivable land (KHARDO Annual Report, 2014). The study area has chromic vertisol soil type which is black in color characterized with very deep clay textured where water logging is very high during heavy rainfall. The annual temperature of the area ranges from 22.2 to 42°C with annual rainfall ranging from 400 to 650 mm in the months from June to September (Hagos and Fetien, 2011).
The study area is known for cultivations of various cereals in which it was most dominantly covered by sesame and sorghum. These crops are the district’s important marketable crops as the reports of KHARDO Annual Report (2014) and HuARC Productivity Improvement Report (2014).
As it is presented in Figure 1, from the sesame producing kebeles in Kafta Humera district, four kebeles (Adebay, Baeker, Mai-kadra and Rawyian) were selected randomly by picking a rolled paper. These kebeles could represent the district’s sesame potential kebeles as owing society having similar culture, economic status, climatic condition and agro-ecology, practicing similar farming system, facing similar topography and geographic arrangement, cultivating on similar soil type, etc. These kebeles also share similar administrative bodies and similar expertise support from the district. The average distance from one kebele to the other next kebeles is about 19 km. The kebeles’ average distance from Humera town ranges between 7 and 50 km.
Data types, sources and methods of data collection
Both primary and secondary data sources were conducted to collect data for analysis and this was done using field survey and from different published and unpublished sources.
The primary data sources
It is collected using formal survey procedures from small-scale sesame producers through semi-structured questionnaires and by measurement of the loss amount at each stage of harvest and post-harvest handling in four randomly selected sesame producing kebeles (Mai-Kadra, Baeker, Adebay and Rawiyan) (Figure 1). The respondents for post-harvest loss data were selected by considering to be interviewed during field survey. The post-harvest loss data was collected through the following methods.
During harvesting first, a 10 m × 10 m quadrant was measured in the farm from which the capsules opened, dropped during harvest time and remain un-harvested were counted and the seeds in those capsules were also counted by seed counter. Then, in nearby to the quadrant measured one piles sesame was harvested and stacked/stand on sheet. This stand stayed for an average of 14 days for drying. Then during threshing, threshers were informed to thresh it on other sheet. Here, the distance from piles standing to threshing place was covered by long plastic/Abujedid and so threshing workers were informed to go on that way only. Finally, the threshed sesame straw bar was secondly threshed and loss during cleaning time was recorded.
The loss during transportation from farm to store was measured by collecting the dropped amount during transport. During storage time also the loss was obtained by measuring while entered and withdraws store. The loss while transporting from store was obtained by measuring when it is ready for transportation and as it reaches the market, the difference was taken.
Secondary data sources
The secondary data was collected from the selected kebeles agricultural development office, district’s office of agriculture and rural development, district’s office of land administration, HuARC, western zone zonal office, different books, different published and unpublished reports, bulletins, and websites.
Sampling procedure and sample size
The study used multi-stage sampling technique to select sample sesame producers. First, from Western zone Tigray, Kafta Humera district was selected purposively because of the availability of small-scale sesame producers in the same location. Then, four kebeles (Mai Kadra, Baeker, Adebay and Rawiyan) were selected randomly (Figure 1 and Table 1). Following, depending on the probability proportional to size of sesame producing small-scale farmers from each sample kebeles, the specified numbers of respondents were obtained based on random sampling technique. The intended total sample size was determined based on the following formula developed by Yamane (1967). Considering confidence level of 90% and accepting the error (e) of 9%:

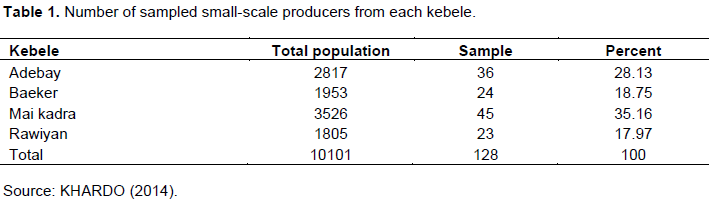
where n = sample size, N = total population which is equal to 26352for small scale producers. Based on the calculation, 128 small-scale sesame producers were sampled (Table 1).
For analysis of sesame post-harvest loss, data was also taken by direct physical measurement from the four kebeles selected in the aforementioned procedure. For this purpose, a total of 56 small-scale sesame producers were selected randomly from those formerly selected for the survey interview purpose.
Methods of data analysis
Across the globe measurements and estimation of post-harvest losses are varying from commodity to commodity. But, most of them agreed that direct measurement is better for consistency even though it requires huge resource for its management. So in this study, both descriptive statistics and econometric models are employed for analyzing the data obtained from survey and field measure (direct loss measurement at different stages). Descriptive methods include percentages and mean which is employed to describe the amount/quantity of sesame grain lost using mean and frequency/ratio. However, the econometric method is used by applying multiple linear regression to analyze the linear relationship between explanatory variables and sesame grain post-harvest loss. That is to estimate the sources of sesame grain post-harvest loss in the study area using cross sectional data obtained from small producers from harvesting to selling. The model is given as:

where i = ith respondent i= 1, 2 …15; Ô = random-error, Yi = the post-harvest loss quantity of sesame in kg/Qt., which is continuous variable; α=coefficients; X=the explanatory variable. X1=age of the household head in years, X2=education level of the household head in years of schooling, X3=total amount of sesame production in quintal, X4=area under sesame production in hectare, X5= weather which is dummy variable ‘0’ if the weather during harvesting is favorable otherwise‘1’, X6=mode of sesame grain transportation that is a dummy variable values as 1=by donkey/caro, 2=by tractor or tracker, X7=distance of sesame farm from residence in kilometers, X8=duration at store in number of weeks sesame has stored, X9=road infrastructure availability that is dummy variable that takes ‘1’ for human and animal road; ‘2’ for pista/standard road, X10=harvesting and threshing management that is dummy variable valued as ‘0’ for good and carefully done, ‘1’ for carelessness, X11=distance of piles transported to threshing place in meters, X12=number of extension contact in frequency/times of contact, X13= Total amount of credit obtained in birr, and X14=total amount of off-sesame farm income obtained in Birr.
RESULTS AND DISCUSSION
It is in this chapter that, the results of the study are presented and discussed. The results obtained are presented in two separate sections; the descriptive statistics results and the econometric model results.
Descriptive statistical results
Descriptive statistics results of sampled households’ demographic and socio-economic characteristics, institutional services and inputs used in the econometric models are discussed here.
Demographic features and availability of production resources
The average family size of small-scale sesame producers in the study area was five persons per family with ratio of one to one between male and female members (Table 2). In this table, it was observed that the total active and non-active family members were three and two persons, respectively.
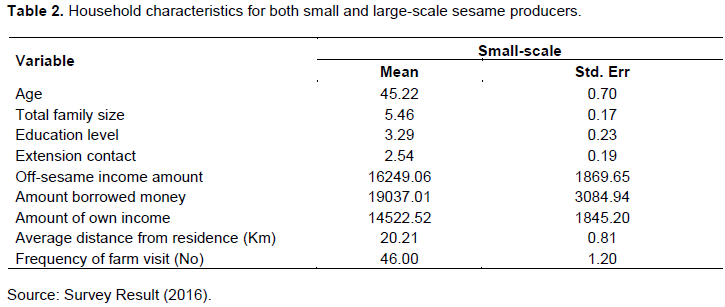
The sampled small-scale sesame producers have an average age of 45 years (Table 2) with the average educational level of about three years of schooling (Table 2). As presented in Table 2, the average distance of sesame farm land from residence of small-scale sesame producers was about 20.21 km; so that, they visited their sesame farm on average of 46 times per the production season. Regarding the income obtained from different sources of off-sesame farm income sources of the sampled small-scale sesame producers was about 14522.22 Birr (Table 2).
Land size and ownership
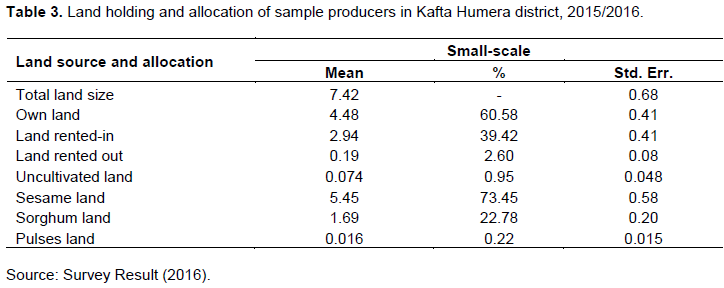
As the Ethiopian land law, land cannot be sold rather can be sharecropped and/or rented in/out. As a result, the sample sesame producers had practiced renting in/out. The share cropping and/or renting out/in was for the reasons that either farm was far distant from their living home and/or un/availability of finance to perform activities. As presented in Table 3, the average land holding of sampled small-scale sesame producers was 7.42 ha. As presented in Table 3, from the total land cultivated by the sampled small-scale sesame producers 60.58% was obtained from their own, while the remaining 39.42% plough rented-in land. In the study area, 73.45% of the total cultivated land by small-scale sesame producers was allocated for sesame production, while 22.78% was allocated for sorghum production (Table 3).
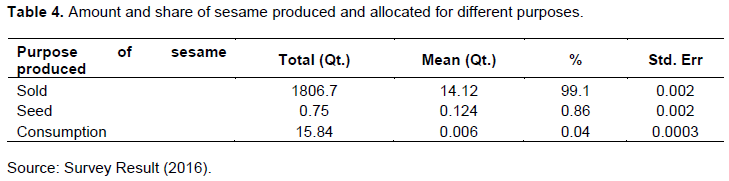
As presented in Table 4, of the total sesame produced by the sampled small-scale producers, 99.1% was for selling, 0.04% for home consumption and 0.86% for seed purposes.
Post-harvest loss of sesame grain
As presented in Table 4, the amount of sesame grain loss in piles stacking (drying) accounts for the highest percentage of the total loss in small-scale producers (50.44%). Taking the average price during the study year, this leads to financial loss (total return loss) for average selling price was Birr 426 (that is, 1795.15×0.237 Qt) per one quintal production. Similarly, the country losses an additional Birr 29 from losses not exported (that is, 1909×0.237 Qt-(424 Birr)). The loss during harvesting time (pod dropped, un-harvested remains and grain drops as the pod opens during harvesting) which accounts for 16.41%, holds the second rank for small-scale producers (Table 5). However, the lowest loss (0.07%) of sesame produced by small-scale sesame producers was during selling (Table 5).
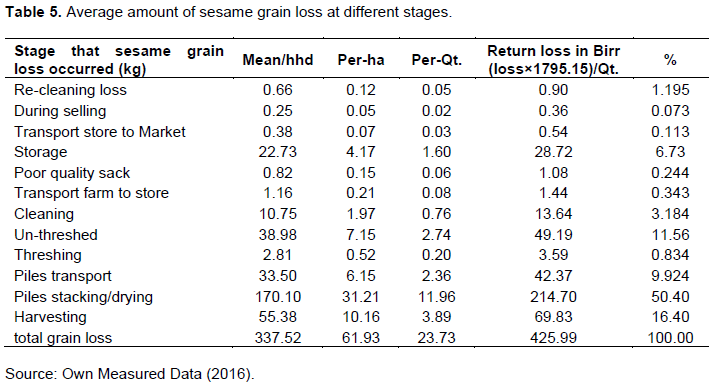
The average amount of sesame grain loss per individual small-scale producer in the study area was about 3.37 Qt (0.62 Qt/ha) (Table 5). This total loss amount lead to the ratio of loss to total production obtained (that is, the percentage of loss) of 23.68%. The result found is consistent with the results obtained by Aramyan and Gogh (2011), FAO (2011) and Tefera et al. (2011) who found the range of loss of 20 to 40%. It is also similar with the result obtained by Hodges et al. (2011) that the cumulative post-harvest loss of wheat, sorghum and maize, for Ethiopia was 15 to 25%. The result obtained also matches with the result of post-harvest loss found by Hodges (2012) for Tanzania was about 22% and for Benin was about 27%.
Following the calculation 1795.15 × the amount loss per quintal at each stage, the amount of Birr loss per quintal at each stages of the chain for the producers could be calculated. Similarly, the overall national impact of the losses at each stage could be calculated by multiplying the export price to the amount loss per quintal at each stage. Basappa et al. (2007) also found the loss at harvesting, threshing, cleaning, drying, storage, transportation, packaging taking the share of about 30, 12, 3, 22, 13, and 5%, respectively.
But, what differs from most of the studies was that sesame in Ethiopia, particularly in Kafta Humera district was not stored longer as it is an exportable commodity. So storage loss was lower in this study. Rather due to its highly shattering nature and it is staying longer for drying, the highest loss was recorded during piles stacking/drying. The Food and Agriculture Organization (FAO, 2014) had estimated 32% of global food production loss after harvest and up to 37% in sub-Saharan Africa, which is higher than the amount obtained in this study. The detailed discussion of the amount of sesame grain loss is as follows:
Sesame post-harvest loss during harvesting: This is the stage at which useful part of the standing sesame was cut, collected and piles stacked. Harvesting is performed as the crop matures; when pods become brownish color and its life become yellow and dropped. Loss at this stage was due to over maturity of the crop (pods opened) and pest attack, when there is poor handling of the laborers some of the harvested part fails and part of the standing sesame remains not yet cut/un-harvested. Due to these faults sesame grain loss happened which account for 55.38 kg per individual small-scale producers (3.89 kg/Qt) (Table 5). The loss during harvesting stage takes second rank in small-scale sesame producers (16.4%) (Table 5). Regarding its maturity level, producers during the field measurement section explained that it is better if sesame is harvested while the first lower three capsules/pods are opened, so that one could say that sesame field is really matured. For this reason producer stay until balanced maturity is in reached even though the lower part is lost. The solution for this problem might be adoption to improve non shattering seed varieties.
Sesame post-harvest loss during piles stacking/drying: This is the stage at which harvested sesame stays for drying so that pods will tear, become easily to thresh. In this stage, the pests (termite, ants and webworm) and weather hazards such as wind and rainfall result in sesame grain loss in the study area. The poor stacking performance was also the other additional factor for sesame grain loss during drying. The harvested sesame stayed for an average of 16 days for drying. During drying period on average, a total loss of 170 kg (that is, 11.96 kg/Qt) occurred from the individual small-scale farms which account for 50.4% for the small-scale producer’s total production (Table 5). This indicates that it is the stage at which greater amount of sesame post-harvest loss occurred.
Sesame post-harvest loss during piles transportation: This refers to the transportation of stacked piles from the place where it was standing to the place where it would be threshed. According to this study result, the average distance for the harvested sesame moved for threshing was 15.2 m. The average amount of sesame grain loss per individual producer in this stage was 33.5 kg (that is, 2.36 kg/Qt), which accounts for 9.92% from the total loss (Table 5).
Sesame post-harvest loss during threshing: Threshing is the stage in which sesame grain extracted/separated from sesame pods/capsules. Grain loss occurred at this stage because of poor performance of threshing workers. According to the study results shown in Table 5, the average amount of sesame grain loss at this stage per household was 2.81 kg (0.2 kg/Qt) and 74.8 kg (0.25 kg/Qt) from small and large-scale producer’s field that hold the percentage share of 0.834 and 1.01% for small and large-scale, respectively (Table 5).
Sesame post-harvest loss due to un-threshed remaining pod: This is not a stage by itself rather it is sub-process beside to the threshing process. In this sub-process loss could happen by threshing while the pods are not fully dried; so that, grain could not withdraw from pods during threshing. On the other case, poor performance of threshing workers made grain to remain inside sesame straw bar. Because of these reasons, the average amounts of sesame grain loss per individual small-scale producer was 38.98 kg (that is, 2.74 kg/ha); which accounts for 11.56% from the total loss of small-scale producers (Table 5).
Sesame post-harvest loss during cleaning: Cleaning stage includes winnowing and packaging processes. In this stage, loss resulted due to poor performance, high wind force and limited coverage of the materials used. Due to these causes, the average amount of sesame grain loss from individual small-scale sesame producer was 10.75 kg (that is, 0.76 kg/Qt); with the share of 3.184% (Table 5).
Sesame post-harvest loss during storage: Sesame producers in the study area had used either standardized store or in their home with themselves. The standard store could be either rented or their own. The average sesame grain loss during storage for individual small-scale producers was 22.73 kg (1.6 kg/ha) which accounts for 6.73% of the total loss that occurred (Table 5).
Analyses of sesame post-harvest loss determinants
Here, identifies the determinants of sesame post-harvest loss of small-scale producers in Kafta Humera district. These factors were identified by applying a multiple linear regression model. VIF test was used for detecting multicollinearity problem, Breusch-Pagan test used for testing heteroskedasticity problem, Ramsey RESET test used for testing the omitted variable problem and Durbin and Wu-Hausman test used for testing the endogeneity problem.
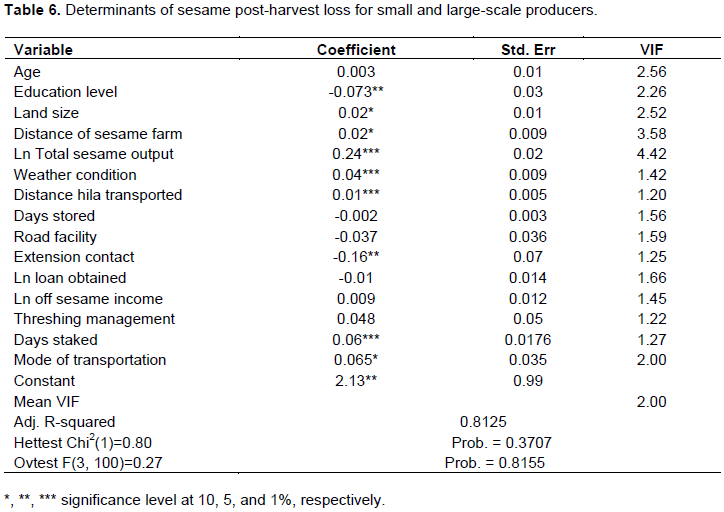
The result of VIF test of each variable in the model is lower than 10 with the overall mean value of two (Table 6). The study also proved that, there is no omitted variable problem as tested by applying the Ramsey RESET test. The Ramsey RESET test using powers of fitted values considering degrees of freedom is F (3, 100) = 0.27 with P >F = 0.85. The endogeneity test also shows that there is one direction endogeneity problem between the explanatory variable of total sesame output and the dependent variable. The solution for this problem is the utilization of instrumental variable (IV) tested by applying the Durbin and Wu-Hausman (score). Being this, the instrumental variable selected is the average sesame productivity. After applying this IV model consistency is proved. Based on the Breusch-Pagan test for heteroskedasticity, the null hypothesis could not be rejected as Chi2 (1) is 0.80 with P-value of 0.37. So, there was no heteroskedasticity problem in the model (Table 6); proving that there is constant variance in the model. Besides, the adjusted R-squared value of 0.81 which implies that 81% of the sesame post-harvest loss amount from small-scale producers was explained by the explanatory variables in the model. Taking the model validity tests and proving as the model is valid, the study determines the post-harvest loss determinant variables.
As presented in Table 6, post-harvest loss determinant variables were not the activities that harvested sesame passes. Rather those determining factors were the demographic, socio economic, farm attributes and institutional factors. In determining sesame post-harvest loss from small-scale producers, this study found variables such as; age of the household head, number of days sesame stored, total amount of loan obtained, total amount of off-sesame farm income obtained, type of road from sesame farm to store and sesame threshing management were statistically insignificant variables (Table 6).
The significant sesame post-harvest loss determining variables as presented in Table 6 will be discussed as follows. But, while interpreting the results it is important to take the assumptions of holding other variables constant at certain level, with the existing type of technology and at specified time period. So this assumption is considered in the following.
Education level of the household head (eduhhd)
It significantly and negatively determines post-harvest loss of small-scale sesame producers at 5% significance level. The result shows that, if the household head attained one more year of schooling, he/she could reduce his/her sesame grain post-harvest loss by 7.3%. The reason for this relation may be that education enables producers to properly manage and control production activities. Thus, reduces the post-harvest loss. The result found in this study is in line with the study results obtained by Basavaraja et al. (2007).
Land size (landsz)
The result found shows that this variable is statistically significant at 10% significance level and positively related in affecting sesame post-harvest loss from small-scale producers. The relationship of the variable for small-scale producers implies that as sesame farm size increases by 1 ha, the amount of sesame post-harvest loss increases by 1.8%. The reason for the relationship of land size to post-harvest loss may be, that the probability of small-scale producers in obtaining laborers for handling the harvesting and threshing activities is limited as workers goes to large-scale production. Small-scale producers also manage their farm by themselves which lacks frequently follow up. Thus, aggravates loss. The result found is consistent with the results of Basavaraja et al. (2007).
Distance of sesame farm from residence (distfh)
It is significant and positively related to variable in determining post-harvest loss at 10% significance level for small-scale sesame producers. According to the result found if sesame farm is far distant from residence by 1 km, the amount of sesame grain post-harvest loss from small-scale producer increases by 2%. The reason for this relationship could be as farm is distant, laborers may not properly manage the harvesting and threshing activities, secondly the frequency of follow up and management becomes reduced and thirdly grain loss increases while it is transporting. The result of this study is similar with the result of Ayaneliji et al. (2011).
Total amount of sesame production in 2015/2016 (lnTSsY)
This is significantly and positively related to sesame post-harvest loss at 1% significance level for small-scale producers. The result implies that if total production increases by 1%, sesame grain post-harvest loss increases by about 24%. This result shows that, total production is the most determinant factor of sesame post-harvest loss in both small and large-scale producers. This relationship could be due to the fact that, as production increases the managerial aspects could be shared out for the entire product. It may also be for the reason that as the amount of output increases, the storage capacity to accommodate all becomes limited. The result found in this study is in line with the results of Ayandiji and Adeniyi (2011) and Basavaraja et al. (2007).
Weather condition (weazer)
It is found that this variable is significantly and positively related to sesame grain post-harvest loss at 1% significance level for small-scale sesame producers in the study area. So, as wind and rain is happening during harvesting to threshing time, the amount of sesame grain post-harvest loss increases by 3.7%. The result obtained in this study is so consistent with the result of Basavaraja et al. (2007).
Distance piles transported to threshing place (disthila)
This is a significant variable that positively affect the determination of sesame post-harvest loss at 1% significance level for small-scale sesame producers. The result found shows that as the distance piles transported from stacking place to threshing place increases by 1 m, sesame grain post-harvest loss increases by 1%.
Extension contact (extn)
This is statistically a significant variable which it negatively determines sesame grain post-harvest loss for small-scale producers at 5% significance level. So that, as the number of extension contact on sesame production of the small-scale sesame producers increases by one, sesame grain post-harvest loss could reduce by 16%. The reason for this relation may be, as extension service is provided to capacitate producers in managing their production and handling problems. Thus, enables to control the post-harvest loss amount.
Number of stacking days (daystak)
It is statistically significant that positively it determine the amount of sesame grain post-harvest loss for small-scale sesame producers at 1% significance level. This result shows that if the number of drying/stacking days increases by one, the amount of sesame grain loss for small-scale sesame producers increase by 6.4%. The positive contribution of this variable may be, as the number of drying days increases there are pests to consume the seed (e.g. webworms and rodents) and wind and rain have also made grain to lose out of pods. The result found is complementary with the result of Ayaneliji et al. (2011).
Mode of sesame grain transportation (modtrSfh)
This is statistically significant that positively affect sesame grain post-harvest loss at 10% significance levels for small-scale producers. The result shows that if small-scale sesame producers used caro/donkey for transportation, their sesame grain loss is reduced by 6.51% as compared to transportation by tractor/trackers. The reason for this relationship might be that mostly the load/unload activities in tractors/trackers is done by hired workers who might provide less attention and care while performing the loading/unloading activities. Thus, induces higher amount of sesame grain loss as relative to the caro/donkey that may be easily managed. So, what is needed is to properly control/manage the workers performance so to manage as that of the caro/donkey.
CONCLUSIONS
The result of the study revealed that the percentage of sesame grain post-harvest loss shared from the total production obtained by the small-scale producers was 23.68%. This shows that about one fourth of the total production was lost after maturity. The determinant sources of this sesame grain post-harvest loss, as found in this study were farm size, total sesame grain produced, weather condition, distance piles transported, stacking days, distance of sesame farm and mode of grain transportation that were significantly and positively related with sesame grain loss. But, educational level and extension contact significantly and negatively affected sesame post-harvest loss from small-scale producers at 5% significance level.
To reduce the impact of these positively contributing variables to sesame grain loss, technologies for piles drying, piles transporting, reducing weather hazards impact and pest attack effects from harvesting until threshing that could reduce post-harvest loss amount by more than half is important to be introduced. It may also be important that, loss may be minimized as government and other stakeholders together initiate producers to effectively manage and follow up their farm activities. Strengthening the capacity of producers through further education may reduce sesame loss. It is also better to reduce the sesame post-harvest loss, if the extension service provided for small-scale producers is strengthen with practice at field level.
CONFLICT OF INTERESTS
The authors have not declared any conflict of interests.
ACKNOWLEDGEMENT
The authors thank GDN, BERCEA supporting program for its financial support provided for the study.
REFERENCES
|
Alexandratos N, Bruinsma J (2012). World agriculture towards 2030/2050: the saving water. From Field to Fork-Curbing Losses and Wastage in the Food Chain 2012 revision. Working paper: FAO: ESA No. 12-03, P 4. |
|
|
Aramyan LH, van Gogh JB (2011). Reducing post-harvest food losses in developing economies by using a network of excellence as an intervention tool. Drafted in preparation of the 2014 IFAMA and CCA Food and Agribusiness World Forum: 'People Feed the World'. June 15-19, Cape Town, South Africa. |
|
|
Ayandiji AR, Adeniyi OD (2011). Determinant post-harvest losses among tomato farmers in Imeko-Afon local government area of Ogun State, Nigeria. The Global Journal of Science Frontier Research 11(5):23-28. |
|
|
Basappa G, Deshmanya JB, Patil BL (2007). Post-harvest losses of maize crop in Karnataka: An economic analysis. The Journal of Agricultural Science 20(1):9-71. |
|
|
Basavaraja H, Mahajanashetti SB, Naveen U (2007). Economic analysis of post-harvest losses in food grains in India: A case study of Karnataka. Agricultural Economics Research Review 20:117-126. |
|
|
Central Statistical Authority (CSA) Federal Democratic Republic of Ethiopia (2014). Agricultural sample surveys: Area and production of major crops (Private Peasant Holdings, Meher Season) Vol. 1, Addis Ababa, Ethiopia. |
|
|
Central Statistical Authority (CSA) Federal Democratic Republic of Ethiopia (2015). Agricultural sample surveys: Area and production of major crops (Private Peasant Holdings, Meher Season) Volume III, Addis Ababa, Ethiopia. |
|
|
Food and Agricultural Organization of the United Nations (FAO) (2011). Global food losses and food waste: Extent, causes and prevention. Study conducted for the International Congress. Rome, Italy. |
|
|
Hagos T, Fetien A (2011). Additive main effects and multiplicative interactions analysis of yield performance of sesame genotypes across environments in Northern Ethiopia. Journal of the Drylands 4(1):259-266. |
|
|
Hodges RJ (2012). Post-harvest weight losses of cereal grains in Sub-Saharan Africa. African Postharvest Losses Information System (APhLS). |
|
|
Hodges RJ, Buzby JC, Bennett B (2011). Global food and farming futures: Post-harvest losses and waste in developed and less developed countries: opportunities to improve resource use. The Journal of Agricultural Science 149:37-45. |
|
|
Kahsu K, Melisew M, Annemarie GK (2014). Sesame yields and post-harvest loss in Ethiopia: Evidence from the field. Summited to Sesame Business Network (SBN), Gondar, Ethiopia. |
|
|
KHARDO (Kafta Humera Agricultural and Rural Development Office) (2014). Annual report on crop production and productivity: In Kafta Humera woreda. Kafta Humera, Humera, Ethiopia. |
|
|
KHARDO (Kafta Humera Agricultural and Rural Development Office) (2015). Annual report on production and productivity of agriculture in Kafta Humera woreda. Kafta Humera, Humera, Ethiopia. |
|
|
Kindie A (2007). Sesame market chain analysis: The case of Metema district Amhara regional state, Ethiopia. MSc Thesis, Haramaya University, Haramaya, Ethiopia 143 p. |
|
|
SBN (Sesame Business Network) Support Programme (2013). Launching Workshop Report: In North Western Ethiopia. May 15-16, 2013. North Western Ethiopia, Gondar, Ethiopia. |
|
|
Tefera T, Stephen M, Yoseph B, Haron K, Regina T (2011). Grain yield, stem borer and disease resistance of new maize hybrids in Kenya. African Journal of Biotechnology 10(23):4777-4783. |
|
|
United Nations (UN) (2013). Food and Agricultural Organization. Global Food Losses and Food Waste- Extent, Causes and Prevention. Rome. Think Eat Save. |
|
|
Wijnands HM, Biersteker J, Heil R (2007). Oilseeds business opportunities in Ethiopia. The Hague. |
|
|
Yamane TI (1967). Statistics: An introductory analysis: 2nd edition. New York: Harper and Row. |
|
Copyright © 2024 Author(s) retain the copyright of this article.
This article is published under the terms of the Creative Commons Attribution License 4.0


