ABSTRACT
Cross-sectional data was used that was collected from 181 households in 2011/2012, to estimate households’ willingness to pay for improved water service in Nebelet. The probit model was used to identify socio-economic factors that affect the willingness to pay (WTP) of households. Interruption, delay in maintenance, irregular/erratic availability of the public water supply, the price charged per unit, the unequal treatment households face while collecting water at the public supply were found to be the pressing water problem existing in the study area. The descriptive analysis result showed that 96% of the sample households were willing to pay for the provision of improved water service. The Probit model showed that income, distance, water expense, bid, education, level of existing water satisfaction, marital status and sex were associated with households’ willingness to pay for the provision of improved water services. Indicating, in designing water project/policy socio-economic factors (such as age, monthly income, educational level) should be considered for successful water project/policy at household level.
Key words: Existing water problem, contingent valuation method, improved water provision.
Development is the integration of economic growth, social, cultural and political conditions (Fissha, 2006; Abebaw et al., 2010). In this regard, most of the sub-Saharan African countries are at a very low stage of development. One of the obvious reasons for the backwardness of those countries is lack of effective and sustainable utilization of the available natural and human resources (Fissha, 2006; Wendimu and Bekele, 2011). Access of clean and safe water which is the integral part of development in general and is one of the basic urban services which highly affects the economic progress of a country and the health of the people in particular is low in developing countries (Baimba, 2003; Delesho, 2006; Abebaw et al., 2010; Lisa, 2009). It is at the heart of the poverty trap especially for women and children, who suffer in terms of illness, drudgery in collection of water and lost opportunities because of the time that water collection consumes (Aloyce et al., 2002; Abebaw et al., 2010). Moreover, the mortality and morbidity rates and the number of working days lost that can increase GDP due to lack of clean and safe water are the major problems (Mirajul et al., 2008; Wendimu and Bekele, 2011; Behailu et al., 2012). In Ethiopia the coverage of improved water supply in both urban and rural areas is poor though it is relatively better in urban areas (Bayru, 2004). The provision is low compared to the increasing demand for clean drinking water owing to the increase in the living standard of individuals and the population growth (Baimba, 2003; Kassa, 2006; Behailu et al., 2012). The average access to clean and safe water supply for the fiscal year of 2009/2010 was about 17% of the total population reflecting much worse situations considering the unreliability and unsustainably of the supply of safe water (MoWR, 2010). To reduce the problem, the government has been working by allocating considerable resources. Thus, relatively the provision for improved water services has improved compared to the previous decades. As stated in Abebaw et al. (2010) access to safe drinking water for the year 2011 both urban area and rural areas, 79 and 46.4% respectively, was reached.
However, the intention of the government was on the least cost method of providing potable water. Even the design for new systems to provide clean and safe water has been of general nature and projects were constructed with little understanding of household water demand behavior resulting in failure to achieve the goals set for the number of households to be connected to the water system. Even the amount of water produced and the proportion of costs recovered and the gap between expectations and accomplishments were great in the absence of involving consumers in the project (Guha, 2011). This is a good reflection that it is not necessary to plan, design, and manage water systems without having the involvement of the consumers. It requires eliciting the value society would have for the improved provision of water, to plan, design and manage urban water supply.
Because of the difference in values society would attach to resources according to their socio-economic characteristics, the type of improvement and the reliability of water supply economists may use different approaches (Gaha, 2011). The concept of willingness to pay which is used to determine the amount of money consumers are willing to pay and thereby identify their level of cooperative for the improved provision of the environmental resource is one of the approaches (Lisa, 2009; Molla, 2005).
Such estimated monetary values for ecosystem goods and services which do not normally have prices are important for resource (like water) management decisions (Agudelo, 2001; Pearce, 2002). It helps policy-makers to set standards related to environmental goods and service uses and to design incentives that encourage ecosystem service protection (Anderson et al., 2010). It can be also employed in the assessment and implementation of policies that are used to monitor and manage water resource depletion and degradation (Molla, 2005; Gebreegziabher and Tadesse, 2011). Thus, this study was undertaken in Nebelet town where drinking water service is a serious problem. It is aimed at estimating the economic value of drinking water resource and identifying the factors that determine households’ willingness to pay, assessing households’ perception of the existing water supply situation and water problems and generating baseline information for policy intervention.
Area description
The study was conducted in Nebelet which is one of the rural towns of Wereda Werie Lekhe. It is located to the east of Edaga-Arbi which is the seat of the Werda administration. Geographically it is located 14° 5' 48" North, 39° 16' 5" East. Moreover, it is located 918 km north of Addis Ababa and 135 km north of Mekelle. The town lies in ragged topography with an altitude ranging from 2150 to 2270 m.a.s.l. The town has an inhabitant of 4750, out of these, 2430 are females and 2320 are males. It has a total area of 154.45 km2 with population density of 30 per kilometer square. Petty trade, daily labor and urban agriculture such as dairy farming, irrigation, and poultry are the main sources of income for the community in the town. Selling Tala which is the locally prepared alcohol equivalent of beer is among the major source of income and is the main means of income for many women to sustain their life and educate their child. It has annual rainfall ranging from 759 to 1500 in mm. It has Kolla agro ecological zone with annual temperature ranging from 12 to 25°C. The source of the water for the town is currently from “Chiemit” which is 7 km away and pumped up to the tankers with the help a generator. To date, the town has three tankers with water holding capacity of 50, 50 and 25 m3. Water from these tankers is distributed to the residents through eight public taps (standpipes) available at the two kebeles and 61 private connections. From the existing figure, on average, it is calculated that one public tap is a source of water for 594 numbers of people. These public taps on average also are available for customers for seven hours a day, three hours in the morning and four hours in the afternoon.
Data type and sources
A cross sectional primary data were collected in 2011/12. The primary data utilized in the descriptive and empirical analyses of this study were collected using structured questionnaire. The collected data included information on the socio-economic characteristics, existing water supply situation and willingness to pay for improved water service of the sample households. A contingent valuation method (CVM) method was employed to elicit households’ WTP for the provision of improved water service. In contingent valuation surveys, there are about four major elicitation methods, namely payment cards, discrete choice (single bounded dichotomous choice), discrete choice contingent valuation with follow-up questions (double-bounded dichotomous choice) and open ended. In this study the double-bounded dichotomous is the choice preferred for correcting the strategic bias and improved statistical efficiency. Firstly, yes-no, no-yes responses for the offered bids make clear bounds on unobservable true WTP; secondly, the yes-yes, no-no response in the double bound dichotomous choice format sharpens the true WTP (Haab and McConnell, 2002) was employed. The study was also supplemented by secondary data from the Bureau of Water Resources, Nebelet water supply office and from the bureau of water, mining and energy of Tigray region.
Sample design
The town consists of two broad kebeles and both kebeles were included in the study. From the total households (1012) obtained from the 2007 housing census of Ethiopia, 181 sample households were randomly selected from both kebeles for this study. The proportion of number of households in each kebeles to the total number of households in the town was calculated and this proportion was used to determine the number of sample households from each kebeles to be included in the sample. Accordingly, 96 sample households were from kebele one whereas 85 of the sample households were from kebele two. Respondents from each of the kebeles were selected randomly. The choice was made in such a manner that every household had equal probability of being chosen and that neither the researcher nor the data enumerator had an influence as to which household should be selected or excluded from the list of households obtained. In each household, the head of the household or working member of the households was interviewed.
Data analysis
Descriptive statistics such as frequency distribution tables, mean and standard deviation were used to analyze the socioeconomic characteristics of the respondents, the existing status of water service and the perception of households towards the existing situation of water supply. The probit model was used to compute and determine factors affecting households’ willingness to pay for improved water supply.
Econometric model specification
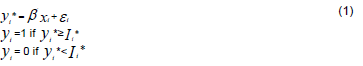
The probit model was used for the binary response (0, 1), that is, whether the household is willing to pay or not for the offered bid.
Following Cameron and Quiggin (1994), the probit model takes the following form:
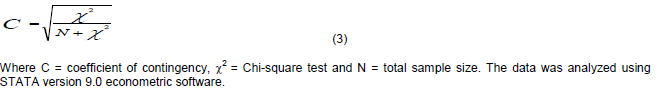
Where, Ri2 is the coefficient of determination in the regression of one explanatory variable (X) on the other explanatory variables (Xi). If there is no co-linearity between regressors, the value VIF is one (Gujarati, 2004). To see the degree of association between the dummy variables a contingency coefficient was also estimated by using Equation (3):
Variables definition and their hypothesized effects
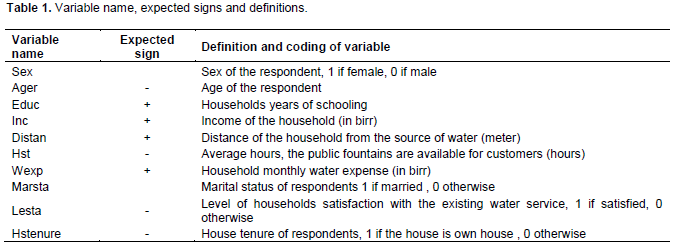
In this study, a number of socioeconomic and demographic characteristics are expected to affect the household’s willingness to pay for the provision of improved water service. Some of the factors that are expected to affect the household’s willingness to pay in the study area are defined in Table 1.
Socioeconomic background of respondents
181 sample households were taken for the analysis of this study. Of these sample households 59% were women whereas the remaining 41% were males. The age of the surveyed households ranges from the minimum of 19 to a maximum age of 77, with an average age of 37. Survey result also showed that 85% of the surveyed households were male headed and the remaining 15% were female headed. The marital status of the respondents indicated that 80% were married and the remaining 20% were unmarried.
Data about the house condition of households showed that 54% of the sample households live at their own house whereas the remaining 46% households live at rent house from kebele or private peoples. Family size of the sample household from the survey showed that 50% of the respondent’s family size was between the ranges of one to three, and 46% had a family size between four and seven and the remaining 4% had a family size greater than seven. Family size of the sample households ranges from the minimum of 1 to the maximum of 9 with an average size 3.6.
Data about the educational attainment of the surveyed household revealed that 46% of the surveyed households fall under the educational category of primary school and 22% of the respondents fall under the educational categories of high school, another 22% of the households fall to the educational category of illiterate, and the remaining 10% fall under the category of college education. In sum, from the surveyed sample households 82% were educated and the remaining 22% were illiterate indicating large proportions of the households have attained at list a primary school.
Data from the survey indicated that of the total households, 59% were under the category of monthly income from zero up to one thousand birr, 35% were under the category of monthly income from one thousand one hundred up to two thousand birr and another 6% were under the category of monthly income above two thousand one hundred. The average monthly income of the sample households was 1037 birr with a minimum monthly income of birr 200 and maximum monthly income of 4550 birr.
Rank for different services
The total sample households were given seven social services to be ranked in accordance with their priority of need. Survey results showed that 96% rank health service as their first need, 75% of the respondent said water supply is their second need and 60% of the respondent rank school service as their third need. Road, power, toilet, and telephone service are ranked from fourth to seventh respectively. This shows that health and related services such as water supply and sanitation are very essential for the town people and reveal their consistent ranking for the different social services given as options.
Water supply situation and perception of households to the existing water problem
With regard to the existing service households had recognized the improvement of the water service as compared to the past five years. From the focus group discussion most of the households were relied on hand pumps, springs and rivers before the public taps are constructed and they had bad memories on it. Traveling long distance (2-3 km away) to get water service from the hand pumps which were available at the peripheries of the town and unsafe water from the sources were the main problems households remember from the past five water service of the town.
Nowadays as indicated by most of the households, their main source of water is the public tap which comes from “Chemit” by the help of a generator. In other words, 96% of the households have got water from these public taps whereas 4% of the households still got water from hand pumps, springs and rivers. 97% of the households who get their water from the public tap used water for cooking and drinking, bathing and washing clothes, and another (3%) used water for watering their livestock and plants in addition to cooking and drinking, bathing and washing their clothes (Table 2).
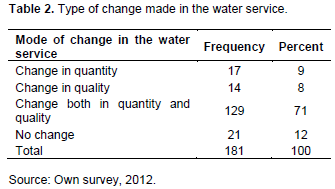
The average individual water consumption of households from the survey was 65 L with a corresponding average monthly water expenditure of 43 birr ($2.20) which is 4% of their average monthly income of the household, and is less than what is recommended by World Bank which is 5%. This implies that a household living in the study area can spend more if they are provided with improved water supply (get water at his/her home). Moreover, 79% of the households were perceived the presence of an improvement on the water service of the town and 71% of them agreed the change is both in quality and quantity whereas, another 17 and 14% agreed with the presence of change in quantity and quality respectively.
Moreover, a discussion with the sample households about the existing situation of water in the survey indicated the presence of radical change in the water service both in quality and quantity as compared to the past five years. This implies that households are aware about the quality and quantity of the water they use and the changes made to the water service they got. Therefore, this is a good indicator that households are cooperative and willing to pay if there is any further improvement in the water delivery system of the town. The higher connection fee required at a time which is minimum of 3800 birr ($195) per household per one kilometer (60%) and the house tenure problem and shortage of water pipes supply from the water office were the main reasons that households revealed for not getting water at their yard (campus). Nevertheless, response on households’ willingness on this survey indicated that they would be willing to contribute to the connection fee monthly adding to their monthly bills (charge) if there is any organization, it could be the government, who cover the initial connection fee.
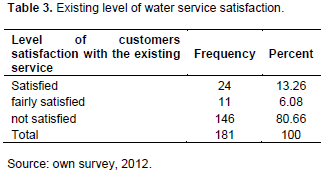
The level of satisfaction of households with water delivery of the town was discussed. In this regard, households in the study town were less satisfied with the existing water service. Only few (13%) households were satisfied with the existing level of water provision from the water office of the town, (6%) were fairly satisfied, whereas the majorities (81%) of the sample households were not satisfied with the existing water service. Interruption of the service without any announcement, delay in maintenance of the public taps when they are broken and the public fountains not being open for customers at the time they like it were some of the reasons for their dissatisfaction (Table 3).
In addition, frequent breaking of the water pipes because of high water pressure, the arbitrary punishment set for those who waste water while filling their containers from the public taps, the high price they pay per jerican in the public water supply were some of the problems household indicated during the survey. Moreover, carrying water for long distance, high population pressure in the water points and killing long time at the water point and the inefficient management of water by the water office were also the other pressing problems they stated for their dissatisfaction with the existing water service.
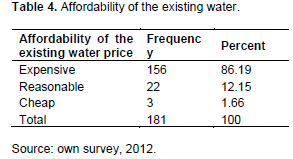
Affordability of the existing water price in the study area was the other important variable discussed with the sample households. In this regard, households were asked how much do they spent per 20 L (Jerican) in the public tap. According to the water office, guards of the water points and customers as well the price of water per 20 L (Jerican) was 40 cents. Households were asked to state the price they charge as an expensive, reasonable and cheap. Accordingly, 86% of the surveyed households did respond that the water price they charge as expensive. Referencing to the past service they were using and the problems they were facing, 22% of the households stated their payment per 20 L (Jerican) in the public tap as reasonable. Whereas small amount of (3%) the households were stated their payment to the 20 L water from the public tap as cheap. Households were dissatisfied to the payment they made to get a 20 L (Jerican) of water from the public tap. The arbitrary fine placed by the water guards to the customers when they use the public tap to get their water was the problem that households raised during the survey (Table 4).
They further stated that the punishment put to customers by the guards of the water points (public taps) when they spill water is simply arbitrary. There is no reason for the water guards whether the price charge to customers is equivalent to the water they waste when they fill their Jericans (containers). The other problem that households raised in connection to this was also the unequal treatment of customers. As point out by the customers the one who have a good approach with the water guards was going to be charged less even when he/she waste much amount of water. This reflects the preference of households to privately connect to the main water sources and pay based on the water they used. Also this implies household would will to pay for the provision of improved water service.
Another important variable concerns household’s attitude towards the responsibility of improved water provision, 25% of the respondents expresses that the government should provide free or subsidized improved water service to the citizens, while the rest 75% said that either the community, private or all should be responsible.
Households willingness to pay for improved water service
Almost all of the surveyed households (96%) were willing to pay for the improved water service (willing to connect privately to the water service) whereas 4% are reported as not willing to pay for the improved water service (did not prefer the private connection). The types of improvement made to the water service described to the customers were of two types. The improvement on the public supply by increasing their number in the town and to privately connect household to the main pipes and create an environment to recover the connection fee by the households adding to their monthly water bill. Accordingly, 89% of the surveyed households were willing to connect privately and choose the private improvement scenario where as 11% of the households were willing the public improvement and agreed to pay to cover the cost of improving the public taps by adding to their monthly water expenses.
Determinants of household’s willingness to pay
Family size, age, income, sex, distance from source of water, average time households spent to fetch water, education level, house tenure, daily water expense, hours the public fountains stay open for customers, years a respondent stay in the town, affordability, level of satisfaction, occupation, type of water source, change in water service and initial bid were some of the variables identified to affect households willingness to pay. Before the probit regression is estimated, explanatory variables on households’ willingness to pay, before the probit regression is estimated, the explanatory variables were checked for multi-co-linearity using the variance inflation factor and simple pair wise correlation matrix and serious multi-co-linearity problem was detected between the variables water expense and water consumption, years stay and house tenure, average time taken to fetch water and distance. The variables water consumption, years stay, average time was dropped from the regression. Standard errors were rubosted for the presence of heteroskedascity. A test to avoid dummy variable trap was conducted and no dummy variable trap was found. The Shapiro w tests for normal data were conducted for the normal distribution of the explanatory variables and variables were found normally distributed (Table 5).
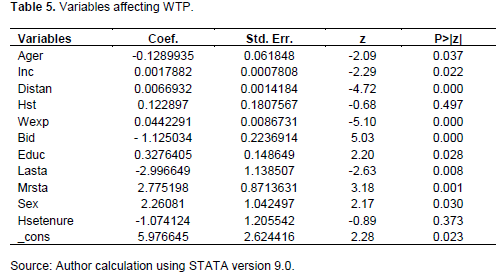
Variation in willingness to pay for the provision of improved water service was observed on households. Old aged households were less likely to pay for the provision of the improved water service. This is highly related to income and to the concept that old peoples fear to invest on projects which their return is expected after long term. This agrees with Fujita et al. (2005), who recognizes the younger the age of the respondent, the higher is the monthly income and the higher is willing to pay for the improved water service.
A significant difference was observed during the survey between households in willing to pay for the provision of improved water service. The variable household income was significant at 5% significance level. The sign of the variable household income is as expected and affects willingness to pay positively. This tells us the realities that as the income of households increase their demand to improved services increased. This is in line with the studies done by Fujita et al. (2005), Hensher et al. (2005), and Fanta (2007), who found that when income increases the probability of the household saying yes to contribute for the improved service increases.
The sign for the sex variable was positive. A significant difference was recorded between male and female in willing to pay for the improved water service. Female headed households were more willing to pay for the improved provision of water service than their male counterparts. This may be females are responsible to collect water and are directly influenced by water related problems. This is similar to the research done on affordability and willingness to pay of water supply in Nazrath town, Ethiopia, Bayru (2004) who observed a difference on willingness to pay between male and female headed households.
The distance variable shows the distance the households have to travel before getting water from the public tap. Significant difference was observed among the households’ in willing to pay for the provision of improved water service. The further the household from the nearest public taps, the higher the disutility to the household involved. The variable has a priori positive sign, indicating that households far away from the source of water would be willing to pay more. This could be because households located near the source would take shorter time to fetch water and minimizes cost of transport. This is in line with the studies, Olajuyigbe and Fasakin (2010), Coster and Otufale (2014), who recognized a positive relationship between households’ willingness to pay and distance of source of water.
The level of education attained by the household heads has the expected positive sign, which indicates that households whose heads have higher education indicated a higher willingness to pay than the less educated ones. Higher education shifts the demand for water services to the right, implying a higher level of welfare. A household with higher level of literacy has better chances of maximizing the utility and welfare from consuming and having access to clean and potable water. The result is not unusual; the enlightened population has great impact on the demand for welfare facilities like water, health, education, sanitary conditions, etc. Education is significant at 90 and 95% levels. Similar studies were found by Ogujiuba (2013), Herath and Masayuki (2014) in their study on estimating the Willingness to Pay for Water Services.
Water expense affects households’ willingness to pay positively and was statistically significant at 10% level of significance. Households showed a significance difference on willingness to pay for provision of improved water service. Households with higher monthly expenditure of water were more likely willing to pay for the provision of improved water service. This may be in line to the reality that if households incur higher cost, they would be willing to pay more if provided with improved water service. This was similar to the research result found by Bayru (2004), Herath and Masayuki (2014) on their research done on the households’ willingness to pay for improved water.
The coefficient for the variable level of households’ satisfaction with the existing water service had the expected sign and statistically significant at 5% level of significance. Households had showed a significance difference on willing to pay to the provision of improved water service. Individuals who satisfied with the existing water supply were less likely to pay for provision of improved water service over those unsatisfied. One possible reason could be those households who were unsatisfied with the current water service due to poor quality, less quantity, unreliability and absence of own private pipe are likely to pay for improved water services than those households who were satisfied with the existing services. The fact that, it is significant showed that the variable level of households’ satisfaction with the existing water services was a major determinant of the willingness to pay the amount for the proposed water supply services. This agrees with Gebreegziabher and Berhanu (2007) who recognized a negative relationship between willingness to pay and households’ level of satisfaction.
The regression result analysis showed that marital status was found statistically significant. This indicates that married respondents were more likely willing to pay for the provision of improved water as compared to their unmarried counter parts. This is because married people are more cautious of the health and other risk involved in poor water supply service due to family responsibility in the future than their single counterparts. This is similar to the study done by Coster and Otufale (2014). The coefficient for the variable bid was negative and was significant at 5% level of significance. As the bid offered to the respondent increases the probability of the household willingness to pay for the improved water service decreases. This was in line to the studies done on improved water service in Harar town; Bekele (1999) and Coster and Otufale (2014) who recognized a negative relationship between willingness to pay and initial bid.
CONCLUSION AND RECOMMENDATIONS
181 households were analyzed in this study and their socioeconomic and demographic characters such as marital status, sex, age and income were discussed. Regarding the existing water service in the study area, households’ were not satisfied and they stated that interruption, delay in maintenance, high population pressure on the water points and high water pressure are the vital problems in the water service of the study area. Most of the households (89%) prefer to connect privately to the main water pipe and were willing to pay for the connection fee adding to their monthly bill. Factors affecting households’ willingness to pay for the provision of improved water service in the study area was analyzed using the probit model. The coefficients of Income, distance, water expense, bid, education, affordability, marital status and sex were significant whereas the coefficients for the variables house tenure and hours the public tap is open to customers was not significant. However, the variable house tenure affects willingness to pay negatively.
If the government or any organization covers the connection fee initially in the study area, they would recover the cost before the five years project. The policy implication of the study is that the inhabitants of Nebelet town are willing to pay for improved water supply service if it is provided for an affordable price. In addition, policymakers need to be aware that socio-economic characteristics and water use practices of households influence the willingness to pay for better water services.
The authors have not declared any conflict of interest.
REFERENCES
|
Abebaw D, Tadesse T, Mogues T (2010). Access to improved water sources and satisfaction with services evidence from rural Ethiopia, International Food Policy Research Institute, Sustainable Solutions for Hunger and Poverty. |
|
|
|
Agudelo JI (2001). The economic valuation of water, principles and methods. Value of Water, Research Report Series P. 5. |
|
|
|
Aloyce RM, David W, Yang (2002). Willingness to pay to improve domestic water supply in rural of Central Tanzania, implications for Policy. Int. J. Sustain. Dev. World Ecol. 10:2. |
|
|
|
Anderson J, Gomez W, McCarney G, Adamowicz W, Chalifour N, Weber M, Elgie S, Howlett M (2010). Ecosystem service valuation, market-based instruments and sustainable forest management: A Primer. State of Knowledge Primer. Sustain. For. Manage. Network Edmonton Alberta P. 25. |
|
|
|
Baimba BI (2003). Willingness to pay for improved water services in Sierra leone: evidence from makeni. A Thesis Submitted to the School of Graduate Studies of Economic Policy Analysis, Addis Ababa University. |
|
|
|
Bayru A (2004). Affordability and willingness to pay for improved water supply in urban areas of Ethiopia. |
|
|
Behailu S, Kume A, Desalegn D (2012). Household's willingness to pay for improved water service: A Case Study in Shebedino District, Southern Ethiopia. Water Environ. J. 26(3):429-434.
CrossRef |
|
|
|
|
|
Cameron TA, Quiggin J (1994). Estimation Using Contingent Valuation Data From A 'Dichotomous Choice With Follow-Up' Questionnaire: J. Environ. Econ. Manage. 27(3):218-234. |
|
|
|
Coster AS, Otufale GA (2014). Households' Water-Use Demand and Willingness to Pay for Improved Water Services in Ijebu Ode Local Government Area, Ogun State, Nigeria. J. Environ. Earth Sci. 4(17):2225-0948 |
|
|
|
Delesho A (2006). Urban Water Supply: The Case of Assosa Town, Unpublished Thesis Submitted to School of Graduate Studies on Regional and Local Development Studies, Addis Ababa University. |
|
|
|
Fanta G (2007). Households' willingness to pay for improved water services in Debre-zeit town, Ethiopia.A thesis submitted to the school of graduate studies addisababa university in partial fulfillment for the masters of science degree in economics (Natural Resource and Environmental Economics), Addis Ababa University. |
|
|
|
Fissha M (2006). Household demand for improved water service in urban areas: the case of Addis Ababa, Ethiopia, A thesis submitted to the school of graduate studies of environmental and resource economics, addisababa university. |
|
|
|
Fujita Y Fujii A, Furukawa S, Ogawa T (2005). Estimating willingness to pay for water and sanitation services through contingent valuation method: A Case Study in Iquitos City, Republic of Peru, JBICI Review, and No.10. |
|
|
|
Gebreegziabher K, Berhanu A (2007). Valuing water supply service improvements in Addis Ababa: Ethiopian economic association, proceedings of the fifth international conference on the Ethiopian Economy 5(3):978-999 44-54-07-5. |
|
|
Gebreegziabher K, Tadesse T (2011). Household Demand for Improved Water Supply Services in Mekelle City, Northern Ethiopia. Water Policy 13(1):125–142.
CrossRef |
|
|
|
Guha S (2011). Valuation of clean water supply by willingness to pay method in a developing nation: A Case Study in Calcutta, India. J. Young Investig. 21:6. |
|
|
|
Gujarati DN (2004). Basic Econometrics. 4th Edition. McGraw-Hill, Inc. |
|
|
Haab TC, McConnell KE (2002). Valuing Environmental and Natural Resource: The Economics of Non Market Valuation. New Horizon in Environmental Economics, Printed and Bounded in Great Briton by MPG Books Ltd, Bodmin, Cornwall. P. 352.
CrossRef |
|
|
|
|
Hensher D, Shore N, Train K (2005). Households' willingness to pay for water service attributes. Environ. Resourc. Econ. 32(4):509–531.
CrossRef |
|
|
|
|
|
Herath G, Masayuki T (2014). Willingness to pay and inclusive tariff designs for improved water supply services in urban Bangladesh. J. Sustain. Dev. 7(5):1913-9071 |
|
|
|
Kassa B (2006). Household water supply and factors affecting consumption level: The Case of Mekelle Town, Tigray. lisa M (2009). The environmental impact caused by the increasing demand for water, water and resource management: A Case Study in Ethiopia. |
|
|
|
Mirajul H, Usman M, Iftikhar A (2008). Household's willingness to pay for safe drinking water: A Case Study of Abbottabad District, Pakistan Institute of Development Economics Islamabad, Pakistan, MPRA Paper No. 15208, Posted 13. May 2009 / 11:20.
View
|
|
|
|
Molla TY (2005). Farmers' response and willingness to participate in water harvesting practices: A Case Study in Dejen District, East Gojam Zone. A Thesis, Submitted to the Department of Agricultural Economics, Alemaya University. |
|
|
|
MoWR (2002). Ethiopian water resources management policy. |
|
|
|
Ogujiuba K, Ukwueze E, Ogbonnaya M (2013). Estimating the willingness to pay for water services in Nsukka area of south-eastern Nigeria using contingent valuation method (CVM): Implications for Sustainable Development. J. Hum. Ecol. 41(2):93-106 |
|
|
|
Olajuyigbe AE, Fasakin JO (2010). Citizens' willingness to pay for improved sustainable water supply in a medium sized city in south western, Nigeria: Curr. Res. J. Soc. Sci. 2(2):41-50. |
|
|
|
Pearce D (2002). Economic valuation with stated preference techniques: Queen's Printer and Controller of Her Majesty's Stationery Office. |