Full Length Research Paper
ABSTRACT
The livelihood diversification increases sources of income and smoothens consumption by promoting rural food security. In Ethiopia little attention has been given to livelihood diversification and the numerous factors that determine the abilities of rural household‘s choice of different livelihood activities. Thus, the objective of this study is to generate location specific data regarding the livelihood diversification and its role in attaining household‘s food security. A multi-stage sampling technique was used to select 191 sample households, by undertaking structured questionnaire to obtain data pertaining to livelihood diversification and its implication to food security during the year of 2016. Additionally, key informant interview, focus group discussion and observation were the principal methods used to generate data. Descriptive statistics and ordered logit regression model were used to analyze quantitative data. The result of ordered logit model showed that education level of household-head, land size of household, annual income of household head, membership of households in the organization, credit utilization, and access of extension services were significant in determining the livelihood diversification of households in the study area. On the other hand, while age and family size of households were found to be negatively correlated (P<0.5) and related to household level of livelihood diversification. Moreover, the findings of this study gave insight into factors affecting livelihood diversification and its importance to food security. Therefore, government should promote livelihood diversification in order to promote food security in the area.
Key words: Education level, household size, livelihood diversification, ordered logit model, rural households.
INTRODUCTION
Poverty is predominantly a challenging phenomenon in majority of the developing countries (Alderman, 2000). The situations are becoming worst in the sub-Saharan Africa. The region constitutes 239 million out of the world 925 million food insecure people and it is one of the world‘s most food-insecure region. Food insecurity continues to be a major developmental problem in the country, undermining people’s health, productivity and often their very survival. Poverty and food insecurity continues to be mutually reinforcing, 34 million people are food insecure (FAO, 2012). The livelihood of people in Africa depends mainly on agriculture and this seems to continue in the future (Karen et al., 2013). In Ethiopia, undiversified livelihood options and complete dependency on agricultural production is also the main problems that exacerbate food insecurity in the area. The ability to diversify at all is often critical to the food security of the most vulnerable populations (Ellis, 2000). An estimated 5–6million people are considered chronically food insecure that is, they require some type of food aid to meet their minimal food requirements every year (Haan et al., 2006). Smallholder farming is the dominant livelihood activity for the majority of Ethiopians, but it is also the major source of vulnerability to poverty, food insecurity and, recurrent famines (Devereux et al., 2005).
Regardless of substantial resources invested each year by the Government and its partners to reduce food insecurity, both chronic and transitory food insecurity problems continue at the household level (FAO/WFP, 2010). According to Asmamaw (2004), the limited opportunity for livelihood diversification, due to absence of supplementary income from other non-farm activities has made the Ethiopian rural poor more vulnerable. According to Haan et al. (2006), African farmers try to diversify their livelihood strategies through on-farm and off-farm activities even though significant numbers of farmers in developing countries depend on rain fed traditional farming system that expose their production to climatic change.
Despite ample resources and agro-climatic stability for production, Ethiopia is not able to achieve food self-sufficiency yet and a significant share of the population depends on food aid. The number of people vulnerable to famine and food insecurity increases during unfavorable years of drought, (EEA, 2004/2005). Due to the growth of a population in the rural areas and the resulting consequences of sub-division and fragmentation of land, added to this the problem of drought due to erratic rainfall, deforestation, soil erosion and lack of portfolio diversification for livelihood strategies exacerbate the problem of food insecurity and poverty in many rural parts of Ethiopia (Gebre, 2005). The study area is in one of the areas severely affected by drought in the Sidama Zone. Land fragmentation, loss of soil fertility, limited access to safe drinking water, and droughts are the factors that make the population of the area susceptible to food insecurity and poverty. Most parts of the district are predominantly food insecure due to the reliance on irregular rainfall. This research work, therefore, tends to investigate the livelihood strategies and its challenges of rural farmers, and their willingness to expand their successful practices. This study provides the baseline information that will help to initiate further research work. Therefore, I seek to analyze the determinants of rural livelihood diversification based on evidence gathered from Hawassa Zuria District, Sidama Zone, Ethiopia.
Aim and objectives of the study
This research aim to examine factors affecting the livelihood diversification strategies and the extent to which these livelihood diversification strategies contribute to the household food security.
Specific objectives
(i) To identify the various types of livelihood diversification strategies in the study area.
(ii) To examine factors affecting livelihood diversification strategies of the households.
(iii) To analyze the extent to which livelihood diversification contributes to household food security.
MATERIALS AND METHODS
Description of the study area
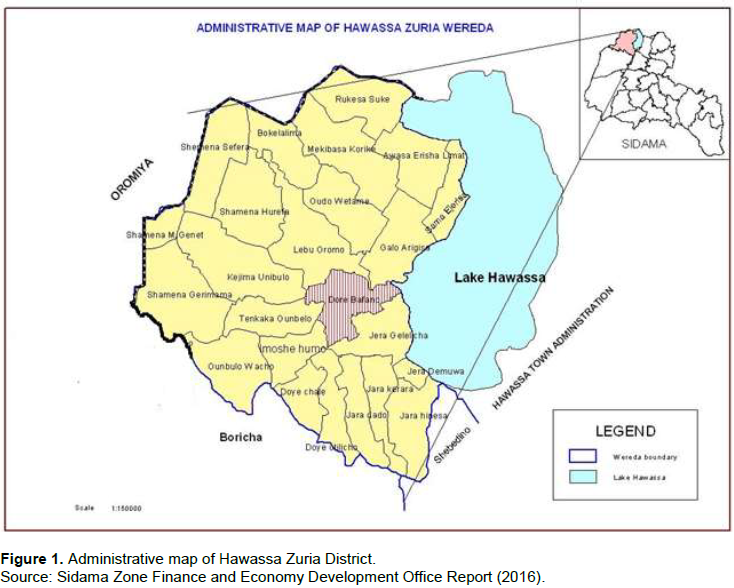
This study was carried out in Hawassa Zuria District which is one of the 19 rural Districts in Sidama Zone of SNNPR (Figure 1). The study area is located at about 298 km south of Addis Ababa. It is bounded by Oromiya in the north and west, Lake Hawassa in the east and Tula Sub-city of Hawassa Town Administration and Shebedino District of Sidama Zone in the south east and Hawassa Zuria District of the Sidama Zone in the south. The District is divided into 23 rural and 3 urban Peasant Association and covers a total area of 245.15 km2. From rural 23 Peasant Association, 18 are found in kolla and 5 in woina dega agro- ecological Zone respectively. Out of this population, 68,395 were men and 67,223 were women. The average population density is estimated to be 553.2 persons per square kilometer. This indicates that the District is one of the most densely populated Districts in the zone (Sidama Zonal Finance and Economic Development report, 2016). Of the total population, more than 97% were estimated to live in rural areas.
Sample size and sampling technique
A multi-stage sampling technique was used to select District, Peasant Association and respondents for the study. Hawassa Zuria District was selected because of the greater number of people who are food insecure and on local knowledge derived from personal experience. In the first stage, the Kebels in the District was stratified into lowland (Kolla) having 18 Peasant Associations and mid-altitude (Woina Dega) having 5 Peasant Associations. In the second stage, four Peasant Association (three from Kolla and one from Woina Dega stratum respectively) were selected by using simple random sampling technique to represent each stratum. In this study, households were the major units of analysis. Therefore, the population of the study comprised the total households of the randomly selected Peasant Association. In the third stage, households were selected by using systematic sampling techniques from the sampling frame which is a complete list of households in the four Peasant Association obtained from the District Administration, Office of Finance and Economic Development and Peasant Association offices. The sample size was determined using the formula suggested by Israel (1992) as follows:
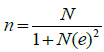
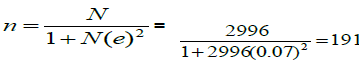
Where n is the sample size, N is the population size, and e is the level of precision or the sampling error (0.07). Using the total number of households of 2996 of the study area, the total sample size is determined as:
The probability proportional to size sampling technique was employed to decide the sample size for each Peasant Association. In addition to this, to increase reliability of data, focus group discussions (FGD) were carried out in each Peasant Association with 10 to 15 participants taking into consideration community leaders, elders, religious leaders, women and youth to take care of heterogeneity and specific experience on the issue. Key informant interview was held with 15 knowledgeable key informants, which include Peasant Association administrators, Development Agents (DAs), health extension workers, District administrator, and heads of relevant District offices to supplement the household survey data.
Econometric model
The ordered logistic regression technique is used when the dependent variable is ordered categorical, in which case the events of dependent variable is ordered. In this study, the dependent variable is livelihood diversification, which includes income sources from both on farm and nonfarm activities; and it is categorized as follows:
a) No diversification (y1 =1 livelihood sources),
b) Two diversifications (y2 = 2 livelihood sources),
c) Three and more diversifications (y3 = 3 and more livelihood sources).
For more than one independent variable, that is for K independent variables (X1, X2, …… Xk), the ordered logit model can be written as:
Derivation of the ordered logit model can be performed as follows:
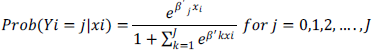
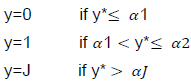
Let y be an ordered response taking on the values {0, 1, 2. . . J} for some known integer J. The ordered logit model for y (conditional on explanatory variables x) can be derived from a latent variable model. Assume that a latent variable y* is determined by

Where is KX1 and, for reasons to be seen, x does not contain a constant. Let
 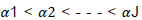 be unknown cut points (or threshold parameters), and define
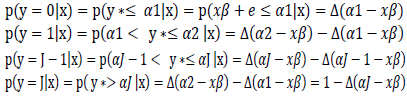
Given the standard normal assumption for e, it is straightforward to derive the conditional distribution of y given x; we simply compute each response probability:
The parameters a and B can be estimated by maximum likelihood procedures. For each i, the log-likelihood function is
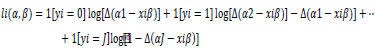
This log-likelihood function is well behaved, and many statistical packages routinely estimate ordered logit model.
Xi = X1, X2, X3…………….. Xn : are the independent variables used in the model.
Bi = B1, B2, B3……………… Bn : are the regression coefficients indicating the magnitude of change (increased or decreased participation livelihood ) in the independent variable.
By following Gujarat (2004) and Greene (2003), from the likelihood function decomposition of marginal effects was proposed as follows for ordered logit model: The marginal effects of the dependent variable can be estimated as:
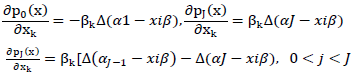
The odds ratio Zi is the factor by which the odds change when ith independent variable increases by one unit. If coefficient is positive, this factor will be greater than one, which means that the odds are increased with increase in livelihood diversification. If coefficient is negative, the factor will be less than one, which means that, the odds are decreased (decreased participation of livelihood diversification opportunity); when β is zero, the factor equals one which levels the odds unchanged.
RESULTS AND DISCUSSION
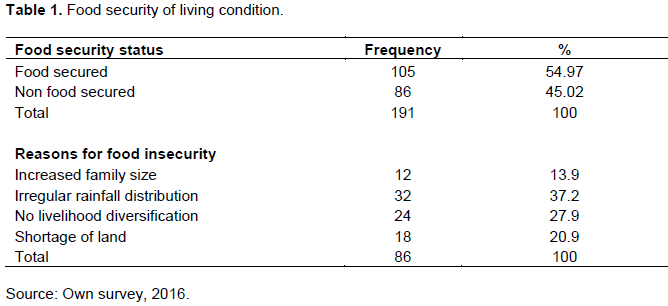
The household food accessibility index was measured using household calorie acquisition method. Household food accessibility index was computed through the analysis of quantitative data collected on food consumption pattern of the households. The amount and type of food consumed per household per week converted into amount of energy in kcl consumed per Adult Equivalent (AE) per household per day. The study revealed that out of the total sample households, about 55 % were food secured and the remaining 45% were not food secured. Of the reported reasons for food insecurity, irregular rainfall distribution accounted for 37.2, having no livelihood diversification accounted for 27.9; shortage of land accounted for 20.9 and increased family size accounted for 13.9 % (Table 1).
Livelihood diversification from on farm income sources
Use of diversified income sources provides to build better livelihood outcomes and well-beings. Rural household life is mainly based on agricultural production but agriculture in the country is dependent on climatic situations, and a risky activity. Thus, according to the findings of Abduselam (2011) using technological inputs against risks of agriculture and diversifying both on-farm and non-farm income sources are vital to promote total annual income of HHs; thus to increase national production.
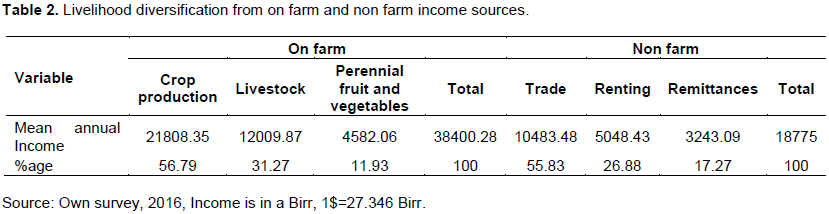
Accordingly, 56.79% income earned from crop production, 31.27% from livestock and 11.93% income earned from vegetable and fruit production (Table 2). This implied that, crop production is still taking the higher share of on-farm production. Based on respondents’ engagement, annual income earned from livestock sector indicated higher than vegetable and fruit production. As reported by FGD participants, livestock were mainly used as saving in the form of live bank rather than using as annual income source. Furthermore, they were considered as a means of saving and insurance for various risks of crop production. Vegetable and fruit production, as well as earning income from this activity started new and it requires water accessibility. That was why the annual income earned is lower.
Livelihood diversification from non farm income sources
Non-farm activities was performed to generate additional income and to minimize the probable risk of on-farm activities. Farm households of the study area were found to engage mainly in small business and renting of houses and animal power. Thus, out of the overall annual income earned, non-farm contributed 18775 Birr income. Of which, 17.27% was earned from remittances, 55.83% income earned from trade and 26.88% income earned from renting (Table 2). Even though there were respondents, who earned income from both trade and renting of houses and animal power, prioritization was made on the basis of the amount of income earned from the two activities. That means, higher income provide income source, which gets priority to be selected as a major income source of each respondent. Hence, most respondents perform small business to maximize their income level.
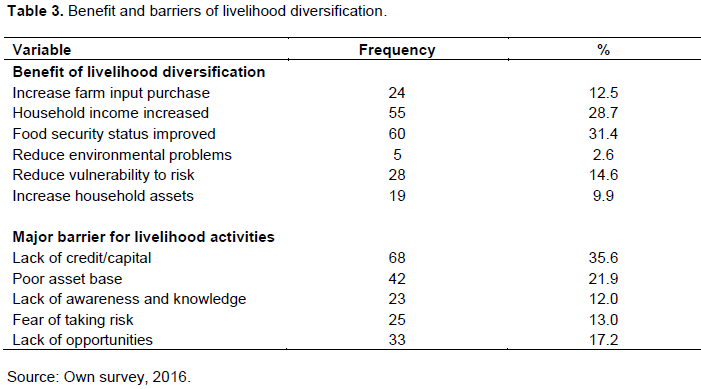
Benefit and barriers of livelihood diversification
Of the total respondents, 31.4, 28.7, 14.6, 12.5, 9.9 and 2.6% of households found, benefit from livelihood diversification with the indicators of the households' food security status improvement, income increase, vulnerability to risk reduction, increase farm input, purchase assets increase and environmental problems reduction respectively (Table 3). This result is similar to DFID (1999) who argue that improved livelihood increases well-being, help to earn more income, reduce vulnerability, and improve food security and sustainable use of natural resources. As indicated in Table 2, the result of the study revealed that lack of working capital is the major constraint in accessing off-farm activities (Table 3). As shown in Table 3, 35.6, 21.9, 17.2, 13, and 12% of households reported that lack of credit and capital, poor asset base, lack of opportunities, fear of taking risk and lack of knowledge and awareness respectively are the major barriers for households that could impede households’ participation in livelihood activities.
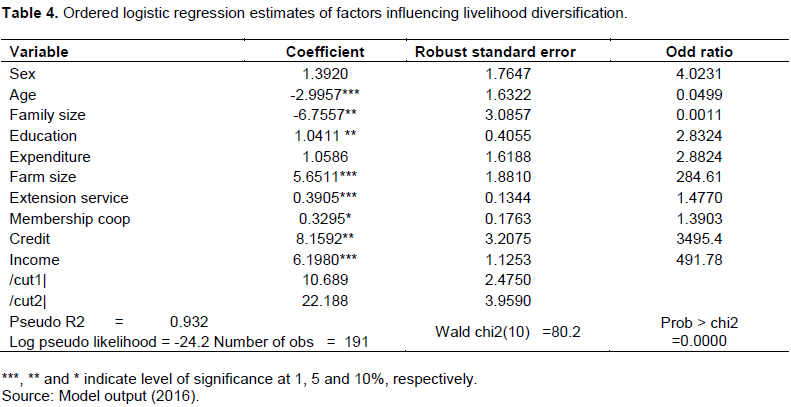
Analytical analysis
This section presents the results from the logistic regression model aimed at determining the likely effects of key selected explanatory variables on livelihood diversification. The ordered Logit Regression model showed that eight out of ten variables were statistically significant (P<0.05) and influenced livelihood diversification.
Age of households had a negative effect on livelihood diversification. Youth became a significant predictor of livelihood diversification. This is the proportional odds ratio for a one-year increase in age on livelihood diversification level, given that the other variables in the model are held constant. Thus, for a one-year increase in age, the odds of three and more diversifications versus the combined two diversifications and no diversi-fication categories are 0.04 times lesser, given the other variables are held constant in the model. Likewise, for a one year increase in age, the odds of the combined three and more diversifications and two diversifications versus no diversification are 0.04 times lesser, given the other variables are held constant. Thus, a one-year increase in age would result in a 2.995 unit decrease in the ordered log-odds of being in a three or more diversification categories, while the other variables in the model are held constant.
As the ordered logistic regression result indicated, family size and livelihood diversification are negatively related. The family size had the odds ratio (eβ=0.0011); indicating that for every increase in family size, the odds of three and more diversifications versus the combined two diversifications and no diversification categories are 0.001 times lesser, given the other variables are held constant in the model. Likewise, for an increase (by one) in family size, the odds of the combined three and more diversifications and two diversifications versus no diversification are 0.001 times lesser, given the other variables are held constant. In other ways, any increment in family size would result in a 6.755 unit decrease in the ordered log-odds of being in a three or more diversification category, while the other variables in the model are held constant. According to the results of ordered logit model, households with small family size could more readily participate in livelihood diversification. Such parents are able to provide enough land and other agricultural input resources for their children to engage in livelihood diversification, so youths are motivated to participate in livelihood diversification opportunity to fulfill their livelihood needs.
Education is also one of the factors affecting rural youth participation in livelihood diversification in the study area. The result of education level of the respondents is not different from what was assumed to have positive sign. Education of households had the odds ratio (eβ=2.83) indicating that for a one level increase in education, the odds of three and more diversifications versus the combined two diversifications and no diversification categories are 2.83 times greater, given the other variables are held constant in the model. Likewise, for a one level increase in education, the odds of the combined three and more diversifications and two diversifications versus no diversification are 2.83 times greater, given the other variables are held constant. In other ways, a one level increase in education would result in a 1.04 unit increase in the ordered log-odds of being in a three or more diversification category while the other variables in the model are held constant. Those households who have a higher level of education would have a higher tendency to participate in livelihood diversification.
Result of the ordered logit regression indicated, access to agricultural land for rural households also found to have a positive effect on the participation in livelihood diversification. Farm size is significant (P<0.01) and has direct association with in livelihood diversification (β= 5.651). The farm size of parents had the odds ratio (eβ=284.61) indicating that for a one hectare increase in farm size, the odds of three and more diversifications versus the combined two diversifications and no diversification categories are 284.61 times greater, given the other variables are held constant in the model. In other ways, a one-hectare increase in farm size would result in a 5.651 unit increase in the ordered log-odds of being in a three or more diversification category while the other variables in the model are held constant. This implies that those households who have access to farmland would participate in livelihood diversification more likely than those who have no access to agricultural land.
Households who have better access to extension services could have willing to participate in livelihood diversification than their counterparts. In the ordered logit regression model utilization of extension services is statistically significant (P<0.01) and shows a positive relationship with participation in livelihood diversification (β= 0.3905). The odds ratio for participation in extension service is 1.477 shows that, for households who got access to an extension service, the odds of three and more diversifications versus the combined two diversifications and no diversifications are 1.477 times greater than for counterparts, given the other variables are held constant. In other words, those who get extension service adequately have a greater probability to participate in livelihood diversification.
Membership of cooperatives was found to be positively related and but not significantly (P<0.10) affecting livelihood diversification in the study area. Farmers` organizations played an important role in organizing members into input cooperatives and in creating access to inputs. Ratio estimate of comparing effects of being membership to cooperatives on expected participation in livelihood diversification, given the other variables are held this ordered odds constant in the model. The odds ratio for having membership of cooperatives is 1.3903 shows that, for households who are members of cooperatives, the odds of three and more diversi-fications versus the combined two diversifications and no diversifications are 1.3903 times greater than their counterparts, given the other variables are held constant. Meaning, those households who became members of cooperatives show a greater probability to participate in livelihood diversification.
Households who have better access to credit are more likely to participate in livelihood diversification than their counterparts. In the ordered logit regression model utilization of credit is statistically significant (P<0.05) and there is a positive relationship with participation in livelihood diversification (β=8.1592). Accordingly, odds ratio for participation in extension service is 3495.4 shows that, for households who got credit service, the odds of three and more diversifications versus the combined two diversifications and no diversifications are 3495.4 times greater than for counterparts, given the other variables are held constant. In other words, those who get credit service adequately have a greater probability to participate in livelihood diversification.
Income of households is one of the factors motivating participation in livelihood diversification. Those households who get more income can fulfill their financial requirements for inputs and found to participate more in livelihood diversification. Income of households had the odds ratio (eβ=491.78) indicating that for a one unit increase in income, the odds of three and more diversifications versus the combined two diversifications and no diversification categories are 491.78 times greater, given the other variables are held constant in the model. Likewise, for a one unit increase in income, the odds of the combined three and more diversifications and two diversifications versus no diversification are 491.78 times greater, given the other variables are held constant (Table 4).
CONCLUSION
The study employed observational, descriptive as well as cross sectional survey design with quantitative and qualitative methods. The result of the study indicates that 56.1% of households had diversified their activities into multiple livelihood activities, while 43.9% did not diversify livelihood activities, which means non-diversified livelihood activities of households have relied on one livelihood activity to lead healthy and productive lives. In general, diversification of livelihoods has been found to be very limited among rural households in Hawassa Zuria District. The result of ordered logit model shows that education level of household-head, land size of household, annual income of household head, membership of households in the organization, credit utilization, and access of extension service significantly determine the livelihood diversification of household in the study area; while age and family size of households were found to be negative statistically significant and related to household level of livelihood diversification. Similarly, as the level of livelihood sources or livelihood activities increases, the food security of households is improved.
CONFLICT OF INTERESTS
The author has not declared any conflict of interests.
ACKNOWLEDGEMENTS
The author is grateful to Hawassa University for providing financial support and the Agriculture and Rural Development Offices for providing data and information that were necessary for undertaking this study.
RECOMMENDATIONS
(i) Stakeholders should motivate farm households to engage in multiple livelihood sources because this would solve household income shortfall and critical land constraints in the area.
(ii) Government should critically design situation fitting non-farm strategies that supplement farm income because land size owned by farm household regardless of its fertility level is considered as one of the key determinants of livelihood diversification.
(iii) Government should intensify its role in the country’s educational system particularly in basic and vocational education to provide in rural areas.
(iv) Strengthening rural organizations, helps not only to preserve the values of a particular society but also to facilitate livelihood diversification and hence improve food security.
(v) It is strongly recommended that credit facilities should be improved and made easily accessible for households.
REFERENCES
|
Abduselam M (2011). Diversification of Livelihood Activities as a Strategy to Promote Household Food Security: A Case Study of Daro Lebu Woreda of West Hararghe, Oromia Regional State, Ethiopia. Thesis. Addis Abeba University, Ethiopia. |
|
|
Alderman H (2000). Price and Tax Subsidization: Draft for HNDSD Primer on Safety Nets, Module 7. World Bank, Washington D.C. |
|
|
Asmamaw E (2004). Understanding Poverty: The Ethiopian Context a Paper presented at The Gambia AAPAM Roundtable Conference, Banjul, The Gambia, April 19 - 23, 2004. |
|
|
Devereux S, Amdissa T, Sabates-Wheeler R (2005). Too Much Inequality or TooLittle? Inequality and Stagnation in Ethiopian Agriculture, IDS Bulletin 36:2. |
|
|
Department for International Development (DFID) (1999). Sustainable Livelihoods Guidance Sheets. UK Department for International Development. London. |
|
|
Ethiopian Economic Association (EEA) (2005). Transformation of the Ethiopian Agriculture: Potentials, Constraints and Suggested Intervention Measures. Report on the Ethiopian Economy, Volume 4 2004/05. |
|
|
Ellis F (2000). The Determinants of Rural Livelihood Diversification in Developing Countries. New York, NY: Oxford University Press. 51(2):289-302. |
|
|
Food and Agricultural Organization (FAO) (2012). The State of Food Insecurity in the World. |
|
|
Greene WH (2003). Econometric Analysis. 5th Ed. Pearson Education Inc.Upper Saddle River, New Jersey 827p. |
|
|
Haan N, Devereaux S, Maxwell D (2012). Global implications of Somalia 2011 for famine prevention, mitigation and response. Global Food Security 1(1):74-79. |
|
|
Israel GD (1992). Determining Sample Size. PEOD6, IFAS Extension, University of Florida. |
|
|
Karen B, Segiy Z, Amy G, Aparajita G (2013). Agriculture Sector as a Sector of Opportunity for Young in Africa. The World Bank Sustainable Development Nework agriculture and Environmental Services Department. Policy Research working Paper 6473, 12:67-87. |
|
|
Sidama Zone Finance and Economy Development Office Report (2016). Hawassa, Ethiopia. |
|
Copyright © 2024 Author(s) retain the copyright of this article.
This article is published under the terms of the Creative Commons Attribution License 4.0


