ABSTRACT
Reducing poverty and improving household food security remains an important policy objective for rural development in the semi-arid areas of many countries in Africa. Many development programs have been introduced in efforts to bring the cycle of poverty and food insecurity to an end. This paper investigates the impact of a food security package (FSP) program in improving rural household’s food consumption in Tigray region, Northern Ethiopia. An empirical analysis based on a propensity score matching (PSM) method, which is a popular approach to estimate causal treatment effects, is employed. Using kernel-matching estimation technique, program beneficiaries were matched with non-beneficiaries. The results show that the program has had a significant effect on improving household food calorie intake. The findings indicated that the program raised the food calorie intake of beneficiary households by 41.8% above that of individuals not involved in the program. Sensitivity analysis also indicated that the observed estimate of impact is not vulnerable to hidden bias or selection on unobservables.
Key words: Propensity score, matching, selectivity bias, average treatment effect, impact, evaluation.
It is increasingly being recognised that improving food security is a basis for reducing poverty and hunger, but also for economic development. Despite notable progress in economic growth and welfare improvement in developing countries over the recent decades, food security has not been attained in most developing countries. In particular, food insecurity continues to form a deep seated problem in several sub-Saharan African (SSA) countries. A recent Food and Agriculture Organization of the United Nations (FAO) report indicates that the number of undernourished people in Africa still remain high at 226.7 million (FAO, 2014). Even now, countries in the Horn of African are overwhelmed by heightened food security crises, making the problem of food security an issue of great concern to governments and the international community.
Like other SSA countries, Ethiopia is one of the least developed countries in the world according to all measures of poverty. Despite the country has made progress in economic growth over recent decade, food insecurity is still evident. The 2012-2014 FAO assessment report estimated 32.9 million of the Ethiopian people are undernourished, indicating food shortage as an on-going problem in the country (FAO, 2014). The country’s food production is highly vulnerable to the influence of adverse weather conditions as the agricultural sector is totally dependent on rainfall. Previous studies reported that a 10% decline in the amount of rainfall below the long-term average leads to a 4.4% reduction in the country’s national food production (Webb et al., 1992). Furthermore, drought has increasingly occurred over the recent decades, as has the proportion of the population adversely affected by it. Consequently, the country has been dependent on food aid to bridge its huge food gap. Devereux (2006) reported that, even in a year where rainfall is favourable, around 4 to 5 million Ethiopians depend on food aid, reflecting how deep-rooted food insecurity is in the country.
The causes of food insecurity problems in Ethiopia are complex and interrelated. Lack of governance and misdirected economic policies during the military regime (1974-1991), unfavourable weather fluctuations, high dependency on rainfed agriculture, and failure to bring about economic transformation have all contributed negatively to the country’s agricultural performance in past decades (Gebremedhin, 2006). Declining soil fertility, land degradation, and shrinking landholding due to population pressure had contributed to the deterioration food production. These and other factors are responsible for the country’s struggle to ensure food security.
Hence, ensuring food security is one of the top national priorities and forms the cornerstone of the sustainable economic growth and poverty reduction strategy in Ethiopia. To this effect, the current government has embarked in November, 2002 an aggressive economic reform program. Policies that tackle food insecurity at household level are seen as the most effective way to reduce poverty. The integrated household food security package (FSP) program is among the programs introduced for this purpose. The program aims to secure food at household level by diversifying the income base of the poor through provision of credit for a range of activities. Large amounts of money and effort have been spent by the government and multi-lateral development bodies to reduce the problems of widespread rural food insecurity and thus improve people's access to food. However, program implementation is not an end in itself. The question of how the FSP program affects the targeted beneficiaries should be evaluated after a certain period of time to investigate whether the program actually contributed to household’s food security.
Despite the FSP program has been implemented in Tigray, Northern Ethiopia, over the recent decade, to our knowledge no attempts has ever been made to systematically evaluate its impacts on household food consumption. Abebaw et al. (2010) studied the impact of food security program on household food consumption in two villages of the Amhara region in the North-western part of Ethiopia using propensity-score matching. However, Abebaw et al. (2010) only provided the average impact of the food security program but did not attempt to analyse the sensitivity of their estimated impact to selection bias. In practice, there may be unobserved variables that simultaneously affect the outcome, and the assignment into program beneficiary. In such circumstances, a ‘hidden bias’ may influence the robustness of the matching estimators (Rosenbaum, 2002). As Ichino et al. (2006) have suggested, the presentation of matching estimates should therefore be accompanied by sensitivity analysis since propensity-score matching cannot fully account for selection bias. This apparent limitation of Abebaw et al. (2010) provides us with the starting point of this article.
The main objective of this paper is to evaluate the impact of the FSP program upon improving rural household food consumption in Tigray using a propensity score matching (PSM) method. We build up our research on the works of Abebaw et al. (2010). In this paper, we adopt the definition of food security by Siamwalla and Valdes (1980) that is, the ability of households to meet target levels of consumption on a yearly basis.
The household food secirty package program (FSP)
Tigray is one of the most drought-prone areas of Ethiopia, and faces recurrent droughts and food shortages. Most smallholder farmers face sizeable food deficits every year and are vulnerable to recurrent drought shocks. Poverty reduction and ensuring food security is Tigray’s most significant development challenges.
The household oriented extension package program known as the integrated household FSP was launched in 2002 (Desta et al., 2006). This program was developed within the framework of the federal government’s overall development policy and food security strategy, but addresses the specific and complex problems and causes of food insecurity that plague the region. To this end, a twin-track strategy was employed with target beneficiaries to redress short-term food deficits, while building up sufficient self-help capacity to allow the rural population to attain self-reliant food security in the long term (TFSPC, 2005).
Accordingly, the FSP program has been widely introduced in Tigray. The intention of the program is to secure food at household level by diversifying the income base of the poor through provision of credit for a range of activities in a package. It also provides income transfers through public works. To this end, identifying the basic abilities of the poor and providing the required financial resource, technical assistance and training to engage in their choice of activities is the prime concern of the program.
The selection process of a household into the program is clearly defined in the Productive safety net program implementation manual. In each village (locally called tabia), beneficiary households were first selected by the local administration (food security task force) based on pre-defined criteria (TFSPC, 2005). Local communities also have discretion to identify food-insecure households based on local knowledge (Coll-Black et al., 2011). Poverty status as expressed by the household’s livestock (households without cows and oxen were given priority), land holding size and quality, and severity of food insecurity are the main criteria for selecting households into the program (TFSPC, 2005). After a household is selected for the program, financial support as a loan for a range of activities is provided as a package. Households thus participate in one or more program activities, including vegetable and fruit production, livestock production (oxen and cows), small animals (sheep and goats), poultry, and beehives (Nega, 2008).
The FSP program was thus expected to address the rural household’s risks of not having access to sufficient food through increasing food production and promoting employment. Provision of credit to the poor is expected to stabilize consumption and promote self-employment in off-farm activities. The program was also expected to increase household’s livestock ownership and provide access to draft power that has been the long-time constraint of the agrarian society in Tigray region (TFSPC, 2005; Nega, 2008).
The study area
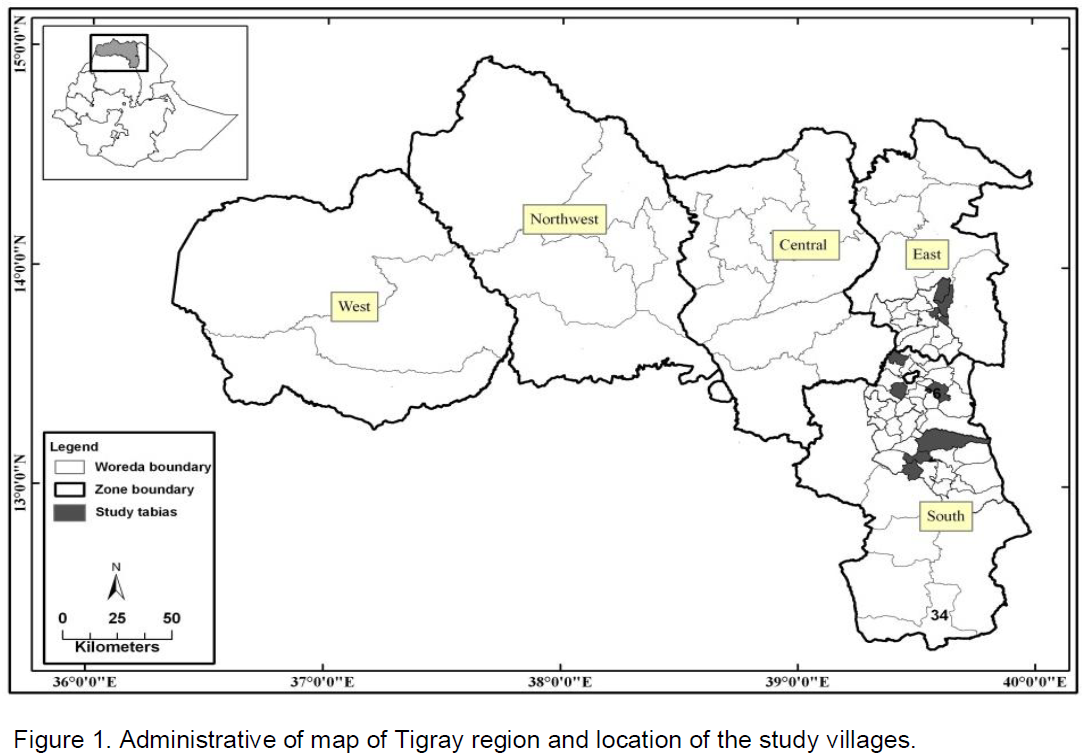
Tigray is one of the regional States of Ethiopia and is located in the northern part of the country, covering a total area of 53,000 km2. Geographically, it lies between latitudes 12°15’ N and 14°57’ N, and longitudes 36°27’ E and 39°59’ E (Figure 1). In the year 2007 the region had a population of 4.4 million with a population growth rate of 2.5% per annum (CSA, 2008). The climate of the region is characterized by large spatial variations in rainfall. The mean annual monsoon rainfall of the region is estimated to be 473 mm, representing 84% of the annual rainfall in the region (Gebrehiwot et al., 2011).
Tigray mainly relies on rainfed agriculture. The tremendous importance of this sector to the regional economy can be gauged by the fact that it directly supports about 82% of the population in terms of employment and livelihood.
Data sources and variable definitions
The data for the study was derived from a household survey conducted in three rural districts from January to February, 2011, and included 400 farm households randomly drawn from 9 villages. A three-stage sampling techniques was employed to draw the samples. Three districts were first chosen: two districts (Enderta and Kilte Awelaelo) from the FSP program areas and one (Hintalo Wajirat) from the non-FSP districts. Second, 4 villages from the program area were purposively chosen. Five comparable non- program villages from Hinatlo Wajirat districts were chosen based on their similarity in social, economic and agro-climatic characteristics with the program villages. Finally, random sampling was employed to draw a total sample size of 189 and 211 farm households from the program and non-program villages, respectively.
To generate the data, a structured household questionnaire was administered, with a household defined as a group of people in a housing unit living together as a family and sharing the same kitchen. The survey captured information related to demographic characteristics, asset endowment, food consumption, economic activities, wealth and income, expenditure on food and non-food items, and access to basic infrastructures and agricultural services. The sample households were asked to report food items consumed in kind and amount, purchased or otherwise, by their families during the week preceding the survey visit. The physical quantities consumed by a household were then converted into food calories adjusted for household age and sex composition using the national food composition table compiled by the Ethiopian Health and Nutrition Research Institute (EHNRI, 2000).
Enumerators with knowledge of the local language and experience with socio-economic surveying were recruited locally, and trained based on the content of the questionnaire. Prior to the actual fieldwork, the questionnaire was pre-tested. During the survey field work, close and regular supervision was made.
The food security outcome indicator
Determining the food security status of households can help public officials and policy makers to evaluate the effectiveness of existing programs. However, as with other social programs, identifying and quantifying the causal effect of a program on household food security is not straightforward (Abebaw et al., 2010). Identifying an appropriate food security indicator is thus a difficult issue as not all characteristics of food security can be captured by any single outcome indicator (Maxwell et al., 1999; Hendriks, 2005).
Maxwell and Frankenberger (1992) reported 25 broadly defined indicators. In the work by Maxwell and Frankenberger, a distinction is made between process indicators describing food supply and outcome indicators describing adequate food consumption and food access. Chung et al. (1997) found that there is little correlation between a very large set of process indicators and measures of food security outcomes. von Braun et al. (1990) described outcome indicators as proxies for adequate food consumption measured directly as food expenditure and caloric consumption.
Similarly, different organisations and government agencies use different food security indicators depending on their primary objectives. Per capita food intake per day in kilocalories is used as the indicator for food security for regional and global assessments. For example, according to FAO (2003), at national level a per capita food intake of less than 2,200 kcal/day is taken as indicative of a very poor level of food security. The most common methods of poverty measurement have also used the nutritional norm and defined a poverty line in terms of minimum calorie requirements (Greer and Thorbecke, 1986; Ahmed et al., 1991; Ravallion and Bidani, 1994). Swindale and Ohri-Vachaspat (2005) also reported that the percentage of minimum daily food calorie requirements consumed provides a good indication of overall household food security.
For this study, food calorie intake which is one of the most direct indicators related to food security and nutritional security (Hoddinott and Skoufias, 2004; Gilligan and Hoddinott, 2007) was considered as an outcome indicator to measure the impact of FSP program. In Ethiopia, food poverty is defined in terms of food calorie intake (MoFED, 2006). This implies that this indicator has direct relevance to local conditions and the food security context, which is identified as one of the criteria by Davies et al. (1991). As is also reported by Baker (2000), establishing measurable indicators that correspond directly to planned interventions is a key step in social program impact evaluation.
Empirical approach
A valid measure of the impact of a household FSP would be to compare the outcomes in households receiving FSP benefits with the presumed outcomes that had the same households and not received any benefits. Assessing the impact of any intervention thus requires making an inference about the outcome that would have been observed had the program participants not participated. Following Heckman et al. (1997) and Smith and Todd (2001), let Y1 be the mean of the outcome conditional on participation, that is, membership of the treatment group, and let Y0 be the outcome conditional on non-participation, that is, membership of the control group. The impact of participation in the program is the change in the mean outcome caused by participating in the program, which is given by:
Where is the notation for the impact for a given household.
The fundamental problem of evaluating this individual treatment effect arises because for each household, only one of the potential outcomes either Y1 or Y0 can be observed, but Y1 and Y0 can never be observed for the same household simultaneously. This leads to a missing-data problem, which is the heart of the evaluation problem (Smith and Todd, 2005). The unobservable component in Equation 1, be it Y1 or Y0, is called the counterfactual outcome. Measuring impact as the difference in mean outcome between all households involved in the FSP and those not involved may thus give a biased estimate of program impact. Since there will never be an opportunity to estimate individual treatment effects in Equation 1 directly, one has to concentrate on sample averages for the impacts of a treatment.
Average impact of the treatment on the treated (ATT), which focuses explicitly on the effect on those for whom the program is actually introduced, is the most commonly used evaluation parameter. In random program assignment, the expected value of ATT is defined as the difference between expected outcome values with and without treatment for those who actually participated in the program (Heckman et al., 1998), which is given by:

Where is an indicator variable indicating whether a household actually received treatment or not: being equal to 1 if the household is a beneficiary of FSP and 0 otherwise. X denotes a vector of control variables. Data on program beneficiaries identify the mean outcome in the treated state E (Y1|X, Z=1). The mean outcome in the untreated E (Y0|X, Z=1) is not observed, and a proper substitute for it has to be chosen in order to estimate ATT. As noted earlier, the FSP program followed a non-random process in targeting its beneficiaries. As Gilligan and Hoddinott (2007) have noted, this gives rise to a biased estimate of program impact and the procedure in Equation 2 should not be applied in our case. Applying PSM approach is therefore the most appealing approach to estimate the impact of the program for our study.
Propensity score matching (PSM)
The majority of the literature on evaluation methodology is centred on the use of matched-comparison evaluation techniques, which are among quasi-experimental design techniques generally considered a second-best alternative to experimental design (Baker, 2000). The propensity score is defined by Rosenbaum and Rubin (1983) as the conditional probability of receiving a treatment given pre-treatment observable characteristics. Let P = Pr (Z=1| X) denote the probability of participating in the FSP program, that is, the propensity score. PSM constructs a statistical comparison group by matching observations on the FSP participants to non-participants for similar values of propensity score. PSM estimators are based on two assumptions:
i) That non-participants provide the same mean outcomes as participants would have provided had they not received the program. This reflects a major strand of evaluation literature that focuses on the estimation of treatment effects under the assumption that the treatment satisfies some form of exogeneity (Imbens, 2004). Thus, testing is important to check if a household’s characteristics within its group are similar.
ii) That households with the same Z values have a positive probability of P being both participants and non-participants [the common support assumption; Heckman et al. (1999)]:
If assumptions (i) and (ii) are both satisfied, then, after conditioning on P, the Y0 distribution observed for the matched non-participant group can be substituted for the missing Y0 distribution for participants. Under these assumptions, the ATT of the program can be estimated as:
Where the first term on the right-hand side of the last expression can be estimated from the treatment group and the second term from the mean outcomes of the matched (on P) comparison groups.
Based on Baker (2000), and Heckman et al. (1997, 1998) criterion, the PSM will provide reliable and low-bias estimates of FSP program impact because: (i) similar questionnaire was used to elicit data from beneficiaries and non-beneficiaries, (ii) the dataset came from farm households with similar socio-economic and demographic conditions as well as a similar economic environment, (iii) the propensity score was estimated by using the sample households’ observable characteristics that were relevant for both participation in the program and for the outcome variable of interest, and (iv) the dataset has a larger sample of non-beneficiaries households.
In implementing the PSM, an empirical model has to be specified to derive the propensity score. For the FSP program, we estimated the propensity score for participation in the program with a logit model using observable variables that included both determinants of participation in the program and factors that affected the outcome. Once we estimated the propensity score that appeared to capture the similarities, we used these similarities to match each beneficiary with his/her closest non-beneficiary. We performed several tests to select a preferred estimator and chose the estimator that yielded statistically identical covariate means for both groups (Caliendo and Kopeinig, 2008). Moreno-Serra (2009) indicated that a good matching estimator is expected to retain relatively larger observations for evaluating the impact of a program. We implemented a kernel-matching estimator using the PSM algorithm with the software package STATA 12 to compute the average impact of the program among FSP households based on the above indicators. Morgan and Winship (2007) argued that kernel-matching, introduced by Heckman et al. (1998) appears to be the most efficient and preferred algorithm.
Finally, the PSM approach cannot fully account for selection bias or unobservable characteristics. In practice there may be unobserved variables that simultaneously influence treatment allocation as well as potential outcomes (Becker and Caliendo, 2007). In such circumstance, a ‘hidden bias’ might arise that influence the robustness of the matching estimators (Rosenbaum, 2002). Thus, the bias due to selection on unobservables remains as its drawback. Hence, following Rosenbaum (2002) we performed sensitivity analysis to examine the vulnerability of the estimated impact to unobservables.
Conditioning variables for program participation
In PSM, it is desirable to condition the match on variables that are highly associated with the outcome variables (Heckman and Navarro-Lozano, 2004). Smith and Todd (2005) noted that there is little guidance available to researchers on how to select the set of conditioning variables used to construct the propensity score. Thus we focussed on finding a set of conditioning variables that were highly associated with program eligibility and the outcome variable. Fortunately, our data set contained a set of conditioning variables to control program participation decisions.
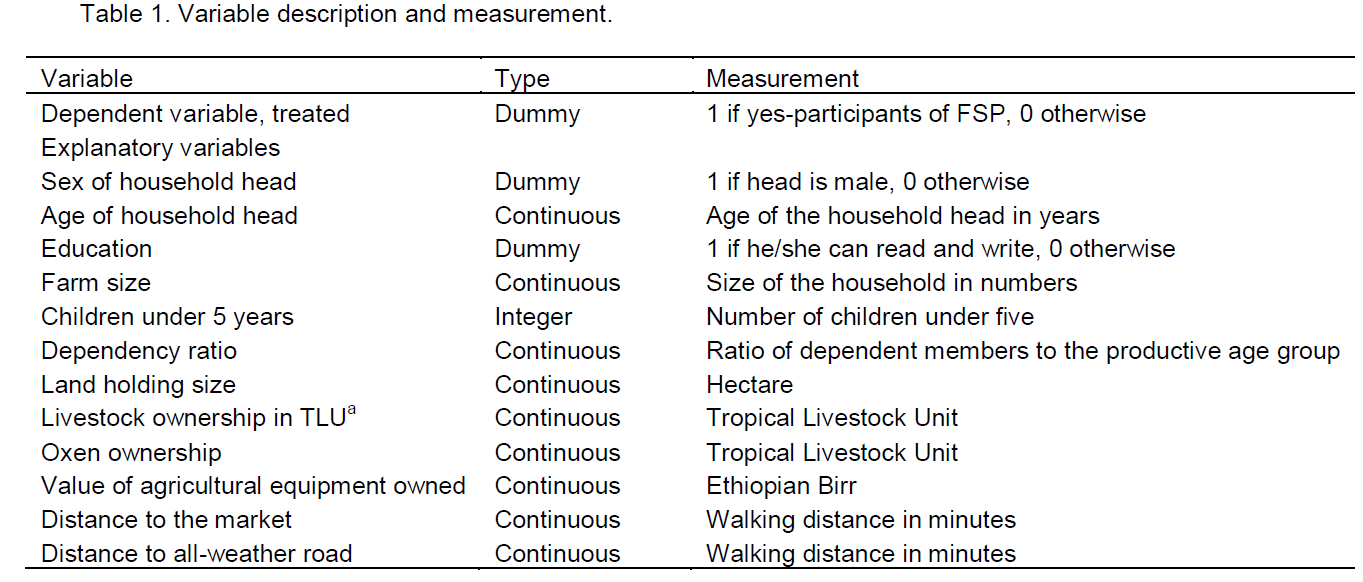
As described earlier, the FSP program is intended to serve the food insecure households. One way of judging the welfare level of rural households in the study region would be on the basis of assets owned. Hence, we included the two basic assets in the Ethiopian rural economy, land and livestock owned. Lack of these assets was associated with program eligibility. Pre-intervention demographic variables such as type of household headship, age of household head, family size, number of children under five and dependency ratio associated with program eligibility and the outcome variables were also included.
Furthermore, we included as a control variable the households’ proximity to basic physical infrastructure. With this rich set of control variables (Table 1) and relatively large and comparable sample sizes (in both the treatment and the comparison group), we could capture many of the determinants of participation typically unobservable to researchers.
Descriptive
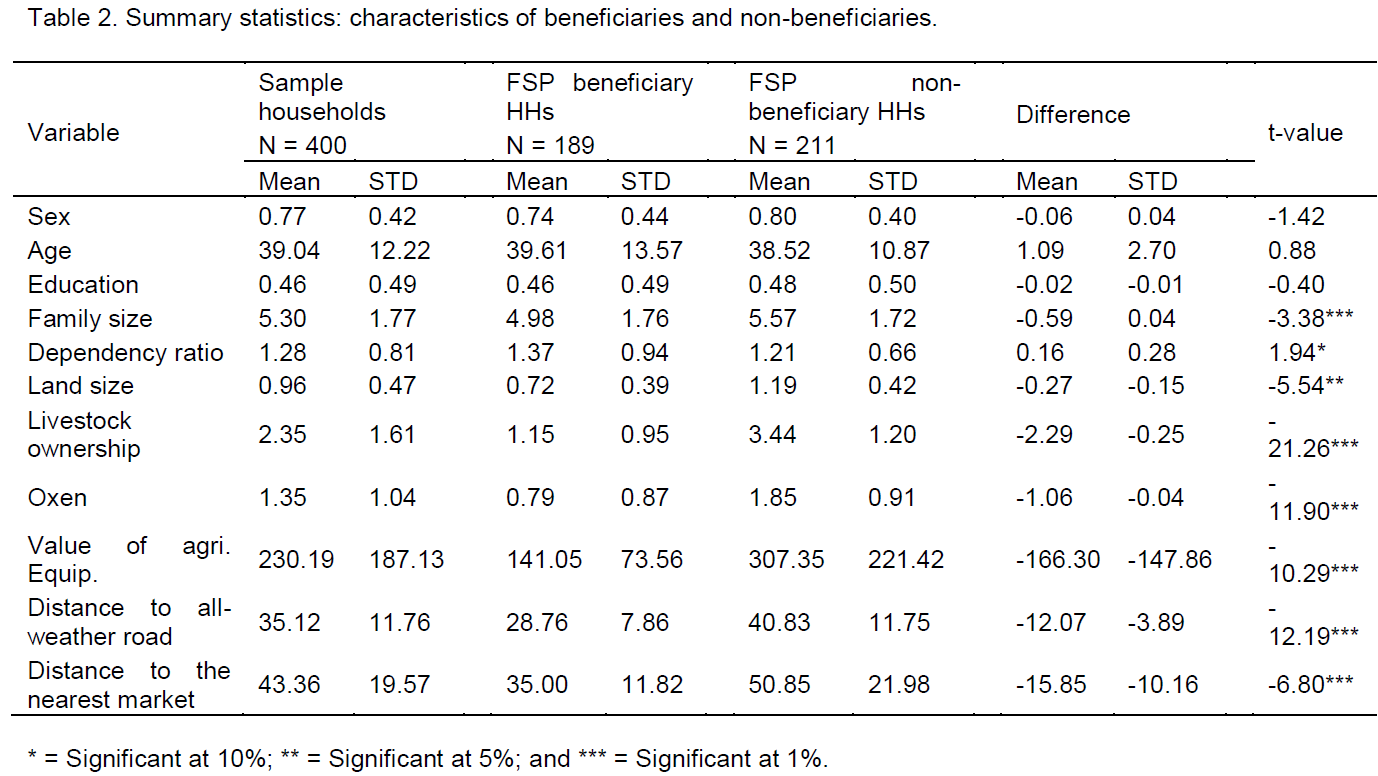
Participation in the FSP program, the dependent variables in the impact assessment analysis, takes the value of 1 if a household participates in the program and 0 otherwise. Summary statistics of FSP participants and non-participants are presented in Table 2. About 26% of the participating individuals were women. As presented in Table 2, household FSP program beneficiaries and non-beneficiary had significant differences on certain pre-intervention characteristics, which are elicited using respondents recall. The main differences between the two groups of households were in particular observed with respect to family size, dependency ratio, size of land, livestock ownership, and distance to all-weather roads and to the nearest market. As compared to non-beneficiary households, FSP program beneficiary households’ had smaller number of livestock and oxen ownership and smaller size of land.
Table 2 also clearly depicts that FSP and non-FSP households had a food calorie intake of 2512 and 1748 cal, respectively indicating that households’ in the FSP program are better off. Abebaw et al. (2010) reported similar findings.
Nonetheless, descriptive result cannot explain whether the observed difference in calorie intake between the two groups of household is due to FSP program or other exogenous factors. Indeed identification of a casual effect cannot be made before accounting for the effects of confounding factors.
Propensity score estimate
Prior to non-parametrically estimating the impact of the scores required specification justifying that a household had been included in the FSP. Thus, we had to respect the conditional independence assumption that the covariates are exogenous and unaffected by the program. Caliendo and Kopeinig (2008) noted that the basic idea of matching is to compare a beneficiary with one or more non-beneficiaries who are similar in terms of a set of observed characteristics. This requires predicting the propensity scores for each individual using a logit or a probit model. In this study, we used a logit model to predict the probability that a household participates in the food security program; in this model, different household characteristics are included as regressors.
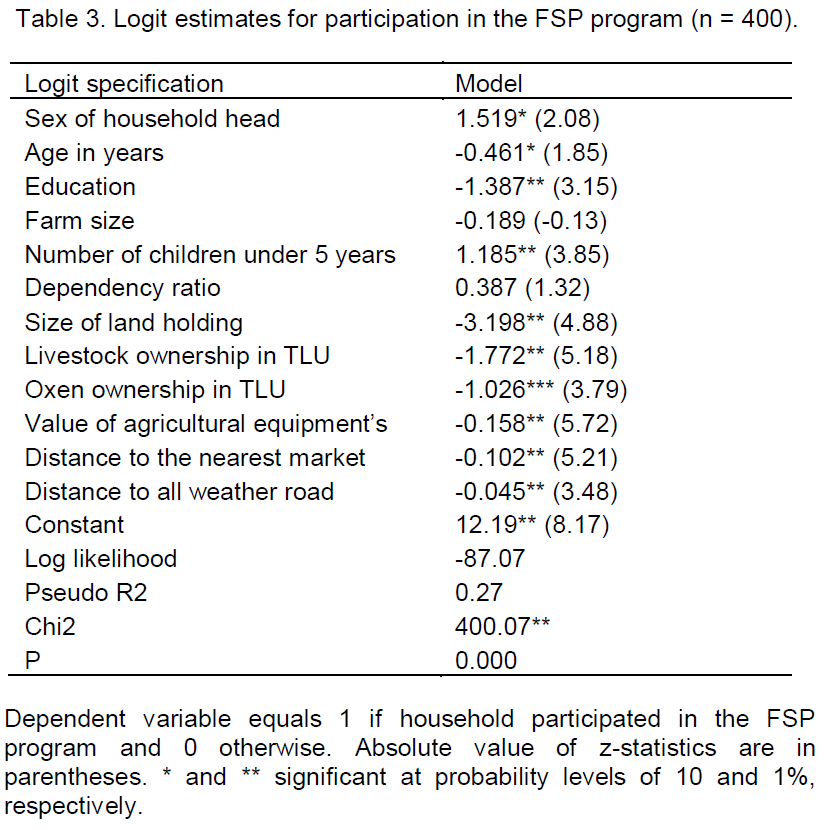
Chaouani (2010) argued that the functional form of propensity score is chosen based on the results of the logit estimation of the probability of going public. We tried various alternative specifications and chose the logit model presented in Table 3 because it seemed to be the more significant and robust specification. The ‘common support’ restriction was imposed to improve the quality of the matches and the balancing property was set and passes the balancing tests at the 95% level of statistical significance. Hence, we ensured that the mean propensity score was not different for the treatment sample and the sample of comparison observations at various levels of propensity scores. Significant coefficients in the estimated equation implied that FSP and non-FSP households were different with respect to the corresponding variable.
As indicated in Table 3, size of landholding, livestock ownership, oxen ownership and proximity to an input and output markets significantly influenced household participation in the FSP program. As expected, participation in the program was negatively and significantly influenced by the value of agricultural equipment owned. Distances to all-weather roads and to a market were also directly correlated with a household’s participation in the program.
The estimated mean propensity score using the main specification for the whole sample was 0.472 (with a standard deviation of 0.453) implying that the average probability of participating in the FSP program for all individual households was 47%.
Average impact of participation in the FSP
Using estimated propensity scores for the program from the model specification in Table 3, the impact of the integrated FSP program on household calorie intake is estimated with kernel-based matching. We also estimated the FSP impact using other matching estimators particularly the nearest neighbor (NN) matching estimator, to assess the robustness of the results. Matching with replacement was performed. The latter minimized the propensity-score distance between the matched comparison units and the treatment unit, each treatment unit being matched to the nearest comparison unit, even if a comparison unit was matched more than once. This is important in terms of bias reduction. By contrast, when matching without replacement, and with few comparison units similar to the treated units, one may be compelled to match treated units to comparison units that are quite different in terms of the estimated propensity score. This increases bias, but could improve the accuracy of the estimates (Mendola, 2007). Dehejia and Wahba (2002) have reported that the results of matching without replacement are potentially sensitive to the order in which the treatment units are matched.
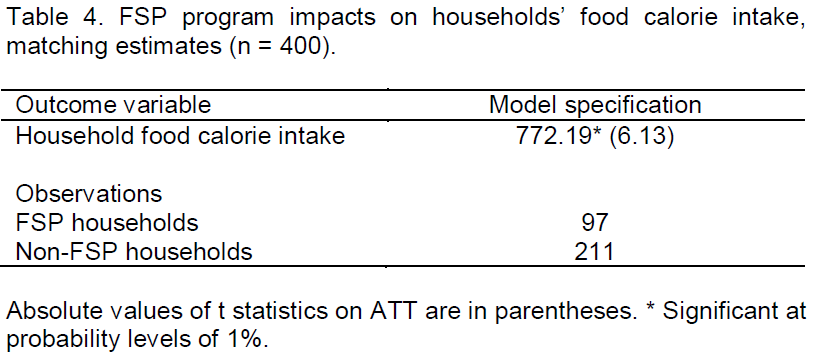
Table 4 presents estimates of the average impact of participation in the FSP. Overall, matching estimates show that the FSP program has a positive and robust effect on household food calorie intake. The findings indicate that the program improved household’s food calorie intake by 772.19 kcal/day per adult equivalent unit. This means that, if we selected someone to be in the FSP (that is, provided with access to a loan for a package of activities and training), his/her food calorie intake would on average increase to 41.8% above that of individuals not involved in the program. This suggests that the FSP program has a causal influence on total food consumption when individuals are matched according to relevant socio-demographics, assets and other covariates. In a population made up of poor households where the major income- earning asset is human labour, increased calorie intake may imply increase productivity, increased income and hence increased nutrition (Aromolaran, 2004). Nega (2008) similarly reported that the importance of the food-for-work and food security program for the chronically poor and transiently poor households in Tigray region. Abebaw et al. (2010) also found a positive impact of the FSP on household consumption in two villages of the Amhara region in the Northwest part of Ethiopia.
An explanation for this significant effect of the FSP program may be: first, the household-level FSP program is a coordinated one involving key players in the rural development of the region, in particular the Regional Bureau of Agriculture and Rural Development, the Food Security Coordination Office and the Dedebit Credit and Saving Institute - the leading locally operating micro-finance institute in Ethiopia. Second, the nature of the program provided better opportunities for the beneficiaries to engage in their choice of activities and obtain the required resources, technical assistance and training. Third, the number of development agents assigned to each village centre also increased from one to three over recent decade.
Sensitivity analysis
As indicated, the PSM approach cannot fully be controlled for unobservable characteristics. As Ichino et al. (2006) have suggested, the presentation of matching estimates should be accompanied by sensitivity analysis. Accordingly, we checked the sensitivity of the estimated treatment effects to selection on unobservables using the bounding approach developed by Rosenbaum (2002). We applied the ‘mhbounds’ procedure by Becker and Caliendo (
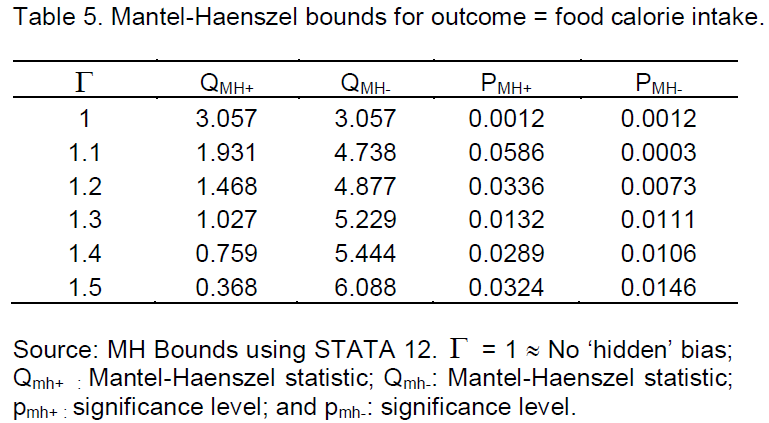
2007) in STAT programs to aid in the construction of Rosenbaum bounds for the sensitivity testing. This procedure uses the matching estimates to determine the confidence intervals of the outcome variable for different values of (gamma) captures the degree of association of an unobserved characteristic with the treatment and outcome required for it (the unobserved characteristic) to explain the observed impact (Duvendack and Palmer-Jones, 2011). DiPrete and Gangl (2004) indicated that, if the lowest , which encompasses 0, is relatively small (say < 2), then one may state that the probability of such an unobserved characteristic is relatively high and the estimated impact is therefore sensitive to the existence of unobservables.
Table 5 reports the Mantel-Haenszel (mh) bounds results, showing that under the assumption of no hidden bias, when Γ = 1, the Qmh test statistic indicates a highly significant treatment effect for improved food security program intervention on household food calorie intake. The two bounds in the Mantel-Haenszel output table (Table 5) can be interpreted in the following way: The QMH+ statistic adjusts the MH statistic downward for positive (unobserved) selection. In our case, positive selection bias occurs when those most likely to participate tend to have higher food calorie intake even without participation in the program, and given that they have the same vector of covariates as the individuals in the control group. This effect leads to an upward bias in the estimated treatment effect. The effect is significant under = 1 and becomes even more significant for increasing values of > 1 if we have underestimated the true treatment effect. The QMH+ reveals that the study is insensitive to hidden bias at the 5% significance level. The sensitivity analysis thus indicates that the observed results on the impact of food security program on households’ food calorie intakes are insensitive to selection on unobservable or hidden bias.


Reducing poverty and improving household food security is an important policy objective for rural development in the semi-arid areas of many countries in Africa. While much has been achieved in reducing rural poverty in recent years, the problem of food insecurity is still evident. It is thus pertinent to understand whether food security program contribute to household’s food security. Systematic evaluation of the FSP program is therefore necessary in order to grasp how successful implemented household food security program has been. We used a survey data of 400 rural households in the Tigray region in Northern Ethiopia to analyse the impact of the most widely implemented household FSP program. To examine the impact of the program, observed outcomes were compared with the outcomes that would have resulted had the targeted group not participated in the program. We estimated the impact of the FSP program on calorie intake using PSM as a method of estimating the counterfactual outcome for program beneficiaries. Use of PSM ensured that the program beneficiaries and the comparison group shared almost exactly the same characteristics so that selection bias could be mitigated in the sample.
The findings indicate that the FSP program had a significant effect on improving household food calorie intake of poor farm households in the region. After matching participants in the FSP program with non-participants on the basis of some socio-demographic characteristics, asset and other variables, we found that the level of food calorie intake of the FSP program participants was 41.8% higher than the intake of households not involved in the program. Sensitivity testing of the results carried out using Rosenbaum bounds indicated that the observed estimate of impact is not sensitive to hidden bias or selection on unobservables. Thus, this study appears to have the successfully captured and used variables associated with provision of the program.
We concluded that the impact of pro-poor focussed programs, and the FSP program in particular, indeed show the insight that appropriate development policies and programs have a role to play in improving food security outcomes and reducing poverty in rural areas where most of the poor live. However, like all studies, ours is not without limitations. First, our analysis is limited to cross-sectional data. This limits the observation of short and long-term fluctuations in household food consumption level, and food calorie intake in particular. Accordingly, the seasonal dimension to household food security, and particularly food calorie intake, is not considered. Second, the PSM approach cannot fully eliminate bias caused by unobserved confounders and the bias due to selection on unobservables remains as its drawback. These limitations should be kept in mind when evaluating the conclusions of our study.
The author(s) have not declared any conflict of interest
The authors would like to thank the editor and three anonymous referees for their valuable comments. We appreciate the survey households for their willingness to participate in this study. However, the authors alone are responsible for the ideas expressed in the paper.
REFERENCES
Abebaw D, Yibeltal F, Kassa B (2010). The impact of a food security program on household food consumption in Northwestern Ethiopia: A matching estimator approach. Food Policy 35:286-293.
CrossRef |
|
|
Ahmed AU, Haider AK, Sampath RK (1991). Poverty in Bangladesh: Measurement, decomposition and intertemporal comparison. J. Dev. Stud. 27(4):48-63.
CrossRef |
|
|
Aromolaran AB (2004). Household income, women's income share and food calorie intake in South Western Nigeria. Food Policy 29(5):507–530.
CrossRef |
|
|
Baker JL (2000). Evaluating the impact of development projects on poverty. A handbook for practitioners. The World Bank, Washington, DC.
CrossRef |
|
|
|
Becker SO, Caliendo M (2007). Sensitivity analysis for average treatment effects. Stata J. 7(1):71-83. |
|
|
Caliendo M, Kopeinig S (2008). Some practical guidance for the implementation of propensity score matching. J. Econ. Surv. 22(1):31-72.
CrossRef |
|
|
|
Chaouani S (2010). Using propensity score matching and estimating treatment effects: An application to the post-issue operating performance of French IPOs. Int. Res. J. Financ. Econ. 48:73-93. |
|
|
|
Chung K, Haddad L, Ramakrishna J, Riely F (1997). Identifying the food insecure: The application of mixed-method approaches in India. International Food Policy Research Institute (IFPRI), Washington, DC. |
|
|
|
Coll-Black S, Gilligan DO, Hoddinott J, Kumar N, Taffesse AL, Wiseman W (2011). Targeting Food Security Interventions When "Everyone is Poor": The Case of Ethiopia's Productive Safety Net Programme. ESSP II Working Paper 24, International Food Policy Research Institute. |
|
|
|
CSA (2008). Summary and Statistical Report of the 2007 Population and Housing Census. Federal Democratic Republic of Ethiopia, Population Census Commission, Addis Ababa, Ethiopia. |
|
|
|
Davies S, Buchanan-Smith M, Lambert R (1991). Early Warning in the Sahel and Horn of Africa: The State of the Art; a review of the literature. Institute of Development Studies, Brighton, UK. |
|
|
Dehejia RH, Wahba S (2002). Propensity score matching methods for nonexperimental causal studies. Rev. Econ. Stat. 84(1):151-161.
CrossRef |
|
|
|
Desta M, Haddis G, Ataklt S (2006). Female-headed households and livelihood Intervention in four selected Woredas in Tigray, Ethiopia. DCG Report No. 44. |
|
|
|
Devereux S (2006). Distinguishing between chronic and transitory food insecurity in emergency needs assessments. World Food Program, Emmergency Needs Assessment Branch. |
|
|
DiPrete TA, Gangl M (2004). Assessing Bias in the estimation of causal effects: Rosenbaum bounds on matching estimators and instrumental variables estimation with imperfect instruments. Sociol. Methodol. 34(1):271-310.
CrossRef |
|
|
|
Duvendack M, Palmer-Jones R (2011). High Noon for Microfinance Impact Evaluations: Re-investigating the Evidence from Bangladesh. MPRA Paper No. 27902, University of East Anglia, Norwich, UK. |
|
|
|
EHNRI (2000). Food Consumption Table for Use in Ethiopia. Ethiopia Health and Nutrition Research Institute (EHNRI), Part III, Addis Ababa, Ethiopia. |
|
|
|
FAO (2003). Household Food Security and Community Nutrition. Agriculture and Consumer Protection Department.
View
|
|
|
|
FAO (2014). The State of Food Insecurity in the World. Strengthening the enabling environment for food security and nutrition. Rome. |
|
|
Gebrehiwot T, van der Veen A, Maathuis B (2011). Spatial and temporal assessment of drought in the Northern highlands of Ethiopia. Int. J. Appl. Earth Obs. 13(3):309-321.
CrossRef |
|
|
|
Gebremedhin TS (2006). The analysis of Urban poverty in Ethiopia. University of Sydney, Australia. |
|
|
Gilligan DO, Hoddinott J (2007). Is there persistence in the impact of emergency food aid? Evidence on consumption, food security, and assets in rural Ethiopia. Am. J. Agric. Econ. 89(2):225-242.
CrossRef |
|
|
|
Greer J, Thorbecke E (1986). Food poverty profile in applied to Kenyan Smallholders. Econ. Dev. Cult. Change 35(1):115-141. |