Full Length Research Paper
ABSTRACT
Agricultural trade is closely interconnected with a range of food security and development related issues in the case of developing countries. In this regard, diversification of both trade partners and products traded can play an important role in terms of strengthening food security concerning imports, but also as a means to create a more resilient basket of exports. This article analyses the diversification of global agricultural trade from 2000-2019, considering the main players and positions of countries within the World Trade Organization (WTO) negotiations. We scrutinize the trade diversification of the imports and exports of individual countries and groups of countries in terms of both products and markets by assessing the degree of sectorial and geographical concentration of their trade flows in the period from 2000 to 2019. We initially analyze the relation between the exported and imported value of agribusiness, and hereafter estimate indexes of diversification of each country’s agricultural trade partners and concerning the specific products exported and imported. Our conclusions highlight how many developing countries are marked by a low degree of both sectorial and geographical diversification of their agricultural trade, making them vulnerable to fluctuations within global agricultural markets.
Key words: Agricultural products, balance of trade, World Trade Organization (WTO), trade concentration.
JEL: Q17, F10, C43.
INTRODUCTION
Export diversification of agricultural products has been a goal for many countries, especially those in the developing world which often face difficulties in moving into higher value-added product categories. The existing body of literature has highlighted the importance of diversification with regards to the sectoral composition of exports, (Bonaglia and Fukasaka, 2003; Cadot and Strauss-Kahn, 2007, 2012), and regarding the processing and value-added to export products (Taylor and Francis, 2003). Prior work has thus established a connection between economic growth and diversification of both exports and imports (Parteka and Tamberri, 2013).
Import diversification has also been identified as a function of economic growth, and with specific regards to agricultural products (Choudhury and Headey, 2017; Jaimovich, 2012), a trend which in large measure is fueled by a consumption shift towards dietary diversification at certain income thresholds (Regmi, 2001). Geographical diversification has also been highlighted as possibly even more important than product diversification, because widening the scope of export destinations can lead to a rise in demand for additional products from the same export partner (Amurgo-Pecheco and Piérola, 2007). Previous studies have thus identified a general trend of geographical diversification of BRICS country exports and imports (Belardo, 2018), as well as a highly elastic import demand (Haq Zahoor and Meilke, 2009). This appears to have been a parallel trend to the structural rise of developing countries as global food importers (Serrano and Pinilla, 2011). Previous studies have thus examined trade diversification with focus on either specific countries or groups of countries, and most frequently also, analyzing only exports or imports, or only geographical or sectorial diversification. With this contribution, we seek to contribute to this field of study by presenting an unprecedently wide array of data comprising countries worldwide classified according to their main trade groupings for purpose of clarity. Moreover, we provide data on both exports and imports, as well as on both sectorial and geographical diversifications in each of them.
Over the last two decades, agricultural trade has changed as a result of greater trade liberalization brought about by the results of the Uruguay Round and by an increase in number of the Regional Trade Agreements (RTA). Figure 1 shows that, since 2000, the number of trade agreements involving products (not only from the agribusiness sector) has grown across the globe. But has this also been associated with an increase in the diversification of partners and, or, products? Or did these agreements mainly serve to lock in trade patterns between their members? And how do they perform in relation to the diversification of agribusiness trade? This article does not seek to demonstrate a causal relationship between these phenomena, but rather to contribute to this field of study with estimates and analyses of diversification trends, in order to provide a broader perspective upon the evolution of international agribusiness trade in relation to the growth of these agreements.

In this study, we analyze the trade diversification of the imports and exports of individual countries and groups of countries in terms of both products and markets by assessing the degree of sectorial and geographical concentration of their trade flows. We specifically analyze the period from 2000 to 2019. By emphasizing key data and general trends within global agricultural trade, we thereby seek to contribute to analyses of the current and future commercial and political developments within this field. For purposes of space, we mainly focus on the largest players within the field of agriculture, and treat the wider universe of countries in an aggregated manner by analyzing different WTO groups. However, the data for all countries are available in the Annex B. We hereby seek to understand whether they display similar or differing trade patterns and whether changes have been evident throughout the period examined. This information can be useful for policy makers in different countries to obtain a broader perspective of structural changes in trade flows, the differences between countries, and their evolution over time.
To identify the general patterns within the global agricultural trade, we initially analyze the relation between the exported and imported value of agribusiness. We hereafter estimate indexes of diversification: of each country’s agricultural trade partners regarding both imports and exports, and also concerning the specific products exported and imported.
MATERIALS AND METHODS
The group of countries treated in this analysis was established. Hereafter, the agricultural trade flows of this group during the period examined were analyzed and their Compound Annual Growth Rate (CAGR) was considered for the main countries and sub-periods. The period examined spans from 2000 to 2019. The diversification of the agricultural trade flows of each country was then calculated. These indexes display the degree of diversification of a country’s agricultural exports and imports within this sector, compared to other countries. A lower degree of diversification equals a higher degree of concentration.
The methodology adopted does not comprise an aim of establishing causal relationships to help countries increase their diversification. However, it presents an overview of the current situation and thereby provides a basis for future studies on this topic. The study thereby innovates by presenting a wider spectrum of information on a broad range of countries regarding this topic, which we have not found in previous contributions. The results are presented for all countries in the world in form of graphs and tables, while the largest global agricultural markets are analyzed in more detail. For this purpose, a minimum limit of an average annual value of agricultural trade was adopted, which is described for each figure.
Grouping of countries
As multilateral trade negotiations gained momentum throughout the 1990s, and 2000s, agriculture came to play a central role. Especially during the Doha Round, developed countries became pitted against developing states who sought a rearrangement of the institutions of the global trading system (Hurrell and Narlikar, 2006; Hopewell, 2013; Efstathopoulos, 2012). Yet, the divisionary lines which defined the political groupings within the negotiations were highly complex, and new constellations materialized around very heterogeneous interests in global trade reform (Gallagher, 2007; Kaukab, 2007; Bouët et al., 2005). The political groupings formed during agricultural negotiations over recent decades were defined by the economic characteristics of the agricultural sector in each country, being expressed mainly as an offensive or defensive posture, or in terms of more specific interests around any given issue (Costantini et al., 2007; Higgott and Cooper, 1990). A country’s position in agricultural negotiations thereby widely depends on factors such as the weight of agricultural commodities in its export basket, comparative advantages, diversification of agricultural trade, and import dependency.
Our point of departure is therefore the groups formed during the agricultural negotiations in the WTO: the Cairns Group, a coalition of agricultural exporters favoring trade liberalization; the G-10, which is a coalition of countries working for agriculture to be treated as a special field due to non-trade concerns; and the G33, also known as the “Friends of Special Products” within agriculture, a coalition of developing countries that favor flexibility to pursue limited market opening within agriculture. As we sought to conduct a broad global analysis of agricultural trade patterns and many countries did not appear within these groups, we also included other groups, such as the G-90 and the Friends of Ambition for Non-Agricultural Market Access (NAMA), as well as the countries without group. The first is a general negotiation group, comprising various countries not engaged within agricultural negotiations. This group is formed by states in Africa, Africa, Caribbean, and the Pacific Group of States (ACP) and least-developed countries. As many countries appear in more than one group, we considered the group with the largest number of participants. The Friends of Ambition (NAMA) is not specifically concerned with agricultural products, but was included as it comprises of important players within agricultural trade which do not appear within the previously mentioned groups, - the United States and the European Union. We therefore refer to this group as USA & EU. It generally aims towards global market opening with exceptions for agriculture. We also included the countries without group, in order to assess any possible general traits, which might become visible despite its highly heterogeneous composition.
Diversification indexes
The indexes of trade diversification were created to examine four different dimensions related to: export destinations; export products; import origins; and import products. When trade partners are analyzed (destination or origin in the case of exports or imports, respectively) diversification refers to the geographical dimension of the index. The sectorial dimension relates to trade diversification in terms of products (exports or imports). The agricultural products used and their correspondence with the harmonized system (HS) is described in Table 1A in Annex A. They follow the classification of agricultural products described in United States (2021).
The diversification index used in this study was the Global Geographic Diversification Index (GGDI) with regards to the geographical diversification, and the Global Sectoral Diversification Index (GSDI) regarding sectorial diversification. Lombaerde and Iapadre (2012) and Bouët and Odjo (2019) describe these indexes, which differ from the traditional index derived from the Herfindahl Concentration Index (HHI) as within the latter, only the sum of the share within each market is measured. Yet, within the GGDI and GSDI, the difference between the share in each market and in the world is considered. The Equations 1 and 2, respectively, describe the GGDI and GSDI indexes used in this study, for a given country (i), considering the dimension of the exports. Therefore, these same indexes were calculated for imports, but considering the imported values.
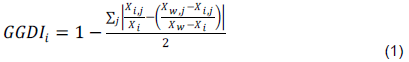
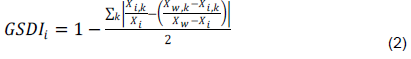
Where corresponds to the value of agricultural exports in country i for the country j; is the global exported value of the agricultural products to country j; the exported value of Agricultural products of country i to the world, and the value of global exports (w) of agricultural products. The e are, respectively, the exported values of i and the world for product k. In this case, the products did not correspond to HS, but to a grouping of them in products as presented in Table 1A of the Annex A.
Data and materials used
The data referring to the annual value of countries’ exports and imports in the period from 2000 to 2019 was obtained from Comtrade (United Nations, 2021) by 6-digits Harmonized System (HS), which were made available until February 2021. As some countries have not presented information about their trade flows for many years, we undertook the work of complementing this missing information. For this purpose, we initially mapped all the countries and years in which a lack of data was evident, either with regards to exports or imports. To cover these gaps, the global trade flows to these countries were identified and inverted. Thus, the export flows for the missing import data were inserted as imports for the countries in question and vice-versa. The values of these flows within the total amount of commercialized products vary between 1-5% of the total traded value, depending on the year. For some countries, in years when agri-trade information only is displayed by 4-digits HS instead of in 6-digit HS (as United Arab Emirates for example) we adjusted the products for this format. The USDA definition of agricultural products was used (United States, 2021).
We used the SQL Server to work in the databases and to estimate the indexes and Table Public to produce figures and the product described in Annex B. The figures presented throughout the text display parts of the results described and should be complemented by the figures shown in the link indicated in Annex B, which permit the online visualization of our results and general dataset in a more detailed manner, such as the identification of specific countries within each group, and the temporal evolution of the index. Those details could not be completely explored in this text due to spatial constraints.
RESULTS AND DISCUSSION
In order to gain an overview of the structure of global agricultural trade, we initially illustrate the general political groupings and issue coalitions which we have chosen to treat within this field, as well as their relative size within agricultural trade flows. As can be seen in Figure 2, global agricultural export values are highly concentrated on the EU and United States (the Friends of Ambition Group or just USA & EU) and the Cairns Group, which together represent more than half of world export within this sector. For agricultural import value, the countries with no group and the G-33 are higher than Cairns Group. The G-10, and finally the G-90, stand as the least significant groupings in terms of global trade value, mainly in terms of exports.
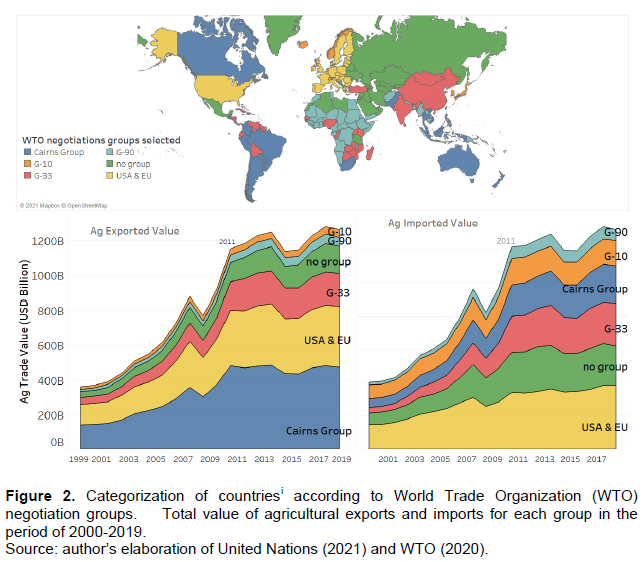
The G-33 and G-90 groups encompass the majority of the developing world, and have historically tended towards a defensive posture, motivated by food security-related concerns and the potentially negative impact of liberalizations (Costantini et al., 2007: 867). Other countries within the developing world can be found within the Cairns Group, which accounts for roughly 30% of global agricultural trade. Apart from agricultural exporters, such as Canada, Australia, and New Zeeland, the group comprises of countries within mainly Latin America and Southeast Asia. Historically, the Cairns Group has adopted a highly offensive stance within multilateral agricultural negotiations (Higgott and Cooper, 1990; Kaukab, 2007). Figure 2 also shows the evolution of agri-exports, which is marked by two different trends. The first period 2000-2011 presents a constant linear increase, which ends with the eruption of the crisis of 2008. In this period, the CAGR was 10%. In the second period from 2011-2019, the global growth of agri-trade was more limited, with a CAGR of 1%.
More specifically, Figure 3 displays the imports and exports from the largest global agricultural markets, which encompass around 90% of the total agricultural trade value. This figure provides an overview of the different countries’ position within global agricultural trade in the first (2000) and last (2019) year of the period, showing their agricultural export and import values. The line dividing the graph represents the point at which total agricultural export values equal imports. Countries above this line thereby have an agricultural trade balance surplus, while countries below it present an agricultural trade balance deficit during the period analyzed. The value of the agricultural trade of countries such as the USA, the EU, and China (mainly in 2019) is much larger than that of many other countries. The Figure 1.B in Annex B permits a clearer visualization and identification of all the countries or select groups of countries (according to our definitions based on the WTO groups) as well as the annual values for each of these, hereby complementing Figure 3 which does not allow for a complete overview of the data analyzed.
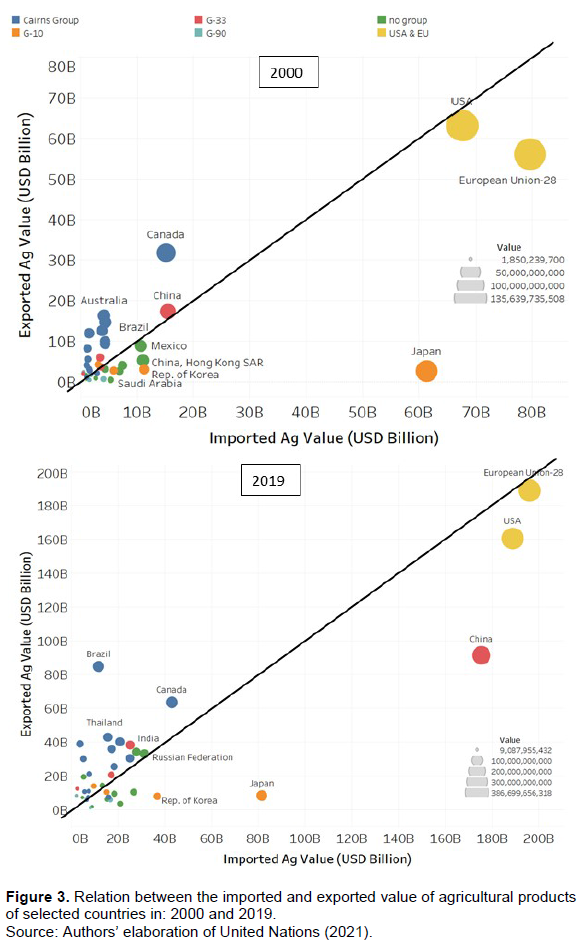
Observing initially the USA & EU (Friends of Ambition for Non-Agricultural Market Access-NAMA), it becomes clear how the USA and the EU both are highly important as global importers and exporters of agricultural products, - a feature which has been evident throughout all of the period analyzed. Chinese agri-trade has increased significantly from 2000 to 2019, and the country presents large volumes of both agricultural imports and exports, although the former surpass the latter, resulting in a large trade balance deficit. India, on the other hand, which is member of the same group as China (G-33), displays a moderate trade balance surplus. With the exception of Pakistan and the Philippines, all of the Cairns members (marked with blue) present varying degrees of trade balance surpluses, with countries such as Brazil, Argentina, Indonesia, Canada, Australia, and New Zeeland representing the highest values. Within the G-10, Japan and South Korea stand out due to their pronounced deficits. Figure 3 also illustrates how the groups of G-33, G-90, and the countries without group appear very heterogeneous in terms of their agricultural trade balance values, which also converges with the findings of Costantini et al. (2007); Kaukab (2007) and Matthews (2005). It is interesting to observe that while both the G-33 and G-90 are dispersed on both sides of the central line, meaning that they encompass both net agricultural exporters and importers, the countries with the largest and most consistent deficits can be found within the category of states not pertaining to any of the examined groups.
Some patterns within international trade vary significantly during the period analyzed. Evaluating the trade patterns for these two different sub-periods, Figure 4 extends the analysis of the Figure 3, showing the average annual growth in agricultural exports and imports. Even though all of the selected Cairns members presented a positive agricultural trade balance, Brazil stands out due to its elevated agricultural trade balance surplus, which has been growing significantly during the period under analysis, but mainly from 2000-2011 when it increased from almost US$15 to US$84 billion. It is noticeable that many Cairns countries, such as Argentina, Thailand, Indonesia and Malaysia underwent a high proportional increase in their agricultural trade balance surplus from 2000-2011. These countries’ export growth was less pronounced in the period from 2011-2019, with Argentina and Malaysia even experiencing declines in these values.
As we can see in Figure 4, during the period from 2000-2011 the increase in exports was highly elevated in the case of all groups. A pronounced growth in agricultural exports can be observed in the case of G-33, driven in large measure by China whose imports and exports increased markedly. The Cairns Group and countries without group also presented significant growth rates in this period, followed by the G-90, the US and the EU, and the G-10. The difference between the two periods is noteworthy. Thus, while all the groups analyzed presented steady annual growth rates of both exports and imports between 10-20% from 2000 to 2011, from 2011 to 2019 growth was much more modest, and in some cases even negative. While the main share of countries without group, the G-33, and the G-90 presented some moderate export growth in this second period, the US & EU and the Cairns generally display a weak performance, with many Cairns members even experiencing declining CAGR values. Hence, the period from 2011 to 2019 implied many challenges for the Cairns members. This observation appears to converge with the development of the institutional environment for agricultural trade during the period analyzed. The effects of the liberalizations resulting from the Agreement on Agriculture (1995), which were phased in over a 6-10 year period – thereby supported the rapid expansion of global agricultural trade observed from 2000-2011. Yet, the failure of the Doha Round meant that liberalizations from 2008 occurred mainly through preferential trade agreements, resulting in a “spaghetti bowl” of overlapping and increasingly bilateral agreements (Bhagwati, 2008; Acharya et al., 2011). While preferential agreements can provide a trade-enhancing alternative to multilateralism, their excessive proliferation has also been associated with trade diversion and decreased efficiency (Viner, 1950; Sorgho, 2016), which could present a more complicated environment for trade expansion. Agricultural exports nonetheless continue to provide an important source of external revenues for the Cairns Group members, meaning that the objective economic conditions for seeking the expansion of global agricultural market access should remain a common concern amongst these states.
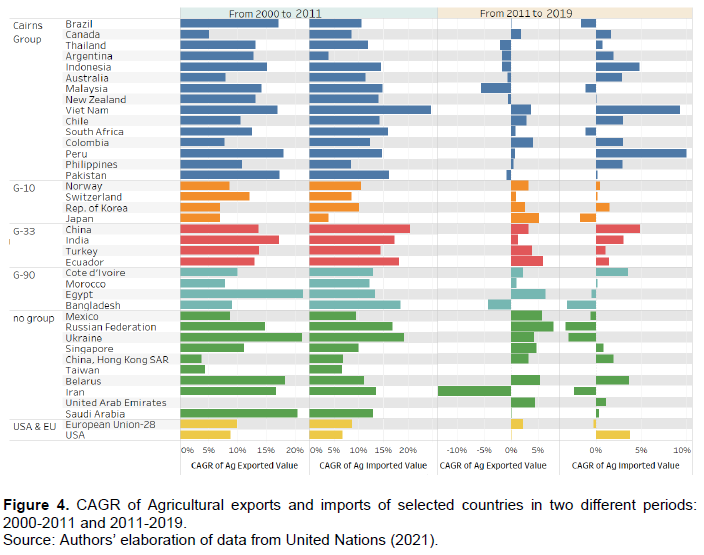
The data presented in Figure 4 also highlights that although together, the Cairns, the US, and the EU still account for the largest share of global trade in agricultural products, their relative significance has been declining, especially since 2011. The accentuated Chinese growth within both imports and exports partly accounts for these proportionate dislocations, but not exclusively. As global agricultural trade since 2000 has become less concentrated on a few important players, this could present a more complex negotiation scenario for any future attempts at reaching broad multilateral trade reform, as more countries have obtained a position of strategic importance. Agricultural trade can thus be said to have become increasingly multipolar.
Analysis of diversification of agricultural trade
In order to determine the degree of diversification of each country’s agricultural trade in terms of both trade partners and products traded, indexes of geographical and sectorial diversification were analyzed of which GGDI refers to trade partners, while GSDI refers to products traded.
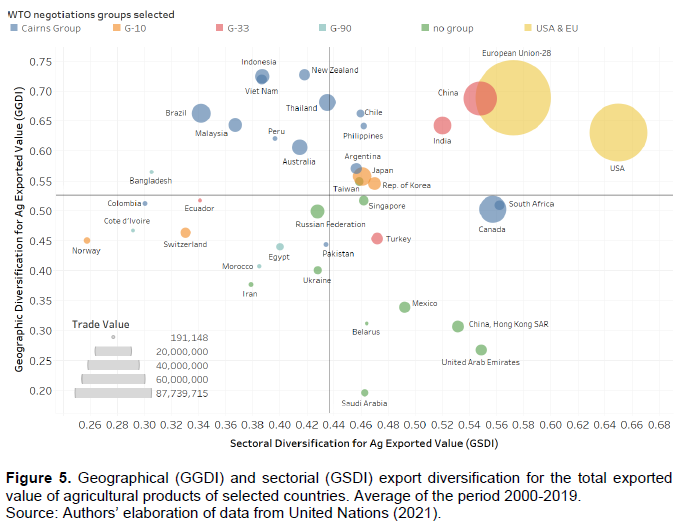
Figure 5 presents the average values for the period from 2000 to 2019 of the indices of geographical diversification (GGDI) and sectorial diversification (GSDI) of each country group’s exports and the main countries selected as previously discussed. Figure 2B in Annex B shows the same graphic, but separately for each year in the period. We also show, in the Figures 3B, the results for each country illustrated on the map, where the colors represent the degree of diversification. As can be read from Figure 5, the USA and EU (Friends of Ambition for NAMA) presented the highest degree of diversification, both in terms of products as well as trading partners regarding agricultural exports. Hereafter, the Cairns group appears, which, despite a relatively high level of geographical diversification of exports presents only a low level of sectorial diversification. Within this group, Indonesia, New Zeeland, and Vietnam presented the highest degree of geographical diversification of exports, while South Africa and Canada displayed the lowest scores. Despite a high degree of geographical diversification of its agricultural exports, Brazil is nonetheless characterized by one of the lowest degrees of sectorial diversification amongst the Cairns countries. The countries of the G-33, G-90, and G-10 all appear with a low level of geographical diversification of their agricultural exports. Internally though, the individual countries vary significantly. India, and not least China are the most different countries, presenting a relatively high degree of both geographical and sectorial diversification of exports. The countries without any group display a modest level of sectorial diversification, and a very low level of geographical diversification.
Illustrating the evolution of these indexes over time, Figure 6 shows the CAGR of the index of sectorial and geographic export diversification for the same group of countries from 2000 to 2019. As is evident from Figure 6, countries such as Thailand, Pakistan, Turkey, and Egypt have experienced a high degree of sectorial diversification of their agricultural exports during the period in question, while the exports of Cote D'Ivoire, Singapore, Switzerland, Brazil and the Ukraine have become less sectorial diversified. With respect to geographical agricultural export diversification, South Korea, Ukraine, Switzerland, Iran, China and Argentina present the highest increases in diversification, while the largest decreases can be observed in the cases of Belarus, Morocco, and New Zeeland.
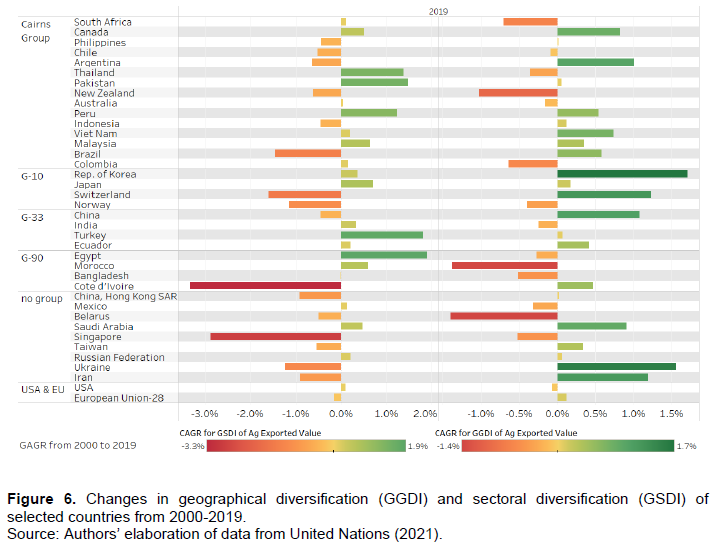
It is thus clearly illustrated, that both high geographical as well as high sectorial diversification is a characteristic of the EU and the US, and showing a constant evolution in all period. While the mainly developing country agricultural exporters in the Cairns group have managed to reach a somewhat high level of geographical diversification, their low degree of sectorial diversification indicates that many of these countries face a reliance upon exports of a restricted range of agricultural products. Considering the relative importance of agricultural products within these countries’ export basket, they appear even more vulnerable to global price fluctuations of key commodities compared to the US and the EU. In the period, Brazil was the country that presented the highest negative growth in the sectorial diversification, while New Zeeland reduced its geographic diversification the most. The developing countries within the G-33 and G-90 find themselves in a situation of an even more accentuated dependence on a few export products and destinations. China has grown most in terms of destinations, and Turkey and Egypt in terms of products. Regarding exports, the Chinese and Indian performances differ from those of the other countries in the G-33 group, more closely approximating the USA and EU, or the Cairns groups.
Turning towards imports, Figure 7 displays the degree of geographical and sectorial import diversification. The figure presents the average values of the indices of geographical and sectorial diversification for the period (2000-2019) for the selected countries. Figures 4B in Annex B complement these results, showing the values for each year in the period. In Figure 5B, we also show the results for each country illustrated on the map, where the colors represent the degree of diversification.
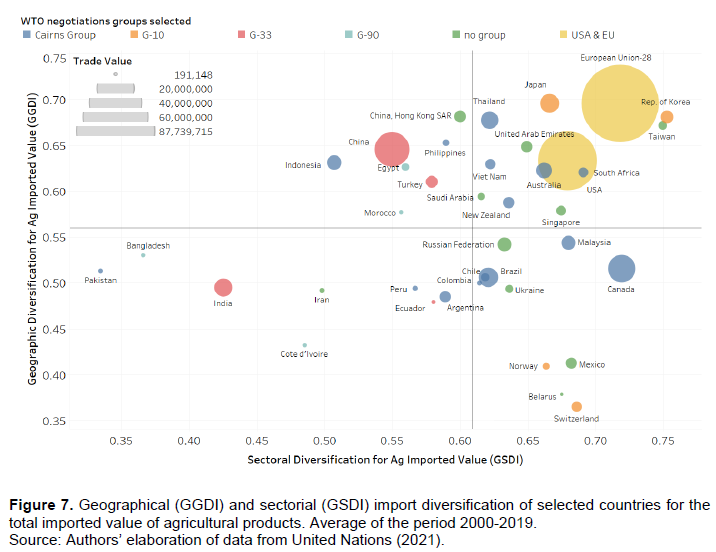
As it was evident concerning export diversification, the USA and EU (Friends of Ambition for NAMA), also presented the highest indexes of import diversification, both in sectorial and geographical terms. The G-10 generally displays a high degree of sectorial diversification of imports, which appears to be due to a consumer demand for variated imports of agricultural products characteristic of high-income countries, as we also saw with regards to the USA and the EU. Yet, as can be read from the figure, the G-10 is marked by a high degree of internal heterogeneity concerning the geographical diversification of imports, with countries such as Norway and Switzerland presenting very low levels, while Japan and South Korea are characterized by an elevated level of geographical diversification close to that of the EU. The global significance of these countries as agro purchasers is clear, as they are centrally placed within the East Asian agro-import complex (McMichael, 2000). Overall, the Cairns Group displays a moderately high level of sectorial import diversification, but varies much in terms of its geographical import diversification. It is noticeable that the developing countries in the G-33, G-90, as well as the countries without group, on average presented a low degree of both geographical and sectorial diversification of imports. China can be found within the upper left quadrant, marked by a high geographical diversification of imports, but a low level of sectorial diversification. India, in turn, can be found within the lower left quadrant, meaning that the country’s agricultural imports are marked by a very low degree of both sectorial and geographical diversifications. Developing countries generally are more dependent on imports of a more limited range of essential staples (Bhattacharjya et al., 2017). Our results highlight that these imports furthermore also tend to be concentrated on a limited range of global suppliers. This condition may well be associated with an increased vulnerability to price shocks of essential agricultural commodities, as it became evident in the latest global food crises (Headey, 2011), especially with regards to small net food importers (Bouët and Debouchet, 2012).
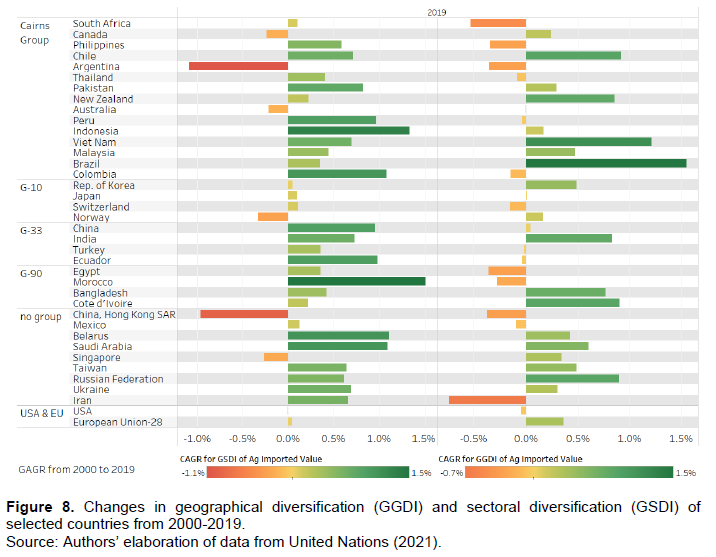
Complementing the information described in Figures 7 and 8 shows the evolution, in terms of CAGR, of the geographical diversification of agricultural imports. Figure 8 shows that the highest increases in sectorial diversification of agricultural imports can be observed in the cases of Morocco, Indonesia, Belarus, Colombia, and Saudi Arabia, while the most significant decreases are evident with regards to Argentina, Hong Kong, Norway, Singapore, and Canada.
With respect to geographical diversification, the most noticeable increases become evident with respect to Brazil, Vietnam, Chile, Cote D´Ivoire, Russia, New Zeeland, and India, while the largest decreases can be detected in the cases of Iran, South Africa, Hong Kong, Argentina, and the Philippines (Figure 8).
Summarizing the values from the indicators analyzed, the Friends of Ambition in NAMA (USA & EU), it becomes evident how the United States and the European Union are characterized by very high exports as well as imports of agricultural products, which both have increased markedly from the first to the second period of analysis. Their trade is highly diversified, regarding both sectorial and geographical diversification of imports as well as export flows. Both of these indicators have remained at a relatively constant level throughout the period analyzed.
The Cairns Group presents an increasing level diversification of both agricultural imports and exports over the period analyzed, as well as a pronounced agricultural trade balance surplus on average. In the period 2011-2019, their imports increased at a faster pace than their exported agricultural values. They presented high geographical diversification and low sectorial diversification, while Brazilian product diversification decreased in this period. Concerning imports, both the sectorial and geographical diversification have undergone modest increases.
In likeness with other groups analyzed, the G-33 has seen a significant increase in its agricultural trade over the period examined, regarding both imports and exports. This is particularly evident with regards to China and India. The sectorial diversification of the group’s exports is high, but it has only increased marginally during the period. Conversely, the level of sectorial diversification of the G-33 agricultural imports is low, but has expanded. The geographical diversification has increased most significantly in the cases of Chinese exports and Indian imports.
The G-90 members are marked by much higher imported values than those of their agricultural exports. On average, the group therefore presents an agricultural trade balance deficit. Both imports and exports have grown significantly in the first decade (2000-2011). The G-90 thereby presented a low degree of sectorial and geographic diversification of its exports, while its imports were more diversified, a trend which increased during the period analyzed. The G-10 countries have also seen an increase in both agricultural exports and imports during period examined, though proportionately less pronounced than that of other groups analyzed. On average, the group’s members display a clear deficit on the agricultural trade balance. The G-10 thereby presented a level close to the average for the diversification index; while the sectorial diversification of the G-10 agricultural exports has declined, its geographical diversification has increased. The sectorial diversification of G-10 imports is very high and has remained constant.
Finally, the countries without any groups have witnessed a marked increase in both agricultural exports as well as imports over the period analyzed, and on average present an agricultural trade balance deficit. However, their export values increased most in the period 2011 to 2019 (except for Belarus). Their geographic diversification is generally below average and sectorial diversification has declined. With regards to imports, the sectorial diversification is above average and had increased in the period of study.
CONCLUSION
In this study, we mapped the macro-trends and recent evolution of global agricultural trade from 2000-2019. For this purpose, we assessed the distribution of global trade on countries and groupings, the current values of the agricultural trade balances, the sectorial and geographical diversification of each country’s agricultural imports and exports. Our findings were presented in schematic form, and their main implications highlighted within the analysis. In conclusion, we have chosen to stress certain elements within our findings, which, we believe, are highly noteworthy.
(i) The impact of the rapidly increasing Chinese participation within global agricultural trade as well the increase in imports around the world has been highly significant to increase the exports during 2000-2011. Yet, as the Chinese imports have outpaced exports, resulting in a large agricultural trade balance deficit, countries exporting to China have been able to increase their shipments. This has made it possible for an agri-exporter such as Brazil to consistently raise its agricultural trade balance surplus over the period from 2000-2019.
(ii) For the period 2010-2019, growth in global agricultural trade has declined in the case of all WTO groups. Yet, this decline has been most accentuated in the case of the Cairns group in the case of export value, which together represent the largest share of global agricultural trade. For imports, G-10, G-90 and the countries without group presented a more accentuated decrease. This raises the question of whether global agribusiness trade has reached a level of structural saturation due to lower increases in demands for food imports, and in this case, which factors might be able to account for this development. In this regard, it is also worthwhile to consider the wave of sweeping multilateral trade liberalizations in the 1990s as well as its gradual stagnation in the 2000s, which could provide for an important point of departure for future studies to analyze this potential causal link. Possible political efforts to address food security concerns by increasing domestic supply in many countries should also be considered.
(iii) Developing countries in the G-33 (with exception of China and India on the export) and G-90 are characterized by a very low degree of diversification of their agricultural trade. This concerns both sectorial and geographical diversification, in relation to both exports and imports. The low degree of sectorial and geographical export diversification may well mean that these countries become vulnerable to fluctuations within sectors and regional markets in which they are competitive. While our review of the evolution of sectorial export concentration of countries that present significant variations over the period from 2000-2019 points to a global trend of specialization in the export of agricultural commodities, developing countries would need to increase their sectorial diversification as well as geographic export diversification to benefit within this commercial environment. With regards to imports, the high degree of sectorial concentration characterizing groups of developing countries (mainly G-90 and G-33) is associated with a vulnerability to price shocks within specific markets and to sudden supply shortages, as it became evident during the two most recent food crises.
(iv) In contrast, the EU and the USA score high on both geographical and sectorial diversification on agribusiness trade flows (exports and imports). India and China also presented high diversification of exports (sectorial and geographic) and G-10 and the countries without group on sectorial diversification of imports. The high degree of diversification of agribusiness trade in the case of developed countries draws attention to the role which elevated per capita incomes are likely to play in driving demand for variated foodstuffs and agricultural products. This has provided market niches for some developing country exporters who have sought elevated price premiums within developed country markets. It will be important to observe to which extent similar trends become evident within rapidly growing developing markets, such as China, so that not only demand increases in terms of volumes, but also regarding diversification, can drive exports from other developing countries.
(v) As the current study aims to provide a descriptive overview of structural trends within global agribusiness trade diversification and specialization, for future works, we recommend using the indices presented here as variables to compose an explanatory model of commercial trends.
CONFLICT OF INTERESTS
The authors have not declared any conflict of interests.
REFERENCES
|
Acharya R, Crawford JA, Maliszewska M, Renard C (2011). Landscape in Chauffour, Jean-Pierre; Maur, Jean-Christopher (eds.) Preferential Trade Agreement Policies for Development. The World Bank pp. 37-68. |
|
|
Amurgo-Pacheco A, Piérola MD (2007). Patterns of export diversification in developing countries: Intensive and extensive margins. HEI Working Paper, No. 20/2007, Graduate Institute of International Studies, Geneva. |
|
|
Belardo G (2018). Trade diversification and changing food consumption patterns since the 2000s: The case of homogenizing diets globally and in the BRICS. LUP Student Papers. Lund University. Department of Economic History. |
|
|
Bhagwati J (2008). Termites in the Trading System: How Preferential Agreements Undermine Free Trade. Oxford University Press Scholarship Online. |
|
|
Bhattacharjya S, Chaudhury S, Nanda N (2017). Import Dependence and Food and Nutrition Security Implications: The Case of Pulses in India. Review of Market Integration 9(1-2):83-110. |
|
|
Bonaglia F, Fukasaku K (2003). Export Diversification in Low-Income Countries: An International Challenge after Doha. Research programme on: Market Access, Capacity Building and Competitiveness. June 2003. OECD. |
|
|
Bouët A, Bureau JC, Decreux Y, Jean S (2005). Multilateral Agricultural Trade Liberalisation: The Contrasting Fortunes of Developing Countries in the Doha Round. The World Economy 28(9):1329-1354.Working Papers 2004-18, CEPII research center. |
|
|
Bouët A, Debouchet DL (2012). Food crisis and export taxation: the cost of non-cooperative trade policies. Review of World Economics 148(1):209-233. |
|
|
Bouët A, Odjo S (2019). Africa Agriculture Trade Monitor Report. Washington, DC: International Food Policy Research Institute (IFPRI). |
|
|
Cadot O, Carrère C, Strauss-Kahn V (2007). Export Diversification: What's behind the Hump? Review of Economics and Statistics • November 2007 92(2):590-6051-46. |
|
|
Cadot O, Carrère C, Strauss-Kahn V (2012). Trade diversification, income, and growth: what do we know? Journal of Economic Surveys 27(4):790-812. |
|
|
Choudhury S, Headey D (2017). What drives diversification of national food supplies? A cross-country analysis. Global Food Security, 15:85-93. |
|
|
Costantini V, Crescenzi R, De Filippis F, Salvatici L (2007). Bargaining Coalitions in the WTO Agricultural Negotiations. The World Economy 30(5):863-891. |
|
|
Efstathopoulos C (2012) Leadership in the WTO: Brazil, India and the Doha development agenda. Cambridge Review of International Affairs 25(2):269-293. |
|
|
Gallagher KP (2007). Understanding developing country resistance to the Doha Round. Review of International Political Economy 15(1):62-85. |
|
|
Haq Zahoor Ul, Meilke KD (2009). Do the BRICs and Emerging Markets Differ in their Agrifood Trade? Conference, August 16-22, 2009, Beijing, China 51395, International Association of Agricultural Economists. |
|
|
Headey D (2011). Rethinking the global food crisis: The role of trade shocks. Food Policy 36(2):136-146. |
|
|
Higgott RA, Cooper AF (1990). Middle Power Leadership and Coalition Building: Australia, the Cairns Group, and the Uruguay Round of Trade Negotiations. International Organization 44(4):589-632. |
|
|
Hopewell K (2013). New Protagonists in Global Economic Governance: Brazilian Agribusiness at the WTO. New Political Economy 18(4):603-623. |
|
|
Hurrell A, Narlikar A (2006). A New Politics of Confrontation? Brazil and India in Multilateral Trade Negotiations. Global Society 20(4):415-433. |
|
|
Jaimovich E (2012). Import diversification along the growth path. Economics Letters 117(1):306-310. https://doi.org/10.1016/j.econlet.2012.05.048 |
|
|
Kaukab RS (2007). Coalitions and Alliance Strategies for Developing Countries in the Doha Round of Agricultural Negotiations, in McCalla Alex F, Nash J (eds.) Reforming Agricultural Trade for Developing Countries. The World Bank pp. 132-150. |
|
|
Lombaerde PD, Iapadre PL (2012). Indicadores de la globalización. Cuadernos de Economía 31(57) No. Especial. |
|
|
Matthews A (2005). The road from Doha to Hong Kong in the WTO agricultural negotiations: a developing country perspective. European Review of Agricultural Economics 32(4):1-13. |
|
|
McMichael P (2000). A Global Interpretation of the Rise of the East Asian Food Import Complex. World Development 28(3):409-424. |
|
|
Parteka A, Tamberi M (2013). Product diversification, relative specialisation and economic development: Import-export analysis. Journal of Macroeconomics 38:121-135. |
|
|
Regmi A (2001). Changing Structure of Global Food Consumption and Trade. Market and Trade Economics Division, Economic Research Service, U.S. Department of Agriculture and Trade Report International Agriculture and Trade Outlook No. (WRS-01-1:1) 111 p. |
|
|
Serrano R, Pinilla V (2011). The Evolution and Changing Geographical Structure of World Agri-food Trade, 1951-2000. Revista de Historia Industrial 46:97-125. |
|
|
Sorgho Z (2016). RTAs' Proliferation and Trade-diversion Effects: Evidence of the 'Spaghetti Bowl' Phenomenon. The World Economy 39(2):285-300. |
|
|
Taylor TG, Francis B (2003). Agricultural Export Diversificaition in Latin America and the Caribbean. Journal of Agricultural and Applied Economics 35(1379-2016-113572):77-87. |
|
|
United Nations (2021). Comtrade Database. Available at: https://comtrade.un.org/. Get Data. Extract data. (accessed in March, 05. 2020). |
|
|
United States Department of Agriculture (2021) Foreign Agricultural Service. Available at: https://www.fas.usda.gov/data. Data & Analysis. GATS. Reference Info. Definitions. Product Groups. BICO HS-6 (Accessed in April, 03. 2021). |
|
|
Viner J (1950). The Customs Union Issue. Oxford University Press. |
|
|
World Trade Organization (WTO) (2020). Available at: https://www.wto.org/index.htm. Trade Topics. Doha Agenda. Groups in the negotiations (Accessed in August, 2020). |
|
|
World Trade Organization (WTO) (2021). Available at: http://rtais.wto.org/UI/PublicMaintainRTAHome.aspx. Explore the data. RTA in force. (accessed in April, 03. 2021). |
|
Copyright © 2024 Author(s) retain the copyright of this article.
This article is published under the terms of the Creative Commons Attribution License 4.0


