ABSTRACT
Despite high volume of honey production in Chena district of southern Ethiopia, the market supply of honey is low as compared to its potential due to some socioeconomic, demographic, production, market and institution related factors. This study was initiated to identify factors affecting volume of honey marketed. Data from 154 sample honey producers was collected and analyzed using multiple linear regression model with the aid of STAT version 13. The regression model result reveals that beekeeping experience, hive types used, number of beehives owned, number of extension contact and cooperative membership positively and significantly affected honey market supply while distance from nearest market significantly and negatively affected it. To enhance volume supplied with appropriate market outlet choices which in turn increase producers income generated from honey, all concerned bodies need to focus on promoting farmer-to-farmer knowledge sharing with experienced households, capacity building through training on improved honey production, increasing access to improved beehives, improving poor road facility, strengthening financial capacity of existing and establishment of additional beekeepers cooperatives.
Key words: Honey, market supply, multiple linear regression.
Beekeeping is considered to be an income-generating activity that fits well with the concept of small-scale agricultural development in Ethiopia (MoA and ILRI, 2013). It is also eco-friendly and does not compete for scarce land resources, and provides off-farm employment and income generating opportunity (Workneh, 2011). To support rural economy, agricultural production system should be supported by other income generating activities such as beekeeping. So agriculture together with beekeeping activities could be operated side by side (Desalgne, 2011). Southwestern part of Ethiopia has great potential for beekeeping activities; due to the presence of dense natural forest with different species of flora and fauna which are used as pollen and nectar source for bees and suitable environmental conditions for bee colony and the production of honey (Yoshimasa, 2014). Kaffa zone is highly suitable for beekeeping and large volume of honey is produced annually in Southwest part of the country (Nuru, 2007). However, sparsely populated rural areas, and poor infrastructural facility are physical barriers to accessing markets; lack of negotiating skills, lack of collective organizations and lack of market information are impediments to market access (Kassa et al., 2017a).
Chena district is believed to have diversified types of vegetation and cultivated crops and expected to be one of the areas that have considerable potential for beekeeping activities and honey production in Kaffa zone (Awraris et al., 2012). However, honey production is very traditional which is practiced mainly by hanging traditional hives on tall trees in the dense forest far from human settlement areas. According to Kassa et al. (2017b) beekeepers produce honey using traditional methods and sell their honey products at the local market. Though the honey production is traditional, currently due to some interventions by government and non-government organizations, the beekeepers in the district are using improved beehives in some extent that boost volume of honey produced. As a result, the district becomes high honey producer in the zone (KZLFD, 2016). Despite high honey production, the market supply of honey is low as compared to its potentiality due to some socioeconomic, demographic, production, market and institution related factors. According to Kassa (2017), honey producers in the study area faced marketing problem due to remoteness of some kebeles, low farm-gate prices and long market chain which results to low level of market participation.
A number of studies identified factors influencing volume of honey supplied to the market in Ethiopia. Past empirical studies by Assefa (2009), Getachew (2009), Betselot (2012) and Samuel (2014) attempted to identify factors affecting volume of honey supplied to market at household level in different part of Ethiopia. However, there were no comprehensive earlier studies which investigated the factors affecting volume of honey supplied in Kaffa zone of Southren Ethiopia where there is large number of beekeepers. Most of the research on apiculture on southwestern part has largely focused on biophysical aspects such as yield enhancement, production practices and bee disease like that of Awraris et al. (2015); Awraris et al. (2012), Gallmann and Thomas (2012) and Nuru (2007) on honey bee disease. Improved marketing facility and information access enables farmers to plan their production in line with market demand, to decide how much they sell, which market to sell their produce to and negotiate on a more even footing with traders (CIAT, 2004). Even though honey is economically and socially important, determinants of volume of supply to market have not yet been studied and analyzed for the target study area, where great potential of honey production exists. Therefore, this study was conducted to identify factors affecting honey market supply in Chena district, Kaffa zone.
Description of the study area
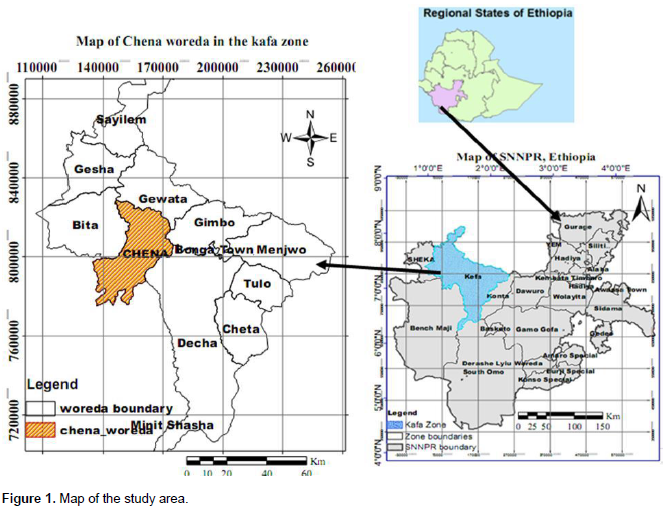
The study was conducted at Chena district, Kaffa zone of Southern Ethiopia. The district was purposely chosen out of 11 districts in the zone because of its high honey production potential, which accounts for about 24% of the total honey production in Kaffa zone (KZLFD, 2016). The district is found within the southwestern plateau of Ethiopia which is 510 and 785 km far from Addis Ababa and Hawassa, respectively. The area is located at 07º18’48’’N Latitude and 036º16’25’’ E Longitude and at altitude of 2020 m.a.s.l. The district is bordered on the south by the Bench Majji zone, on the west by Bita, on the north by Gewata, on the northeast by Gimbo and on the east by Decha districts (Kifle et al., 2015). According to CWFEDO (2016), Chena district comprises of 42 kebeles (Kebele is the lowest administrative unit under Ethiopian condition) and with a total population of 158,449, of whom 78,150 are men and 80,299 women; 11,629 or 7.34% of its population are urban dwellers. The district agro ecology is 15% high land, 80% midland and 5% lowland and the district has a minimum temperature of 16°C and maximum temperature of 28°C, has average rainfall of 1356 mm. The total area of Chena district is estimated to be 901.92 km2 that endowed with natural tropical rain forests with suitable climates that favour high honeybee population density and forest beekeeping is widely practiced (Nuru, 2007) (Figure 1).

Sampling procedure and sample size
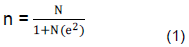
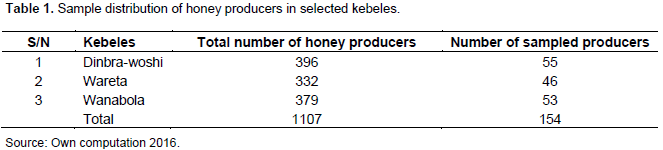
A multi-stage sampling technique was employed for this study. At the first stage, out of 39 rural kebeles in the district, three kebeles were selected randomly because all of the rural kebeles are honey producers. At the second stage, total households that produce honey during 2015/2016 from the three randomly selected kebeles were identified and stratified. Finally, based on the list of honey producers from the sampled kebeles, the intended sample size was selected by employing probability proportional to size. Accordingly, a total of 154 honey producers were sampled randomly. For this study, sample size was determined from out of 7752 honey producers in the district based on the formula given by Yamane (1967) at 8% level of precision:

Where, n = the sample size, N = is total size of the honey producers (7752), e= is the level of precision (8%). From 154 selected households, 35.7% were from Dinbra-Woshi, 29.9% were from Wareta kebele and the remaining 34.4% were selected from Wanabola Keble (Table 1).

Data types, sources and methods of data collection
Both primary and secondary data were used for this study. Primary data were collected using semi-structured questionnaire for honey producers. Primary data collected from beekeepers focused on factors affecting volume of honey supplied; demographic and socioeconomic characteristics of the households. Enumerators who are working in the district rural kebles as development agents was selected to collect data. Before data collection the enumerators were trained on the techniques of data collection and the questionnaire was pre-tested on ten households to evaluate the appropriateness of the design, clarity and interpretation of the questions, relevance of the questions and time taken for an interview. Hence, appropriate modifications were made on the questionnaire prior to conducting the survey. In addition to the questionnaire, focus group discussion and key informants’ interview were employed using checklists to obtain additional supporting information for the study. Secondary data were collected from different published and unpublished sources, government institutions and websites.
Methods of data analysis
Descriptive statistics such as percentages, frequencies, mean and standard deviation were used to analyze the characteristics of the sampled honey producer households. While for analysis of the factors influencing honey market supply multiple linear regression was used.
Econometric model for volume of honey market supply
Different models can be employed to analyze the determinants of market supply. The commonly used ones are multiple linear regression, Tobit and Heckman’s sample selection models. If some households may not prefer to participate in a particular market in favor of another, while others may be excluded by market conditions Tobit or Heckman models are used to analyze market supply. By using Tobit model, the market supply can be analyzed by clustering the respondents’ into supplier and non-suppliers. If censored regression is applied, the model estimates are biased because of there is no clustering honey producers as all of households supply their product to market (Wooldridge, 2010). Like Tobit model, sample selection model (Heckman) was used in some cases when sample selection biased occurred in addition to clustering of respondents.
The first stage of the Heckman model a ‘participation equation’, used to construct a selectivity term known as the ‘inverse Mills ratio’ which is added to the second stage ‘outcome’ equation that explains factors affecting volume of product marketed and estimated by using ordinary least square (Wooldridge, 2010). However, in the study area all honey producers participate in the market by supplying their produce and therefore there is no clustering of honey producers in honey market participant and non-participant. Thus, for this study, multiple linear regression model was used to identify determinants of honey marketed supply.
Model specification
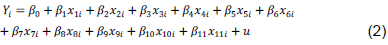
Multiple linear regression (OLS) model for supply function is specified as:
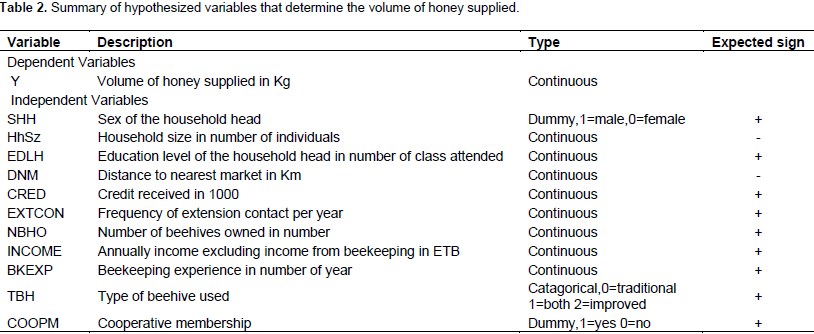
Where, yi= quantity of honey supplied to the market by household head I; x1i=sex of household head I; x2i=size of households in household head I; x3i =beekeeping experience of household head I; x4i =types of bee hives used by household head I; x5i= number of beehives owned by household head I; x6i =frequency of extension contact of household head I; x7i =education level of household head I; x8i =total income excluding income beekeeping activities of household head I; x9i =amount of credit received by household head i and; x10i =cooperative membership of household head I; x11i=distance from nearest market for household head i.
In matrix form, the supply function can be specified as:


Socio-economic characteristics of the sampled honey producers
From the descriptive statistics result in Table 3, about 78.6% of the sample households were male headed while 21.4% were female headed households. Regarding household size, the mean household size of the total sample households was 6.15 with the standard deviation of 2.55. Concerning their literacy level, the mean educational level of sample respondents was grade 5.4. This implies that majority of the beekeeping households are literate though they are with low educational level. The beekeepers of the study area practice various livelihood strategies and income generating activities mainly crop production in addition to animal husbandry, honey production, petty trade and daily labor. For the total sampled households, the average annual income generated from selling of crops, livestock and non/off-farm activity (pension, petty trade and remittance) was 14,520 ETB per year. The average years of beekeeping experience for the sampled households was about 13 years.
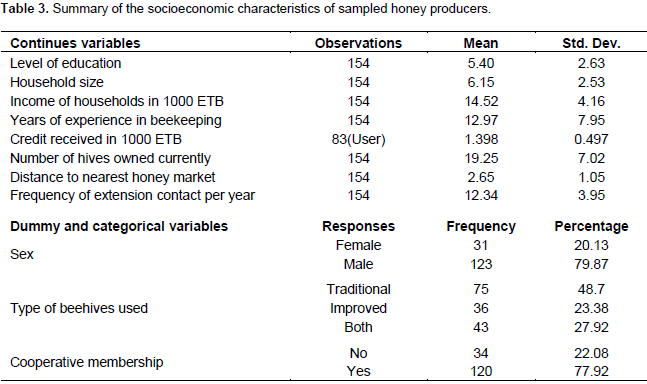
With regard to the respondents’ number of beehive possession (traditional and/or improved), the average holding was about 12 hives per household with minimum of 6 and maximum of 49. The type of hive used is one of the important factors which determine productivity of bees. Therefore, it is important to discuss different hive types that are used by sampled beekeepers in the district. According to the survey result, about 48.7% of the respondents were using only traditional types of hives and keeping bees in the forest by hanging the hive on long trees in dense forests; about 23.9% were using only improved beehives. While, the rest 27.4% of sample beekeepers were using both traditional and improved beehives (chefeka (top bar hive made from cheap and locally available non-timber hive), Kenya top bar and zendar) in the district.
Table 3 depicts that out of the total honey producing sampled households, about 94.16% reported that they had access to extension service in 2015/2016 production season with average number of extension contact per year of 12.34. The extension service providers for honey production in the study area were livestock and fishery office experts, DAs, NGOs and research institutions. Regarding credit service, the mean credit received was 1397.72 ETB from informal sources (friends, relatives or village money lenders). Even if credit services enhance the productivity of farmers, there is lack of attention to access and availability of credit from formal institution. The survey result indicates that majority (77.92%) of the respondents were members of beekeepers’ cooperatives while the rest (22.08%) of them were not members. Finally, the average distance needed for sampled honey producer’s to reach to nearest market place was 2.65 km.
Factors affecting market supply of honey
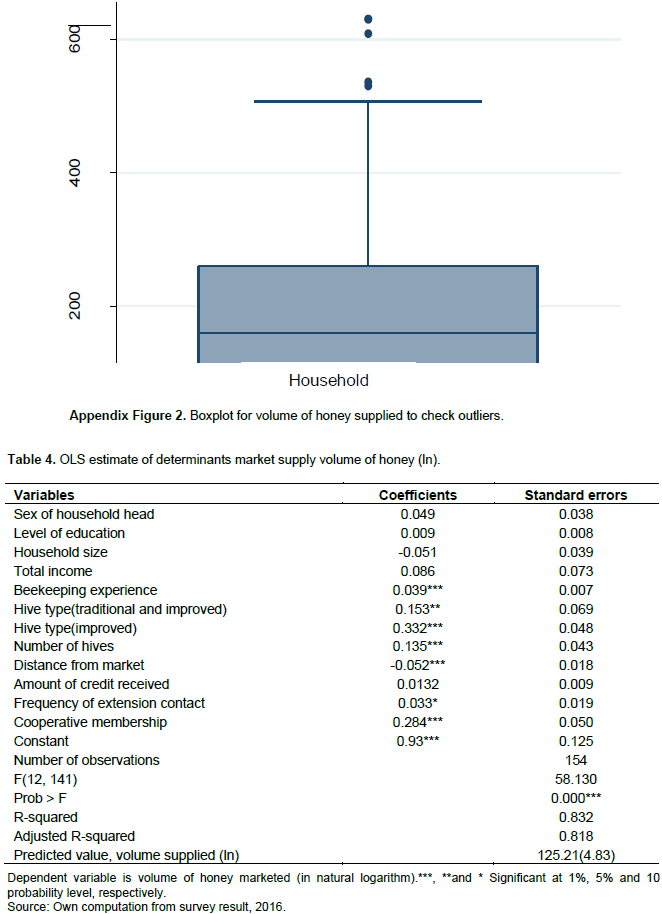
Honey is produced mainly for market and is one of the most important cash commodities for Chena district farmers. Analysis of determinants of household level honey supply was found to be important to identify factors constraining honey market supply. From the survey result, the variation in volume of honey supplied at households’ level was found to be high and logarithmic transformation was implemented to reduce the variation (Appendix Figure 2). Interpretation of OLS estimates is possible if and only if the basic assumptions of multiple linear regression model are satisfied. Thus, after regression of OLS model existence of multicolliniarity between the hypothesized explanatory variables, heteroscedasticity, omitted variable and normality problems were checked. Accordingly, the test for multicollinearity in Appendix Table 1 suggests that there is no serious problem of multicollinearity among explanatory variables since the mean VIF value was less than 2 (Gujarati, 2004). The omitted variable bias test with Ramsey RESET test (F (3, 138) = 1.03; prob > F= 0.3831) shows absence of omitted variable in the model indicating that the model has no problem of omitted variable bias (Appendix Table 2).
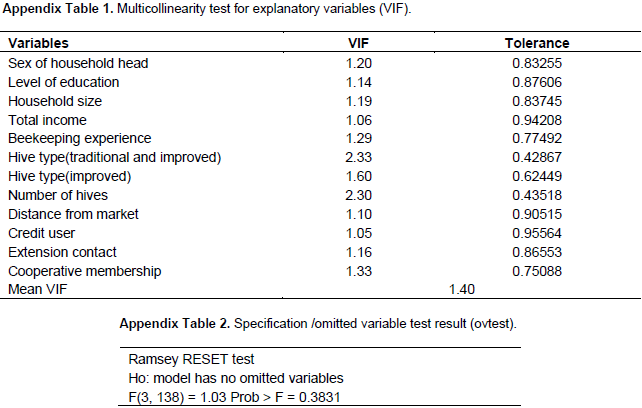
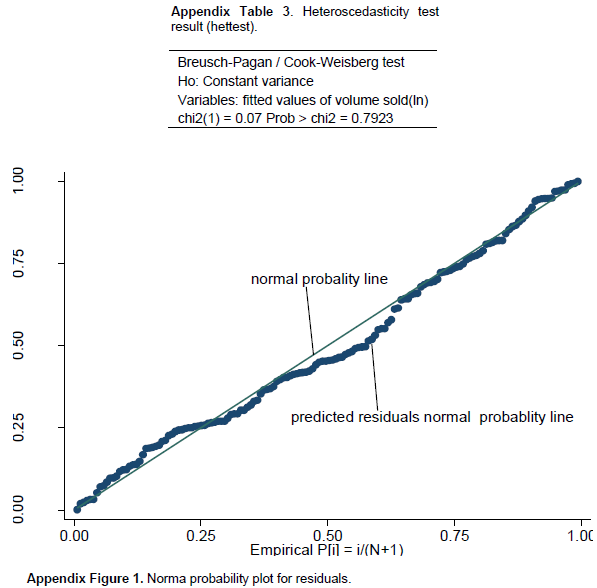
Heteroscedasticity test was performed using Breusch-pagan/Cook-Weisberg (chi2 (1) = 0.07; prob > chi2 = 0.7923); suggests that the errors are of the same variance (Appendix Table 3). Thus, the null hypothesis that the errors have constant variance is accepted. In addition, normal probability plot for residuals shows error terms are normally distributed as the normal probability plot for residuals approaches to normality line (Appendix Figure 1). The fitness of the model (Adjusted R2) was 0.82 that passed the tests and indicating about 82% of the variation in volume of honey supplied to the market by households was explained by the variables included in this model. Among the hypothesized eleven variables included in the regression model, six variables were found to be significantly affected the market supply of honey at household level. These are experience in beekeeping, frequency of extension contact, number of beehives owned, type of beehives used, cooperative membership and distance to the nearest market (Table 4).

Beekeeping experience (EXPBK)
The model result showed that beekeeping experience of households significantly and positively affected quantity of honey sold at 1% significance level. Thus, the result implied that, as beekeepers experience increase by one year the quantity of honey supplied to market increased by 3.89%, keeping others factors constant. This means that the beekeepers with more experience in honey production and marketing have higher ability to produce honey in turn sell more than less experience because they have more knowledge in bee management and marketing network. This is in line with finding of Samuel (2014), and Betselot (2012) who illustrated as beekeepers experience increased the volume of honey supplied to the market increased.
Type of beehive used (TBH)
This is a categorical variable that affects positively decision to sell how much of the honey produced. The model result shows that using both improved and traditional beehives affected quantity of honey supplied significantly and positively at 5% level of significance. While using only improved beehive affected volume of honey marketed positively at 1% level of significance. Thus, as compared to those households who use traditional beehives, the volume of honey supplied to market increase by 15.3% for those households who used both traditional and improved beehives and 29.5% for those households who used improved beehives. This implies that honey producers possessing improved beehives produce better volume of honey than those who use the traditional one. Hence, the more they produce the more they tend to supply to the market. Betselot (2012) confirmed that improved beehives allow honey bee colony management and use of a higher-level technology with larger colonies and can give higher yield and quality of honey thus in turn increase market supply.
The number of beehives owned (NBHO)
t is proxy variable for quantity of honey produced and positively influence the volume of honey supplied to market at 1% significance level. This indicates that producer with more number of beehives can harvest more volume of honey and not only having of better marketable surplus but will able to sell more. The model result indicated that as the number of hives used increased by one, the volume of honey marketed increased by 1.35 percent. Kerealem et al. (2009) confirmed that the use of large number of hives directly related with the amount supplied to the market and return earned by beekeeper. This result is also in line with finding of Getachew (2009).
Frequency of extension contact (EXTCONT)
It was positively and significantly related to the volume of honey supplied to the market at 10% significance level. The positive and significant effect was mostly due to the reality that beekeepers who frequently contact extension worker concerning beekeeping particularly about modern honey production, harvesting and handling methods contributed to increase the amount of honey supplied to market. The model result predicts that increase in number of extension contacts per year by one in relation honey production, increases the amount of honey marketed by 3.25%. This suggests that frequent extension contact avails information regarding improved technology which improves production that in turn affects the marketed surplus. The result is consistent with earlier results of Getachawu (2009), Betselot (2012) and Samuel (2014).
Distance from the nearest markets (DNM)
It affected the volume of honey supplied to market negatively and significantly. The model result indicated that, keeping other variables constant, as the distance of the farmers’ residence from the nearest market increases by one kilometer, the volume of honey supplied decreased by 10%. This may be due to the fact that as the farmers reside far from the nearest market the transport cost for selling their output would be high. This implies that as the distance from the nearest market increases, transport costs and loss due to handling increase and this may discourages producers from selling high volumes of honey. The result is consistent with the findings of Biruk (2015) and Efa et al. (2016).
Cooperative membership (COOPM)
It influence positively and significantly the volume of honey marketed at 1% level of significance. As compared to those households who are not member of cooperative, for those household who are members of cooperative, the volume of honey marketed increased by 58.4%. Being a member of producer group motivates farmers to supply more by giving technical advice, input and up to date information provision to members (Adeoti et al., 2014). Study by Shewaye (2015) also confirmed that being membership of cooperative could have better access to market information, inputs, technical advice and access to credit facilities which grid towards increments of output that in turn increase volume of supply to market.
CONCLUSION AND RECOMMENDATIONS
The result of the multiple linear regression model indicated that beekeeping experience, beehive types used, number of beehives owned, frequency of extension contact and cooperative membership determined the quantity of honey supplied to the market positively and significantly. Moreover, distance to nearest market affected the quantity of honey supplied to market negatively and significantly. Producer with more number of beehives can harvest more volume of honey with better marketed surplus. Nevertheless, simply increasing number of beehives cannot be an option to increase honey market supply since volume of honey harvested from traditional beehive is low. Hence, increasing number of improved beehives to increase volume of honey per hive is better alternative to increase market supply. So, there is a need for intervention to increase number of beehives owned by increasing access to improved beehives and access to credit services. In line with this, bringing beekeepers under more extension contact in the existing technology at hand and improving technical knowhow of beekeepers on using best practices of the experienced beekeepers as a point of reference can help beekeepers to increase their level of honey market supply.
Finally, cooperatives motivate producers to supply more by giving technical advice, input and up to date information to members which grid towards increments of output that in turn increase volume of honey supply and improve bargaining power of producers in time of selling their produce. Hence, strengthening of the existing honey cooperatives by building financial capacity and creating linkage with processors, motivating non-members to become members of cooperatives and establishment of additional honey cooperatives is suggested. Furthermore, the concerned bodies need to intervene in improving poor road facility and poor transport accessibility to supply their product and establishing honey collection points across rural areas will assist beekeepers for faster delivery of honey.
The authors have not declared any conflict of interests.
The authors would like to thank the sampled households and experts of Chena district livestock and fishery office. The financial support of Southern Agricultural Research Institute is gratefully acknowledged.
REFERENCES
|
Adeoti AI, Issack B, Oluwatayo S, Raheem O (2014). Determinants of market participation among maize producers in Oyo state, Nigeria. Brit. J. Econ. Manage. Trade 4(7):1115-1127.
Crossref
|
|
|
|
Assefa A (2009). Market chain analysis of honey production in Atsbi Wemberta district, Eastern zone of Tigray region, Ethiopia. MSc Thesis, Haramaya University, Haramaya, Ethiopia.
|
|
|
|
|
Awraris G, Amenay A, Hailemariam G, Nuru A, Dejen A, Zerihun T, Asrat T (2015). Comparative analysis of colony performance and profitability of different beehive types in Southwest Ethiopia. Glob. J. Anim. Sci. Res. 3(1):178-185.
|
|
|
|
|
Awraris G, Yemisrach G, Dejen A, Nuru A, Gebeyehu G, Workneh A (2012). Honey production systems in Kafa, Sheka and Bench-Maji zones of Ethiopia. J. Agric. Ext. Rural Dev. 4(19):528-541.
|
|
|
|
|
Betselot M (2012). Honey value chain analysis with especial emphasis to Ada'a district, East Shoa zone of Ethiopia. MSc Thesis, Haramaya University, Haramaya, Ethiopia.
|
|
|
|
|
Biruk J (2015). Value Chain Analysis of Bee Honey and Credit Market Participation of Bee Keepers: The Case of Damot Gale District, Southern Ethiopia. MSc Thesis, Haramaya University, Haramaya, Ethiopia.
|
|
|
|
|
Centro International de Agricultural Tropical (CIAT) (2004). Increasing the Competitiveness of Market Chains of Smallholder's Producers. Manual, 3: Territorial Approach to Rural Agro Enterprise Development Project.
View
|
|
|
|
|
Chena District Finance and Economic Development Office (CWFEDO) (2016). Physical and Socio-economic Profile of the District.
View
|
|
|
|
|
Desalgne P (2011). Ethiopian honey: Accessing international markets with inclusive business and sector development. SNV, Ethiopia. Available at:
View [accessed on 12 July 2016]
|
|
|
|
|
Efa G, Degye G, Tinsae D, Tadesse K (2016). Determinants of market participation and intensity of marketed surplus of teff producers in Bacho and Dawo districts of Oromia national regional state, Ethiopia. J. Econ. Sustain. Dev. 7(1):13-24.
|
|
|
|
|
Gallmann P, Thomas H (2012). Beekeeping and honey production in southwestern Ethiopia. Ethiopia Honey Bee Invest. pp. 1-24.
|
|
|
|
|
Getachew N (2009). Honey market chain analysis: The case of Burie district, West Gojjam zone, Amhara national regional state. MSc Thesis, Haramaya University, Haramaya, Ethiopia.
|
|
|
|
|
Gujarati DN (2004). Basic Econometrics, 4th edition. McGraw Hill, New York.
|
|
|
|
|
Kassa T (2017). Structure and Conduct of Honey Market in Chena District Kaffa Zone, Southern Ethiopia. World J. Agric. Sci. 13(1):45-52.
|
|
|
|
|
Kassa T, Gonche G Amenay A (2017a). Value Chain Analysis of Honey in Kaffa and Sheka Zones of SNNPR, Ethiopia. Int. J. Res. Agric. Sci. 4(3):142-148.
|
|
|
|
|
Kassa T, Jema H, Bosena T (2017b). Determinants of honey producer market outlet choice in Chena district, Southern Ethiopia: A multivariate probit regression analysis. Agric. Food Econ. 5(20):1-14.
|
|
|
|
|
Kerealem E, Tilahun G, Preston TR (2009). Constraints and Prospects for Apiculture Research and Development in Amhara region, Andassa Livestock Research Center, Bahir Dar, Ethiopia. Available at:
View
|
|
|
|
|
Kifle B, Mebratu G, Kumlachew A (2015). Integrated management of common bacterial blight (Xanthomonas axonopodis pv. Phaseoli) of common bean (Phaseolus vulgaries) in Chena district of Kaffa zone, Southwest Ethiopia. Malays. J. Med. Biol. Res. 2(2):147-152.
|
|
|
|
|
Kaffa Zone Livestock and Fishery Department (KZLFD) (2016). Livestock Extension Profile of the Zone.In: Kassa Tarekegn, Jema Haji and Bosena Tegegne Profitability f Honey Production and honey market performance in Chena District f Kaffazone, SNNPR, Ethiopia. Int. J. Res. Stud. Sci. Eng. Technol. 4(10):30-36
|
|
|
|
|
Ministry of Agriculture (MoA) and International Livestock Research Institute (ILRI) (2013). Apiculture Value Chain Vision and Strategy for
|
|
|
|
|
Nuru A (2007). Atlas of Pollen Grains of Major Honey Bee Flora of Ethiopia: Sixth National Annual Conference of the Ethiopian Beekeepers Association (EBA), June 2007, Addis Ababa, Ethiopia.
|
|
|
|
|
Samuel S (2014). Market chain analysis of honey production in Sodo Zuria district, Southern Ethiopia. MSc Thesis, Haramaya University, Haramaya, Ethiopia.
|
|
|
|
|
Shewaye A (2015). Determinants of haricot bean market participation in Misrak Badawacho district, Ethiopia. MSc Thesis, Haramaya University, Haramaya, Ethiopia.
|
|
|
|
|
Wooldridge JM (2010). Econometric Analysis of Cross Section and Panel Data, 2nd Edition. Cambridge, MA: MIT Press.
|
|
|
|
|
Workneh A (2011). Financial Benefits of Box Hive and the Determinants of Its Adoption in Selected District of Ethiopia. Am. J. Econ. 1(1):21-29.
|
|
|
|
|
Yamane T (1967). Statistics: An Introductory Analysis, 2nd Edition. New York: Harper and Row.
|
|
|
|
|
Yoshimasa I (2014). Local honey production activities and their significance for local people: A case of mountain forest area of Southwestern Ethiopia. Afr. Study Monogr. 48:77-97.
|
|