ABSTRACT
The water scarcity problem is globally getting worse especially in the light of increase in water demand among its competing uses. Thus, it is an important to optimize the water allocation to crops. In this paper, a linear programming model has been formulated to ensure the efficient allocation of scarce water resources among the competing crops. This model was constrained by land, water, labour, production costs, and organization constraints, determining the optimal plan for two possible future scenarios. The mathematical analysis was based on statistical data for the years (2009-2011) from the official statistical institutions in Egypt. The results of the two scenarios are as follows: Under the maximization of the net return per unit of land, there is an increase in total net returns by 3.56% more than the actual net returns. The optimized cropping pattern has been coupled with about 3.24% water saving and about 3.13% reduction in production costs compared to actual cropping pattern. However, under the minimization of irrigation water requirements, the total net returns decreased by 10.20% indicating losses below the actual situation. It has resulted in about 11.05% water saving and 11.24% reduction in the costs of production compared to the existing situation. These results can be used as a reference for indicative cropping pattern and irrigation water management in Egypt.
Key words: Linear programming, efficient water allocation, optimal cropping pattern, water management.
Water is one of the most important natural resources for the world’s economic development. In many areas around the world, conflicts have risen due to increase in water demand among its competing uses (World Bank, 2002; Young, 2005). Particularly, agriculture is becoming the sector to which policy makers are pointing out as the core of the water problem (Koundouri et al., 2006). This is clearly the case in Egypt, where water resources are limited to the Nile water. It is the major source of fresh water, supplying 96% of renewable fresh water resources. Egypt relies on the availability of its annual share of Nile water, which is stored in Lake Nasser. This is approximately 55.5 billion cubic meters annually following agreement between Egypt and Sudan in 1959. Water demand is increasing as a result of the rapid population growth, agricultural expansion, as well as industrial development, and higher standards of living. This increase in demand for the limited water resources puts pressure on the decision-makers to formulate policies to improve the allocation of the scarce water resources. Because agriculture is the major water consumer in Egypt, it will be important to ensure efficient allocation of irrigation water resources.
Linear Programming LP is a widely used mathematical modelling technique to determine the optimum allocation of scarce resources among competing demands. Some examples are presented. Kheper and Chaturvedi (1982) applied a linear programming model to make decisions about options of groundwater management in conjunction with optimal cropping pattern and production functions of water. Panda et al. (1983) applied linear programming models for conjunctive use of surface and groundwater to canal command area of Punjab by adopting an optimal cropping. Further, to resolve the complex problem of irrigation management within a large heterogeneous basin, Paudyal and Gupta (1990) applied a multilevel optimization technique. They determined the optimal cropping patterns in various sub-areas of the basin, the optimal design capacities of irrigation facilities, including surface and groundwater resources, and the optimal allocation policies of water for conjunctive use. Mainuddin et al. (1997) used an LP model to determine the cropping pattern to ensure optimal use of available land and water resources in a groundwater irrigation project.
Various reports (Amir and Fisher, 1999; Al-Weshah, 2000; Salman et al., 2001; Singh et al. 2001; Samei Tabieh, 2007) address optimal cropping pattern and optimal allocation of water by using LP model. They observe considerable improvement in the economic return as well as in the utilization of land and water resources by adopting an optimal cropping pattern. Abdelaziz et al (2010) obtained the optimal cropping pattern in North Darfur state, Sudan using the Linear Programming (LP) technique. The optimal plan was different from the farmers' plan. The LP model resulted in a profitable objective function while the farmers' plan gained a loss. Igwe et al. (2011), argue that linear programming technique is relevant in optimization of resource allocation and achieving efficiency in production planning particularly in achieving increased agricultural productivity. They applied LP technique to determine the optimum enterprise combination. The actual land use and the optimum plan were tabled. The results from optimum plans were more superior.
The objective of this paper was to develop a LP model based on an economic efficiency criterion for determining optimal water allocation and crop combination. Specifically, there are three aims for this paper as follows: First, understanding the actual patterns of water allocation and crop production in Egypt. Second, examining the economic analysis of water use in crop production. Third, developing an optimization model to ensure the efficient allocation of water resources among the competing crops. This is to serve as a tool for policy makers of indicative planning in irrigation management in Egypt.
Model specification
Linear Programming (LP) is a mathematical technique well suited for such a study because of the following reasons: Many activities and constraints can be considered at the same time, secondary explicit and efficient optimum seeking procedure is provided, results from changing variables can easily be calculated once formulated (Hazell and Norton, 1986). Therefore, linear programming is used to make decisions ensuring optimal allocation of water.
The currently most used algorithm in Linear Programming LP software is the Simplex Method which was developed during the Second War in 1974 by a Northern American scientist staff, and has been published afterwards. However, breakthrough in terms of correlated algorithms efficiency only could be observed in the 1980 through developed studies. Nowadays, LP is broadly used around the world and can be applied for different objectives such as maximize net income or minimize costs, losses etc. The General Algebraic Modelling System (GAMS) modelling language is used to calculate the optimal solutions (Brooke et al., 1998). It is preferred for this study because of its flexibility, and it is easy to apply for modellers familiar with such language.
The objectives of the model tries to achieve are related to maximizing the net return and/or minimizing the use of water resources. The mathematical formulation of the applied model includes the following components.
The objective function
The model is to determine the optimum allocation of water resources among competing activities via optimal cropping pattern. It is assumed that the decision maker has perfect knowledge and that there is no risk. The model was applied in two possible future scenarios in accordance with objective function as the following:
Scenario 1: The model employed maximizes net return subject to a set of constraints on cultivated areas, water resources, and other constraints. The optimal number of Feddans of each crop depends on the total amount of water and the crop water requirement. The decision makers choose the optimal number of Feddans of each crop for which the optimal quantity of water will be applied. The maximization of net return per unit of area is equivalent to the maximization of net return per unit of water. Therefore, the objective function of LP is to maximize the net return per unit of land from all crops. This can be written as:

Scenario 2: LP model is formulated to suggest the optimal cropping pattern for minimizing the amount of irrigation water used. This scenario modeled a situation of water scarcity in time of drought or a reduction in water supply for agricultural expansion of new lands. This model is to inform decision makers about the impact of a reduction in water supply on crop production. In this case, the objective function is to minimize the total amount of water used for irrigation as follows:
The constraints
The previously stated objectives are subjected to sets of constraints that are to be satisfied within the model, which include the following.
Land area constraints
This implies that the sum of areas allocated to crops in a certain season must not exceed or equal the total land area available for that season. The mathematical illustration of the land resource constraints is presented as follows:
The total available cropped areas for the modeling was about 11540 thousand Feddan, representing about 90.06% of the total cropped area of the years (2009-2011) in Egypt. It is distributed over the 3 seasons of the year: 6272 thousand Feddan for winter season and 4858.63 thousand Feddan for summer and 409.56 thousands Feddan for Nili seasons, representing land restrictions. Due to the limitations of the data on fruits and other field crops that occupied an area of less than 1000 Feddans, they are excluded from this study.
Water constraints
The availability of water for irrigation from the Nile water source is limited. Since the amount of water available and water requirement of the crops are different in any month of the year, it is essential for water constraint to be monthly considered. So allocation of water must not exceed the available water in a month. Assuming that there is no recharge of Nile water during irrigation season, water constraints can be written as follows:

is a vector of the total irrigation water availability in month

The total annual volume of water for the modeling amounted to about 36.7 billion m
3 accounting for 90% of the total irrigation water used at the field level as average of the years (2009-2011). It was distributed over the 12 months, representing monthly water restrictions, after excluding the quantity of water resources available for crops that are not included in the models.
Labor constraints
Labor demand per month for all crops should not exceed the total number of labor days available in that particular month; these constraints can be written as follows:
The total annual number of labor days for the modeling amounted to about 790 million days. It was distributed over the 12 months, representing monthly Labor constraints.
Production cost constraints
The value of production cost for all crops should not exceed the total cost of production for the actual cropping pattern; this constraint can be represented for each input as follows:
Where

is input-output coefficient that states the production cost to produce one
Feddan of crop

represents the value of inputs quantities used in actual cropping pattern.
Organisation constraints
Management considerations restrict minimum and maximum value for areas under crops to ensure the supply of the minimum quantities of food commodities and avoid deficiencies and marketing problems. The lower limitations on corresponding acreage were based upon the minimum levels of historical cultivation over the five years (2007-2011) for each crop. On the other hand, to prevent one high value crop from dominating the maximum benefits maximum areas should be considered for each crop. These constraints can be expressed mathematically:
The constraint states that the algorithm must not allocate negative amounts of land use in order to optimize the objective function.
Data sources
This study is mainly based on published and unpublished statistical data from the Ministry of Agriculture and Land Reclamation (MALR, 2009, 2010 and 2011), the Ministry of Water Resources and Irrigation (MWRI), and the Central Agency for Public Mobilization and Statistics (CAPMAS), Egypt. The technical coefficients that quantify resource requirements are determined as a weighted average for real values of the most recently available three years (2009-2011). Moreover, individual crops are subject to organization constraints, which are the upper and lower limitations.
Egypt’s water resources and demand
The main source of fresh water for Egypt is Nile River. Egypt relies on the availability of its annual share of Nile water that is stored in Lake Nasser. That is approximately 55.5 billion cubic meters annually by agreement between Egypt and Sudan in 1959.
The 1959 Agreement was based on the average flow of the Nile during the period 1900-1959, which was 84 billion m3/year at Aswan. Average annual evaporation and other losses from the High Dam Lake were estimated to be 10 billion m3/year, leaving a net usable annual flow of 74 billion m3/year. It was agreed that 18.5 billion m3/year is allocated to Sudan and 55.5 billion m3/year to Egypt (International Water Law, Documents, http://www.internationalwaterlaw.org/documents/africa.html#Nile).
The groundwater aquifer underlying the agricultural lands of the Nile Valley and the Delta is entirely recharged and is dependent on deep percolation of irrigation water and seepage for the irrigation system. It cannot, therefore, be considered as an independent resource. And it cannot be added to the country water resources but rather be considered as a reservoir in the Nile River system. The total groundwater abstraction was estimated about 5.9 billion m3/year as average of the period of 2009-2011. For the re-use of agricultural drainage water, the permitted total amount of the recycled water in the Nile Delta is about 7.5 billion m3/year as average of the period of 2009-2011 (CAPMAS, 2009, 2010 and 2011). Sanitary drainage water is used in agriculture and tree planting after treating it to meet the specifications. Some amount of the treated water was about 1.3 billion m3/year used in irrigation in specific locations outside the greater Cairo regions. Rainfall on the Mediterranean coastal strip decreases from 200 mm/year at Alexandria to 75 mm/year at Port Said. It also decreases inland to about 25 mm/year near Cairo. The average total amount of rainfall is about 1.30 billion m3/year. This amount cannot be considered a reliable source of water due to a high spatial and temporal variability.
From the above, the actual water resources currently available for use in Egypt are 55.50 billion m3/year and 1.3 billion m3/year effective rainfall on the northern strip of the Delta, while water demands for different sectors are about 76 billion m3, comprising of agriculture, industrial and municipal demand of 61.63, 1.33, and 10.43 billion m3, respectively (CAPMAS, 2009, 2010 and 2011). The gap between the water supply and water needs is overcome by recycling.
Irrigation water requirements for actual cropping pattern
Allocation patterns of irrigation water use
Table 1 shows the irrigation water use for major crops in the current cropping pattern according to the season of cultivation at the field. The total water needs of summer crops was the highest, followed by winter crops and Nili crops, representing 62.59, 34.62 and 2.80% of the total irrigation demand, respectively, as shown in Figure 1; Winter Crops: Total area under winter crops was about 6.271 million Feddan. The corresponding water use reached about 13596 million m3. Wheat and perennial clover are determined to be the most water consuming crops in winter season, as the irrigation requirements for these crops reached about 5377 and 4619 million m3, respectively, representing 14.57 and 12.52% of the total irrigation requirements at the field level, respectively. Summer Crops: The area under summer crops amounted to 5.178 million Feddan and its annual water use reached about 21004 million m3. Rice, maize, sugarcane, cotton, and sorghum are found to be the most water consuming crops in the summer season. The irrigation requirements for these crops amounted to 8879, 5363, 3065, 1154 and 1097 million m3, respectively, representing about 24.06, 14.53, 8.31%, 3.13 and 2.97% of the total irrigation requirements, respectively. Nili Crops: Area under Nili crops was about 0.409 million Feddan. Maize is the most water consuming crop in the Nili season, consuming 748 million m3. This represented about 2.03% of the total irrigation requirements.

Crop water requirements
Crop water requirements used in the study were directly taken from Government figures available and published by the Central Agency for Public Mobilization and Statistics (CAPMAS). The data on irrigation requirement are available as annual figures, and it is assumed that these annual requirements can be allocated over the months of plant growth-cycle. For modelling purposes, the computations of monthly irrigation water requirements were carried out by multiplying the theoretical monthly percentage crop consumptive water use by annual irrigation requirement. The theoretical consumptive water use is compiled by Water Management Research Institute (WMRI) in Egypt. Figures 2 and 3 show monthly water requirements of major winter and summer crops in Egypt, respectively.


Table 2 indicates that the average water consumption per irrigated Feddan. Perennial clover is considered the most water consuming crops in winter season, as the irrigation requirements for this crop was about 2917 m3. Sugar cane and rice had the highest water consumption per Feddan in summer season. Their water requirements amounted to about 9573 and 6294 m3, respectively.
Economic analysis of water use in crop production
Table 2 reports the profitability to scarce factors land in LE/Feddan and water in LE/1000 m3, in which net return per unit of land and water are calculated based on the farm prices. The most profitable crops in winter season were winter tomatoes, garlic, onion, and perennial clover with net return of 9316, 11919, 6520, and 6191LE/Feddan, respectively. For the summer crops: Summer tomatoes were also the most profitable, with net return of 9600 LE/Feddan. Summer potatoes cane was among the next most profitable crops, with net return of 6212 LE/Feddan. The net returns were 4522, 2716 and 1975 LE/Feddan for peanut, rice and cotton, respectively.
For net return per unit of water, it is observed that the most profitable crops in winter season were winter tomatoes and garlic with net return per unit of water of 4438 LE/1000 m3 and 3675 LE/1000 m3, respectively. For the summer crops: tomatoes and potatoes were also the most profitable, with net return of 3106 and 2010 LE/1000 m3, respectively.
Virtual water represents the amount of water needed to raise a certain quantity of food (Allan, 1999). The "virtual water" concept can contribute to a change in water.
The basic linear programming model solutions
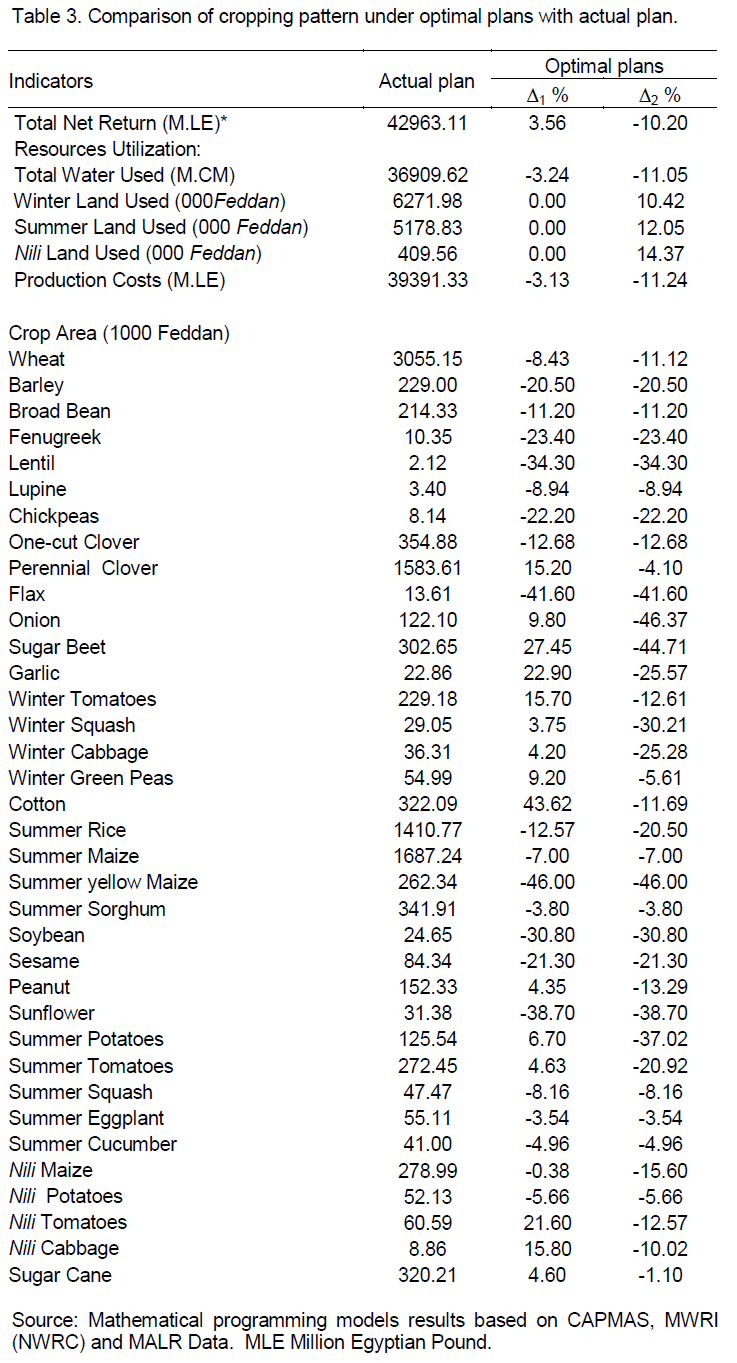
The LP model is used to determine the optimal allocation and crop pattern of the different crops. In order to calibrate the model, the actual cropping plan for the reference average of years (2009-2011) is compared with the results generated by the models. Table 3 compares the optimal values of the net return, land, water and crop areas in the two scenarios vs. the actual cropping pattern in 2011.
Scenario 1: Maximizing the net return
The outputs of maximization model are shown in terms of percentage change of actual values. In winter season, the area under wheat declined by approximately 8.43% below its actual cropped area. Similarly, area under one-cut clover and broad bean decreased by 12.68 and 11.20%, respectively. However, there was an increase in area under perennial clover by about 15.20% above the current area. Area under sugar beet and winter tomatoes would increase by 27.45 and 15.70% above its actual area because of their high profitability. In summer season, area under rice and summer maize decreased by 12.57 and 7.0%, respectively, below existing area, while summer potatoes and tomatoes would increase by 6.70 and 4.63%, respectively. Nili potatoes and Nili maize crops could decline, while Nili tomatoes and Nili cabbage crops would increase in the optimal plan. Because of its high profitability, sugar cane recorded an increase in the optimal solution at 4.60%.
The results showed the great potential to generate a net return equivalent to about 3.56% more than the actual total net returns. The optimized cropping pattern in Egypt has been coupled with about 3.24% saving in the water use and about 3.13% reduction in the production cost compared to the existing plan.
Scenario 2: Minimizing the amount of irrigation water used
The objective function of this scenario is to minimize the amount of irrigation water used taking into consideration the same specified constraints. This model is useful in informing water policy makers about the impact of water cuts on the crop production in old lands. The results show that the cropping pattern changes in favour of less water demanding crops. Also, cultivated winter and summer areas would decline by 10.42 and 12.05% below the basic level, respectively. This means that the fallowed lands appeared due to water becoming scarcer. Consequently, cropped area under most of the crops decreased. Area under wheat would decline by 11.12% below the current area allocated to wheat in winter season. Area under one-cut clover and perennial clover decreased by 12.68 and 4.10%, respectively. There was a decrease in area under sugar beet by about 44.71% below the actual area. Despite the high profitability of winter tomatoes, its area declined by 12.61% below the basic level due to its high water requirement. Area under cotton recorded also a decrease in the optimal solution at 11.69%. Similarly, in the summer season, area under rice and summer maize would decrease by 20.50 and 7.00% below the actual cropped areas, respectively. This may be attributed to more water consumption for these crops in relation to their net returns. Area under summer potatoes and tomatoes would decrease by 37.02 and 20.92% below the actual area, due to their high water requirements compared to other field crops. Area under Nili maize, Nili potatoes, and Nili tomatoes crops would decrease in by 15.60, 5.66 and 12.57%, respectively.
The results show that the total net returns decreased by 10.20% below the actual total net returns. The optimized cropping pattern in Egypt has been coupled with about 11.05% saving in the water use and about 11.24% reduction in the production cost use compared to the existing plan.
Regarding to the results of above analysis, the following conclusions can be summarized:
1. The model for maximizing net return produced an optimal allocation of water and cropping pattern that gives higher net return compared to the existing plan,
2. Land resource under maximization of net return, had an optimal use, where it is fully used,
3. There is a need for the governmental co-ordination in crop production ensuring the supply of food commodities and avoiding marketing problems.
4. Minimizing of irrigation water requirements is generally difficult. The policy had negative impacts on farm income, the irrigated area decreased and fallow lands appeared.
Several recommendations, based on the results can be made for the future water policies as follows:
1. In order to improve water allocation, farmers should be advised to follow the indicative optimal cropping pattern, which maximizes the net income return.
2. Cultivation of sugarcane in Egypt should be reduced based on minimum requirement of raw material for sugar processing plants.
3. Cultivation of rice should be restricted.
4. The Government of Egypt should encourage utilization of new irrigation technologies.
5. The applied model can be used to provide useful information to decision makers about likely optimal allocation policies for irrigation.
The authors have not declared any conflict of interest.
REFERENCES
|
Abdelaziz HH, Abdalla AA, Abdellatif MA (2010). Optimizing the Cropping Pattern in North Darfur State. Sudan: A Case Study of Dar Elslam District. J. Appl. Sci. Res. 6(2):156-164. |
|
|
|
AL-Weshah RA (2000). Optimal use of irrigation water in the Jordan Valley: A Case Study. Water Resourc. Manage. 14:327–338. |
|
|
Amir I, Fisher FM (1999). Analysing agricultural demand for water with an optimising model. Agric. Syst. 61(1):45-56.
Crossref |
|
|
|
Brooke A, Kendrick D, Meeraus A, Raman R (1998). GAMS: A User's Guide, GAMS Development Corporation. Washington. D.C. |
|
|
|
CAPMAS (2009). Central Agency for Public Mobilisation and Statistics. Annual Bulletin of Irrigation and Water Resources. Egypt (In Arabic). |
|
|
|
CAPMAS (2010). Central Agency for Public Mobilisation and Statistics. Annual Bulletin of Irrigation and Water Resources. Egypt (In Arabic). |
|
|
|
CAPMAS (2011). Central Agency for Public Mobilisation and Statistics. Annual Bulletin of Irrigation and Water Resources. Egypt (In Arabic). |
|
|
|
Hazell PBR, Norton RD (1986). Mathematical Programming for Economic Analysis in Agriculture. MacMillian Publishing Company. New York. |
|
|
|
Igwe KC, Onyenweaku CE, Nwaru S (2011). Application of Linear Programming To Semi-Commercial Arable And Fishery Enterprises in Abia State. Nigeria. Int. J. Econ. and Manage. Sc. 1 (1): pp.75-81. |
|
|
|
International Water Law (Not dated). African regional documents, Addressing the future of water law and policy in the 21 st century.
View
|
|
|
Kheper SD, Chaturvedi MC (1982). Optimum Cropping and Groundwater Management. Water Resourc. Bull. 18(4):655-660.
Crossref |
|
|
Koundouri P, Nauges C, Tsouvelekas V (2006). Technology Adoption under Production Risk: Theory and Application to Irrigation Technology. Am. J. Agric. Econ. 88(3):657-670.
Crossref |
|
|
Mainuddin M, Gupta AD, Onta PR (1997). Optimal Cropping Planning Model for an Existing Groundwater Irrigation Project in Thailand. Agric. Water Manage. 33(1):43-62.
Crossref |
|
|
|
MALR (2009). Ministry of Agriculture and Land Reclamation. Economic Affairs Sector. Agricultural Statistics Bulletin. Egypt. |
|
|
|
MALR (2010). Ministry of Agriculture and Land Reclamation. Economic Affairs Sector. Agricultural Statistics Bulletin. Egypt. |
|
|
|
MALR (2011). Ministry of Agriculture and Land Reclamation. Economic Affairs Sector. Agricultural Statistics Bulletin. Egypt. |
|
|
|
MWRI, NWRC (Unpublished). Ministry of Water Resources and Irrigation. Egypt. National Water Research Centre. Data. |
|
|
|
Panda SN, Kaushal MP, Kheper SD (1983). Irrigation planning in a command area in a project: An application of deterministic linear programming. J. Agric. Eng. ISAE. 10(2):47-60. |
|
|
Paudyal GN, Gupta AD (1990). Irrigation management by multilevel optimisation. J. Irrigat. Drain. Eng. ASCE. 116(2):273-291.
Crossref |
|
|
Salman AZ, Al–Karablieh EK, Fisher FM (2001). An inter–seasonal agricultural water allocation system (SAWAS). Agric. Syst. 68:233-252.
Crossref |
|
|
Singh DK, Jaiswal CS, Reddy KS, Singh RM, Bhandarkar DM (2001). Optimal cropping pattern in a canal command area. Agric. Water Manage. 50:1-8.
Crossref |
|
|
|
Tabieh MAS (2007). An optimal irrigation water allocation model: Management and Pricing Policy Implications for the Jordan Valley. Thesis for the Degree of Doctor of Philosophy Economics–Econometrics. University Sains Malaysia (USM). |
|
|
|
World Bank (2002). Water priority for responsible growth and poverty reduction: An agenda for investment and policy change. Washington. D.C: World Bank. |
|
|
|
Young RA (2005). Determining the Economic Value of Water: Concepts and Methods. Washington D.C: RFF Press. |