The study evaluated the socio-economic viability and factors influencing profitability of apple enterprise under smallholder farming system in Uganda. A sample of 52 apple farming households was randomly selected in the districts of Uganda: Kabale, Kisoro, Kanungu and Rukungiri. Data were collected with the use of structured questionnaires, and analyzed using descriptive statistics, gross margin analysis and multiple regression model. The results showed that apples were planted on small scale with only 6% of land allocated to total apple enterprise in 2011. However, land allocation to apple enterprise is increasing and the enterprise currently covers 20% of farm lands. The dominant varieties among apple farmers are Golden Dorset, 56.1% and Anna, 40.9%. Men constituted 74.5% of the apple farmers, while the mean age of apple farmers was 57 years, with an average experience of over 10 years. Gross margin of apple enterprise in Kabale and Kanungu district had a positive ratio of return on investment of 1.5 and 1.7, respectively. Kisoro and Rukungiri districts had a negative ratio of return on investment of (0.9 and 0.3, respectively). Ordinary least squares (OLS) results indicated that the gender of the respondent, family size, access to credit, influence of birds, type of apple variety, number of apple trees planted, amount of labor used and quantity of inorganic fertilizers applied were significant determinants of net income in apple production. There is need to reduce the labor costs in apple establishment and management, promote strategies that encourage the youth to participate in apple farming. Research has to come up with an effective but affordable remedy against the negative influence of birds in apple production. Farmers need to be linked to financial providers for credit access at low interest rate in order to facilitate routine apple management practices.
Apple is one of the most popular fruit trees in the World, China is the lead producer followed by European Union (EU) and then United States (FAO, 2016; Wang et al., 2016). Africa contributes 1.43% of the total world apple production with South Africa being the major producer (649,218 tonnes). Other apple producing countries in Africa include, Morocco (466,437 tonnes), Egypt (436,931 tonnes), Algeria (364,750 tonnes) and Tunisia (96,000 tonnes) (FAOSTAT, 2013). In Uganda, the apple industry started in 1999 when the Forestry Resources Research Institute (FORRI) and Kawanda Agricultural Research Institute (KARI) initiated trials in the highlands of South-Western Uganda, with the aim of offering farmers an alternative source of income (ICRAF, 2003b). Over the last 7 years, temperate fruit types namely apples, pears, peaches, nectarines, plums, grapes and figs were introduced and evaluated for suitability and productivity in Uganda (Namirembe et al., 2006). At present, apple production lies with small-holder family farmers in the highlands of South-Western Uganda. Two temperate fruits: apples and pears, show potential for adaptability and economic productivity in the zone (Chemining’wa et al., 2005). Although, apple enterprise has become a gainful cash crop for the people of South-Western Uganda, its production in South Western Highlands Agro-ecological Zone (SWHAEZ) and Uganda at large is still at a subsistence level. The enterprise has over the years seen increasing investments in production, purchase and distribution of apple seedlings to farmers across the SWHAEZ in order to foster adoption of apple growing for income generation.
Nonetheless, the country has continued to rely on the importation of the fruits from Kenya and South-Africa to meet the increasing domestic demand. Uganda imports over 15,000 tons of apples every year (MAAIF, 2012). Given that 1 tonne has 1000 kg, 1 kg has an average of 7 fruits, and each fruit is sold at 700 shillings at wholesale price. Therefore, each year, Uganda roughly loses over 73 billion shillings importing apple fruits without considering juices and other concentrates (MAAIF, 2012). Evidence available indicates that performance of apples has continued to fall both in terms of production and profitability as most farmers continue to abandon their orchards. Attempts to ascertain this general understanding has been limited to factors influencing profitability of the enterprise as more studies have concentrated on production side (Ntakyo et al., 2013). This study assessed the socio-economic viability of apple enterprise, the socio-economic and farm specific factors that influence its profitability in South Western Highlands Agro-ecological Zone of Uganda. The information generated will guide farmers on ways to improve apple productivity and profitability in the study zone.
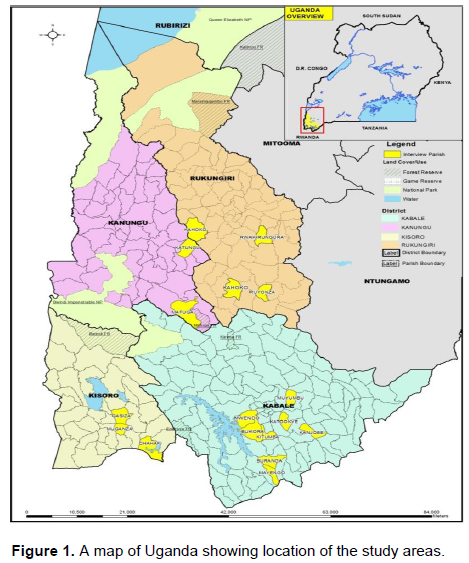
Description of the study area
The study was conducted in four districts of Kanungu, Kabale, Kisoro and Rukungiri which lie within the south-western highlands agro-ecological zone (SWHAEZ) of Uganda. The SWHAEZ has predominantly high altitude ranging from 1200 to 2350 m above sea level. The area has agro-climatic conditions that favor a wide range of crops and livestock, as a major source of livelihood for the inhabitants (Wagoire and Kashaija, 2008). The zone receives bimodal rainfall pattern ranging from 1000 to 1500 mm and temperature range is 10 to 30°C. The population density is about 300 persons km2 with population growth rate of 2.2%, which has continued to exert pressure on land, making it the most limiting resource in agricultural production. Chemining’wa et al. (2005) states that the soils in Kigezi are acidic to slightly acidic loams, reddish brown clay loams, humus loams and yellowish red clay loams with generally a good nutrient supply and with natural fertility and good drainage. The variations in cropping systems are result of the differences in agro-ecological conditions and socio-economic endowments within the districts in the zone (Figure 1).
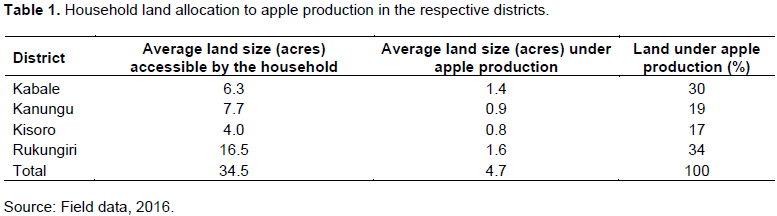
The findings on the size of land accessible by apple farming households seem to indicate that the farmers involved in the study generally had sizeable land at their disposal. Table 1 shows that the average size of land owned by farmers involved in the study from the four districts was about 34.5 acres. Farmers from Rukungiri and Kabale districts had the highest proportion of land under apple production as compared to their counterparts in Kisoro and Kanungu.
Sample size and selection strategy
The study was carried out on 52 apple farming households that are spread in the districts of Kanungu, Kabale, Kisoro and Rukungiri that form SWHAEZ. The study used multi-stage sampling technique. The first stage was purposive selection of four (4) districts and three (3) sub-counties in each district on the basis of concentration of apple production. The second stage involved purposive selection of atleast two parishes from each of the apple producing sub-counties. The third and final stage involved random selection of at least 35% of apple producers from each parish, making a total of 52 apple farming households for the study. The study used both secondary and primary data in order to meet the study objectives. Qualitative and quantitative primary data was collected through interviews structured to accommodate various categories of respondents. Secondary data was obtained from production, economic and demographic literature from agriculture research stations and national data were consulted to enrich the study. Data collected were subjected to analysis using STATA package version 12.0 to generate descriptive statistics. Input and output data were subjected to gross margin analysis. Multiple regression model was used to determine the factors influencing profitability of apple enterprise.
Analytical technique
Gross margin analysis
Gross margin (GM) was calculated as the gross income of an enterprise minus variable costs. The following mathematical equation illustrated this relationship.
Where GM is the gross margin in Uganda shillings per hectare, is the farm gate price of crop product, Y is the quantity of fruits produced per hectare in a given time period, is the farm gate price of a given input used to produce crop output Y and is the cost of the variable input used per hectare.
Variables used
Farm gate prices of the fruits: The prices used for the apples harvested from the farmer’s field were prices that the farmer received at the farm gate.
Fruit yields or output: Apple yield was determined on a seasonal basis of the crop. The crop experiences two seasons in the zone, the high production and the low production. The quantities generated for the two seasons were summed to obtain quantities for the whole year.
Costs of inputs: The costs of different inputs used in apple production were determined; that is costs of family labor, costs of hired labor, costs of material inputs such as fertilizers, agro-chemicals. Family labor cost in crop production was calculated as the total value of man-days that the household allocated to the production of a hectare of an enterprise. Total household man-days were calculated as the sum of all labor hours that household members allocated to an enterprise.
Multiple regression model
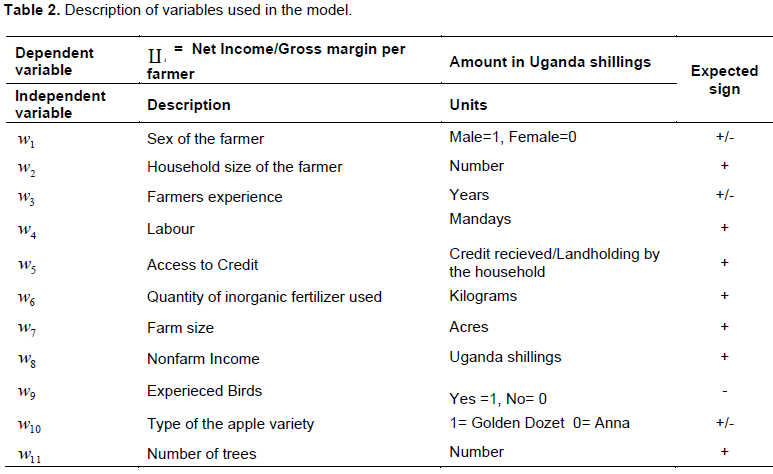
A multiple regression model was used to determine the factors influencing profitability of apple enterprise in SWHAEZ. Multiple regression model was selected because it allows for explicit control of factors which simultaneously affect the dependent variable in this case, the gross margin per farmer (Table 4). According to Wooldridge (2004), multiple regression models can accommodate many repressors that may be correlated hence helps to infer causality where simple regression analysis would be misleading. The model was implicitly specified as:
Pi = f (W1, W2, W3, W4, W5, W6, W7, W8, W9, W10, W11, µi) (2)
Where, Pi = Net income or gross margin per farmer as the dependent variable; independent variables included; W1 = sex of the farmer; W2 = household size; W3 = farmer’s experience; W4 = labor (Mondays); W5 = access to credit (ratio of credit received to landholding by the household); WW6 = quantity of inorganic fertilizer used (kg); W7 = nonfarm income (Uganda shillings); W8 = farm size (acres); W9 = influence of birds (dummy variable); W10 = type of apple variety (dummy variable); W11 = number of apple trees; µi = error term. Refer to Table 2 for description of variables.
The implicit function was linearized and specified in a log linear form (Oluwasola and Ige, 2015) as:
LnP = b0 + b1 W1 + b2 W2 +… +b11 W11+ µi (3)
According to Gujarati and Porter (2003), the disturbance term is expected to fulfil all the assumptions of the classical regression model except that of homoscedasticity which breaks down when cross sectional data is used. The technique of ordinary least squares (OLS) was used to estimate the multiple regression equation. Selection of the variables used in the regression model (ii), and the a priori expectations were based on the assumptions that in traditional and nearly subsistence farming, enterprises are characterized by resource poor farmers (Table 3). The study adopted a semi-log function other than linear and log-log function to minimize multi-collinearity problem that could arise due the interrelationships among the independent variables. Two diagnostic tests were also utilized such as link test for specification error and heteroscedasticity to guarantee validity and reliability of the results.
General description of a pple farmers
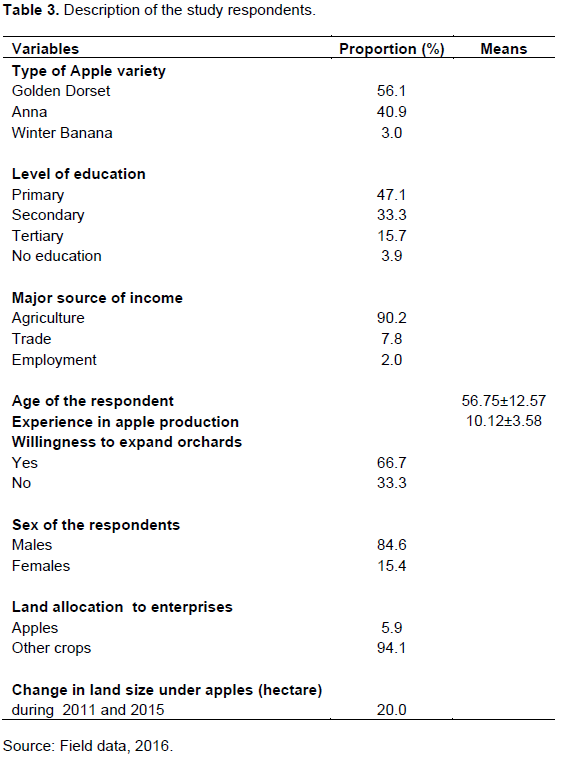
Information on demographic characteristics of the respondents of interest were: type of apple variety grown, education level, major source of income, sex, age category, membership to a group, land allocation to household enterprises and changes in land size under apples. Table 3 summarizes the findings on these characteristics.
Table 3 indicates that 56.1% of the farmers grow Anna, 40.9% Golden Dorset and 3% Winter Banana. The proportion of farmers that are growing Anna and Golden Dorset varieties as compared to Winter banana is high. These varieties are high yielding, have ability to produce more scions and have been widely popularized (Chemining’wa et al., 2005). The findings indicated that 96% of the respondents had attained some level of formal education and 4% had never attended any formal education. Among those that had attained formal education, 47% had attained part or full primary level education, 33% had attained part or full secondary education and only 16% had been to a tertiary institution.
These levels of education of the respondents indicate that almost all the respondents were able to read and write. As expected, 90% of the respondents had agriculture as their major source of income. The other 10% of the respondents regarded non-farm activities as their major source of income. The dominance of agriculture as a major source of income is attributed to the fact that agriculture is the source of livelihood for the people of Uganda (MoFPED, 2014). However, the 10% of the respondents who actually consider non-farm activities as their major source of income confirms the fact that farmers have multiple livelihood sources which may either compete or complement farming.
Our results indicate that the proportion of youth involved in temperate fruit farming in SWHAEZ is generally low. The average age of the farmers was 57 years. Less involvement of the youth in apple growing is probably due to limited ownership of land, preference for white collar jobs and quick paying enterprises. This is in line with the findings by Ahaibwe et al. (2013) in a study on youth engagement in Agriculture in Uganda. This is a potential threat to the current and future production of apples in SWHAEZ. The routine management practices for optimal production of apples require substantial labor which can easily be provided by the young people. It is therefore likely that because most of the farmers are aging, they may not have the needed energy to do all the recommended routine management practices. This implies that they either spend too much on hired labor or they simply ignore some of the practices. A few women (16%) own apple orchards as compared to 94% of the men and yet they contribute the bulk of labor in apple management. This could be due to lack of land ownership in particular (Ellis et al., 2006). A total of 67% of 52
farmers were willing to increase on the number of apple trees in their orchards. This could be those farmers that have already benefited from the apple enterprise. However, 33% (a third) noted that they were not willing to increase on the number of apple trees due to limited land, labor intensive, pests and diseases. As evidenced from Table 3, other crops and apples were occupying 94 and 6%, respectively of the total land owned by the farmers. Overall, change of land size over time under apple farming of 20% is still very low. This indicates that the proportion of the land that farmers had allocated to apples and orchard expansion was very low across the surveyed districts. This may be due to long maturity period of apples as compared to other enterprises coupled by lack of knowledge on apple management.
Profitability analysis
Averagely farmers from Kabale district obtained a gross margin of 15,756,250 Uganda shillings and this was realized after 2014 and each farmer from Kanungu district in 2011 was able to realize 7,399,030 Uganda shillings above the costs invested in establishing and routine management of apples (Table 4). This could be due to the proximity of the apple farmers to the research station for ease to access quality apple seedlings and technical backstopping. In Kisoro and Rukungiri districts, apple enterprise was yet to recover about 11,554,000 and 35,987,157 Uganda shillings, respectively of the total costs invested in the establishment and routine management. The returns on investment of apples from Kabale and Kanungu were positive as compared to Kisoro and Rukungiri (Table 4). The results suggest that apple enterprise is economically viable in Kabale and Kanungu.
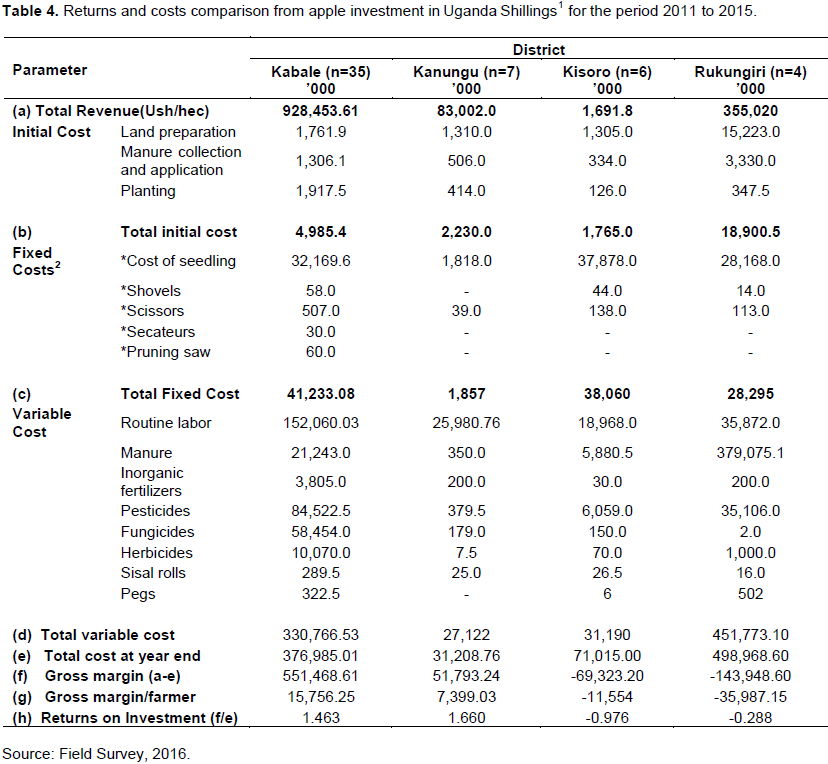
All financial parameters are expressed in Uganda Shillings (UgX, 000) (1 US dollar ($) = 3320 UgX at time of the study in 2016). The total costs also do not include the costs of some equipment because these could not solely be attributed to apples since farmers reported that they were also using these implements on other enterprises
With regard to cost categories, routine labor, seedling costs, manure, pesticides and land preparation were the major costs in apple production as compared to cost of pegs, sisal rolls, scissors, secateurs, shovels and initial planting (Table 4). Routine labor, manure and pesticides were the variable costs in management of apples and thus these costs are always incurred by the farmers. The initial high seedling costs are attributed to the high cost of seed for generating rootstocks and technical procedures involved in the entire seed production process. This makes it difficult for private individuals with low incomes to invest in generating apple seedlings in order to meet the seedling demand.
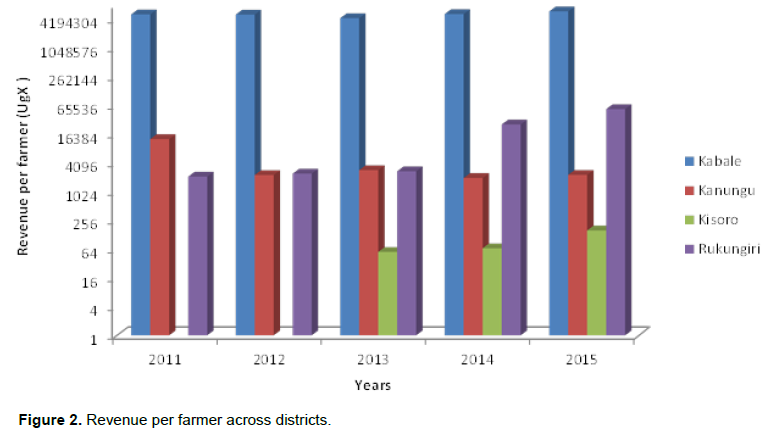
The revenue per farmer had an increasing trend for each district from 2011 to 2015 except for the Kabale district where the revenue decreased from 2011 to 2013, then an increase was noticed from 2013 to 2015 (Figure 2). Across the five years, farmers from Kabale district had the highest revenues as compared to Kanungu which had the lowest revenue in question (Figure 2). The high revenues reported by farmers from Kabale district indicate that farmers managed well their apple orchards as compared to farmers from other districts. It is true that Kabale pioneered apple production and they had gained experience and recovered initial investment costs (ICRAF, 2003b). Apple farmers in Kanungu, Kabale and Rukungiri had recovered the initial cost of establishment and routine management in 2011, 2014 and 2015, respectively, while Kisoro had not yet recovered by the time of the study (Figure 2). The slow recovery of the initial costs and routine management costs is attributed to low adoption of apple management practices arising from delay in recruiting extension service providers that were meant to offer the necessary technical advice and support to farmers.
Regression diagnostics
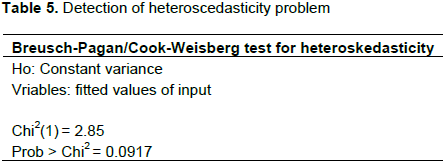
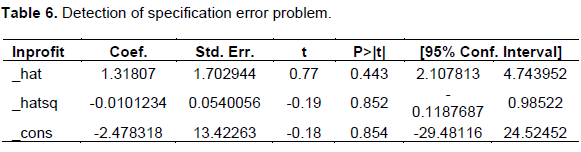
To ensure that the regression model was correctly specified and in line with the assumptions of ordinary least squares (OLS), two diagnostic tests, hetero-scedasticity and specification error were conducted. The regressions results obtained by the OLS method were subjected to heteroscedasticity hettest and specification link test for specification error. The data was checked for heteroscedasticity which is a violation of one of the assumptions of OLS in which the error variance is not constant. Heteroscedasticity is usually a problem in cross sectional data and the data used is no exception. The respective null hypotheses are that, there is no specification error and the residuals are homoskedastic (Table 5). Test for heteroscedasticty was conducted using Breusch-Pagan/Cook-Weisberg. Based on the probability value (p = 0.0917) of the Chi-square, the null hypothesis at 10 percent level of significance was rejected, concluding that heteroscedasticity is present. To correct for heterescedasticity problem, robust standard errors were used. The model was also checked for adequacy to ensure it assumed the correct functional form. Results from link test for model specification in Table 6 reveals that in the multiple regression model, the P-values (p= 0.852) of hat squared were not significant at 1% level of significance. This implies that there are no specification errors in the estimating equation hence the model is correctly specified.
The R2 value of 0.5051 indicates that about 50.51% of the variation in net income or profit realized from apple production in South Western Highland Agro-ecological Zone (SWHAEZ) was determined by the combined effects of the independent variables included in the model (W1,…, W11), while the remaining 49.49% of the variation was due to other factors not specified in the model such as distance to the market, post-harvest handling and seasonality among others. This implies that the model fits well the data and this is further confirmed by the significance of F-value (p=0.0000). The independent variables conformed to a priori expectations except labor input and farm size (Table 7). Sex of the apple farmer, family size, nonfarm income, access to credit, labor input, type of apple variety, influence of birds, quantity of inorganic fertilizer and number of apple trees were statistically significant at 1 and 5%, respectively.
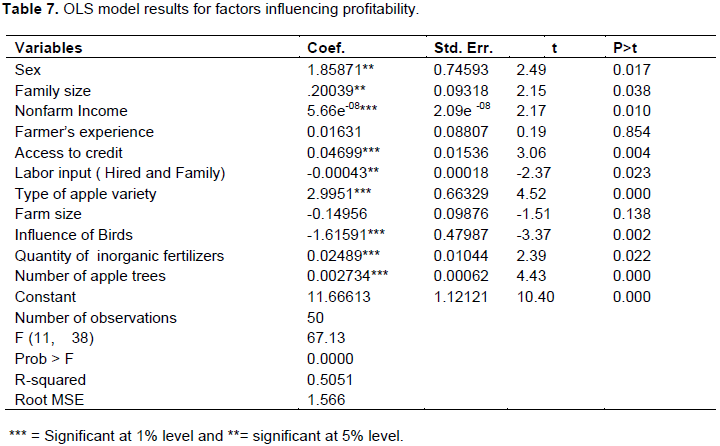
Sex of the farmer being a dummy for 1 = male and 0 otherwise had the expected sign and statistically significant at 5% level. Based on the a priori expectation, it had been hypothesized that due to differential access to productive resources such as land and access to information, males and male headed households would report higher gross margins than females and female headed households. However, the study findings by Oduol et al. (2017) on avocado value chain in Kenya show that where the chain is well developed and the returns are high as in the export avocado chain, women dominate the production stage while men tend to own the fields, make decisions on sales of fruits of premium quality and control revenues.
The coefficient of family size had a positive coefficient which was statistically significant at 5% level. This implies that an additional one able bodied member in the household would increase net profit by 20% holding other factors constant. Members of the household form part of the labor supply, since apples are labor intensive; increase in the number of household members contributing labor can lead to increase in apple yields. This is in line with the studies done by Chidi et al. (2015) and Okorie et al. (2011), who reported that farmers with increased family size obtained higher yields due to increased family labor supply. Increase in family labor reduces the cost of production as it is not paid for.
Non-farm income from off farm activities had a positive significant influence on the net profits per farmer at 1% level. This implies that a million increase in off-farm income in Uganda shillings of each apple farmer leads to a 0.06% increase in the gross margin by holding other factors constant. This further implies that farmers who participate in non-farm activities create spillover effects on the farm income generated. This is re-affirmed by De Janvry et al. (2005) findings in China who revealed that households who participate in non-farm activities, spillovers raise farm income from 2,383 yuan to 7,027 yuan, a 195% income gain. They further assert that participation in non-farm activities helps raise total factor productivity in agriculture by relaxing the constraints on agriculture imposed by credit and insurance market failures.
Labor input had a negative significant influence on the net profits per farmer at 1% level (p=0.005) (Table 7). This implies that an additional one unit of labor reduces the net profit of the apple farmer by 0.05% holding other factors constant. This could arise especially when family labor is absent and the apple farmer is forced to rely on hired labor that is expensive given the labor intensive nature of apples management practices.
Type of apple variety, Golden Dorset other than Anna type is associated with an increased net profit. This could be due to fruit sweetness and fruit color that are appealing and attractive to people. According to Andersen and Crocker (2000), it is crispy and juicy, with excellent flavor and has a large market locally than Anna type.
Similarly, an apple farmer that experienced birds in his or her orchards had a reduced net profit as compared to their fellow counter parts that did not experience them at 1% level. Presence of birds in apple orchards can lead to an increased number of apple fruits being wasted, this reduces the yield potential and consequently the net profit. According to Sergio et al. (2006), bird damage-management strategies may have larger market impacts than those employed for other pests, e.g., insects, due to the greater charismatic appeal of birds.
Access to credits had a positive and significant influence on the net profits of apple farmers at 5%. This implies that a farmer that accesses credit from a financial institution is likely to have increased profits holding other factors constant. Better access to the credit will improve the profitability of a great number of farmers, though not necessarily the poorest. In addition, if credit access were improved, it might activate the rural land markets by allowing farmers to rent in or buy the optimal amount of land (Foltz, 2004).
The study findings also revealed that the number of apple trees were associated with a higher profit margin at 1% level of significance. This implies that increase in the number of apple trees by one unit increases the net profit of the apple farmer by 0.2% holding other factors constant. Different farmers have different number of fruit trees planted. Those with many trees get more yields than those with few trees. Farmers with many trees are encouraged with the number and end up putting in a lot of input in the orchard as compared to those with few trees. The more the input one puts in, the more the yield. This however, depends on different management practices a farmer applies in the orchard.
Quantity of inorganic fertilizers was associated with a positive net profit. This implies that a unit increase in the amount of inorganic fertilizer increases net profit of the apple farmer by 2.5% holding other factors constant. Quantity, type and time of application as well as mode of application of inorganic fertilizers in apple orchards determine apple yields and hence net profit. Some farmers apply fertilizers in their orchards, while others do not. Those who apply fertilizers in their apple orchards get more fruit yields than those who do not apply fertilizers at all. However, increased yields come with increased costs of fertilizer which are covered by the credit repayment. Hence, cost of fertilizer largely offsets the increased revenue and thus profit (Matsumoto and Yamano, 2010).
Apple farming requires high initial investment and routine management costs that might not be recovered in the first few years. This then implies that farmers must have alternative sources of income to invest in the establishment and routine management of apples in the first few years. This study has demonstrated that apple enterprises have the potential to generate profits after few years of farming as has been seen in the case of farmers from Kabale and Kanungu districts.
In order to realize better profits, there is need to search for ways of reducing the costs in apple establishment and management. Routine management costs such as routine labor input need to be reduced and hence labor saving techniques need to be emphasized. The study also calls for research to come up with an effective but affordable remedy against birds. This might require assessment of the different methods used by farmers in the region and beyond, so that an effective and environmentally friendly method of dealing with birds can be identified and disseminated among farmers. Additionally, apple farming is a labor intensive crop which as this study has found is dominated by aging farmers. Strategies of attracting and involving the youth into apple farming need to be explored and implemented. Efforts need to be made to ensure continued availability of quality planting materials to farmers at a cost friendly level to enable those who are willing to expand their orchards to do so with ease. Farmers need to be linked to financial providers for access to credit at low interest rate to meet costs related to acquisition of apple seedlings, agro-chemicals, fertilizer and routine labor. Addressing credit market imperfections will enhance the adoption of apple management practices.