ABSTRACT
Present study was designed to assess the fate, occurrence, spatial and temporal distribution of anthropogenic contaminants in water of Halsi Nala, a major tributary to River Chenab, subjected to different pressures (industrial, agricultural, domestic waste water discharges). As the studied water basin runs through several residential, agricultural and industrial areas, so its water quality affected along its course. Samples were taken from twenty sites during February 2013 to March 2014 and data obtained was analyzed through statistical techniques of multivariate analysis such as Cluster Analysis (CA), Discriminant Factor Analysis (DFA) and Spatial distribution analysis using GIS. Being a sink for domestic and industrial waste, surface water was analyzed for pH, Electrical Conductivity (EC), Total Dissolved Solids (TDS), Dissolved Oxygen (DO), Alkalinity, Turbidity, Temperature (°C), Sodium (Na), Potassium (K), Chlorine (Cl), Calcium (Ca), Magnesium (Mg), Iron (Fe), Lead (Pb), Cadmium (Cd), Chromium (Cr), Nickel (Ni), Copper (Cu) and for Zinc (Zn). Grouping of sites was done into four zones on the basis of spatial variation in water quality using Hierarchical Cluster Analysis (HACA). Most of the parameters were found above permissible limits to WHO (World Health Organization) standards. Variations in water quality were result of anthropogenic activities in catchment of Halsi Nala such as untreated industrial wastes, sewage waste, animal dung and agricultural runoff. Knowing importance of Halsi Nala, being a major tributary to River Chenab, present study thrusts for implementation of proper health measures and making environmental legislation to control degradation of water quality by implanting proper water treatment plants in District Gujrat, an important industrial zone of Punjab Province of Pakistan.
Key words: Heavy metals, spatial map, Halsi Nala, River Chenab, Punjab, Pakistan.
Human intervention in the name of industrial development has resulted in deterioration of all biotic ecosystems and particularly results in chemical contamination in surface water worldwide (Singh et al., 2005a; Gallo et al., 2006). With the alarming rise in population growth and climate change, pollution caused by various pressure factors such as agriculture, domestic sewage, industrial waste water is an issue of great concern and have adverse impacts on the quality of the basins (Bester, 2009; Kern et al., 2009). Freshwater serves as a natural reservoir for heavy metals, municipal, industrial and agricultural wastes.
These trace metals and other municipal wastes are flowed from nullahs and streams to rivers and considered a major threat to aquatic ecosystem that consists of about 95% of species (Shrestha and Kazama, 2007). Heavy metals are non degradable and are found in dissolved as well as suspended particulate matter in all water resources (Lee et al., 2003; Singh et al., 2005b). These dissolved trace metals are used as dietary source for all aquatic life forms and result in bioaccumulation and ultimately bio magnifications (Gafny et al., 2000); Singh et al., 2007). A variation in distribution of heavy metals is recorded at different temporal and spatial sites and results in ground water contamination (Paul and Meyer, 2001). These variations are resulted due to complex processes such as water flow, rainfall, stream discharge, industrial and municipal discharge and precipitation (Honnen et al., 2001; Wright and Welbourn, 2002).
Gujrat is one of the largest cities of Pakistan which is well known for its industrial, agricultural development and urbanization (Qadir et al., 2008; Abbas et al., 2004). Gujrat has 1059 small to large scale industrial units and is considered as the home of shoe, electric fan and motors manufacturing industries. It is densely populated area with above 30% of population is in urban areas (Khan et al., 2003). Its land is most suitable for rice and sugarcane as it is surrounded in northwest by Jhelum River and southeast by Chenab River (Tariq et al., 1996). The average rain fall is 67 cm and temperature in summer sometime rise up to 45°C which in winter even goes lower to 2°C.
Halsi Nala is one of the major tributary of River Chenab. It serves as a natural sink for rainfall, open unlined drains, dung and sewage domestic wastes and most importantly industrial waste water of District Gujrat (Saeedi et al., 2004; Khan et al., 2003). Qadir et al. (2008) and Singh et al. (2005a) reported spatial and temporal variations in surface water quality of River Ravi and Chenab. Standard rules for water quality management in industrial zones are already set by Pakistan Standard Quality Control Authority (PSQCA) and World Health Organization (WHO) (Rothwell et al., 2006; Qadir et al., 2008). There is a need to conduct a thorough and accurate water quality assessment as there is no scientific study conducted for assessment of water contamination in Halsi Nala. To carry out this task, multi-residue methods, which cover several families of organic micro-pollutants as, are needed to obtain realistic results. Therefore evidently, this approach requires adequate instrumentation, capable of acquiring full atomic absorption mass spectrometry with adequate sensitivity, as well as Geographical Information System (GIS) software to process a large amount of data in an automated way as possible.
To assess pollution in these waters, a promising approach would be a spatial distribution analysis supplemented by a Factor analysis. So present study was designed to monitor total water quality degradation and contamination. It highlights the vulnerability level for aquatic ecosystem and thrusts for management programs to be initiated.
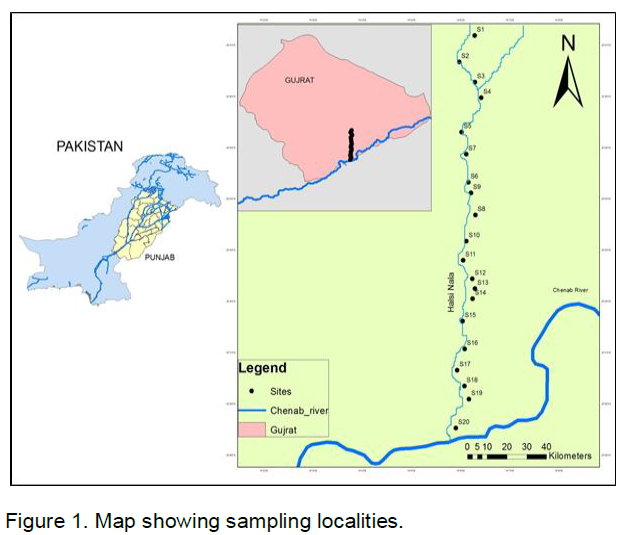
Halsi Nala runs through several residential, agricultural and industrial areas, so it would be expected that chemical water quality is greatly affected along its course. Therefore selection of sampling points, timing of sample collections are more critical factors that needs serious considerations in assessment and monitoring of water quality. Sampling was carried out on monthly basis during February, 2013 to August, 2014 at 32° 37' 11.55"N, 74° 6' 17.28"E to 32° 29' 31.8768"N, 74 5' 54.41"E monthly in a year. Samples were collected from twenty sites that is, end of Fateh pur (S1), Fateh pur Road (S2), Jamal Pur Syedan (S3), Mid of Jamal Pur Syedan (S4), Near JPJ Ring Road (S5), Shadoula Road (S6), Near Moin ud Din Pur (S7), JPJ Ring Road (S8), Near Gillan Wala (S9), Near Banth (S10), Kalra Punwan (S11), End of Kalra Punwan (S12), Kalra Khasa (S13), Start of Gorali (S14), Gorali (S15), Mid of Gorali (S16), Kathala (S17), Mid of Kathala (S18), End of Kathala (S19), Near Chenab River (S20).
Water samples were collected from active running segment of stream in sterilized polyethylene bottles and stored immediately at 4°C to prevent further degradation. These water samples were analyze for nineteen parameters such as pH, Electrical conductivity (EC), Total dissolved solids (TDS), Dissolved Oxygen (DO), Alkalinity, Turbidity, Temperature (°C), Sodium (Na), Potassium (K), Chlorine (Cl), Calcium (Ca), Magnesium (Mg), Iron (Fe), Lead (Pb), Cadmium (Cd), Chromium (Cr), Nickel (Ni), Copper (Cu), Zinc (Zn).
In order to acquire a comprehensive investigation about the occurrence and concentration level of organic contaminants, information about the temporal and spatial trends along its river course is relevant. Data recorded was statistically analyzed for basic and multivariate statistics by using Statistical Package for Social Sciences (SPSS) and STATISTICA 10. Cluster analysis is a powerful statistical technique used for grouping of all sampling sites on the basis of similarities and spatial repartition based on the quantities of different contaminants. Cluster analysis by using its Hierarchical Cluster Analysis (HACA) approach and discriminate factor analysis (DFA) was used for finding relationship among the studied sites. Different concentrations of heavy metals are drawn for spatial distribution analysis using GIS approach in Arc GIS 10 and shown in Figure 1. It provides a pictorial representation of contaminants concentration at all studied localities and evidently comparisons are possible.
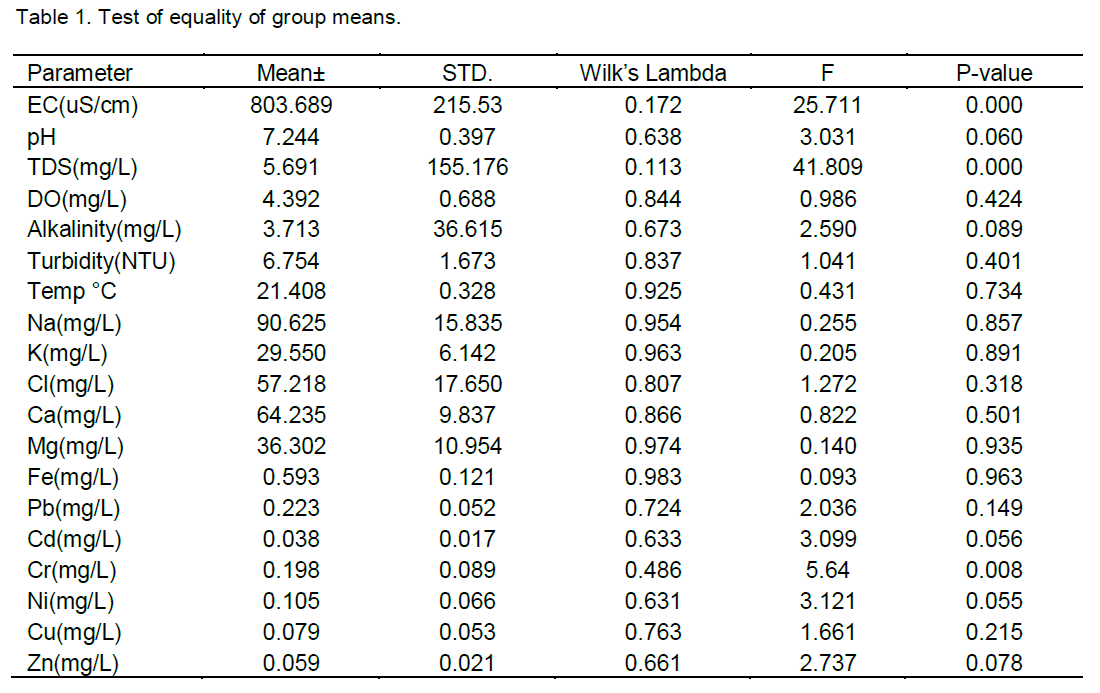
Descriptive statistics for nutrients, metals and physico-chemical parameters was carried out and presented in Table 1. It explain mean and standard deviation of all checked parameters along with test of equality of group means by Wilk’s lambda statistics at p<0.05. Wilk’s lambda can also be used to measure potential of parameters before test of factor analysis (FA). It is observed that Wilk’s lambda values are small, showing strong discrimination between all values.
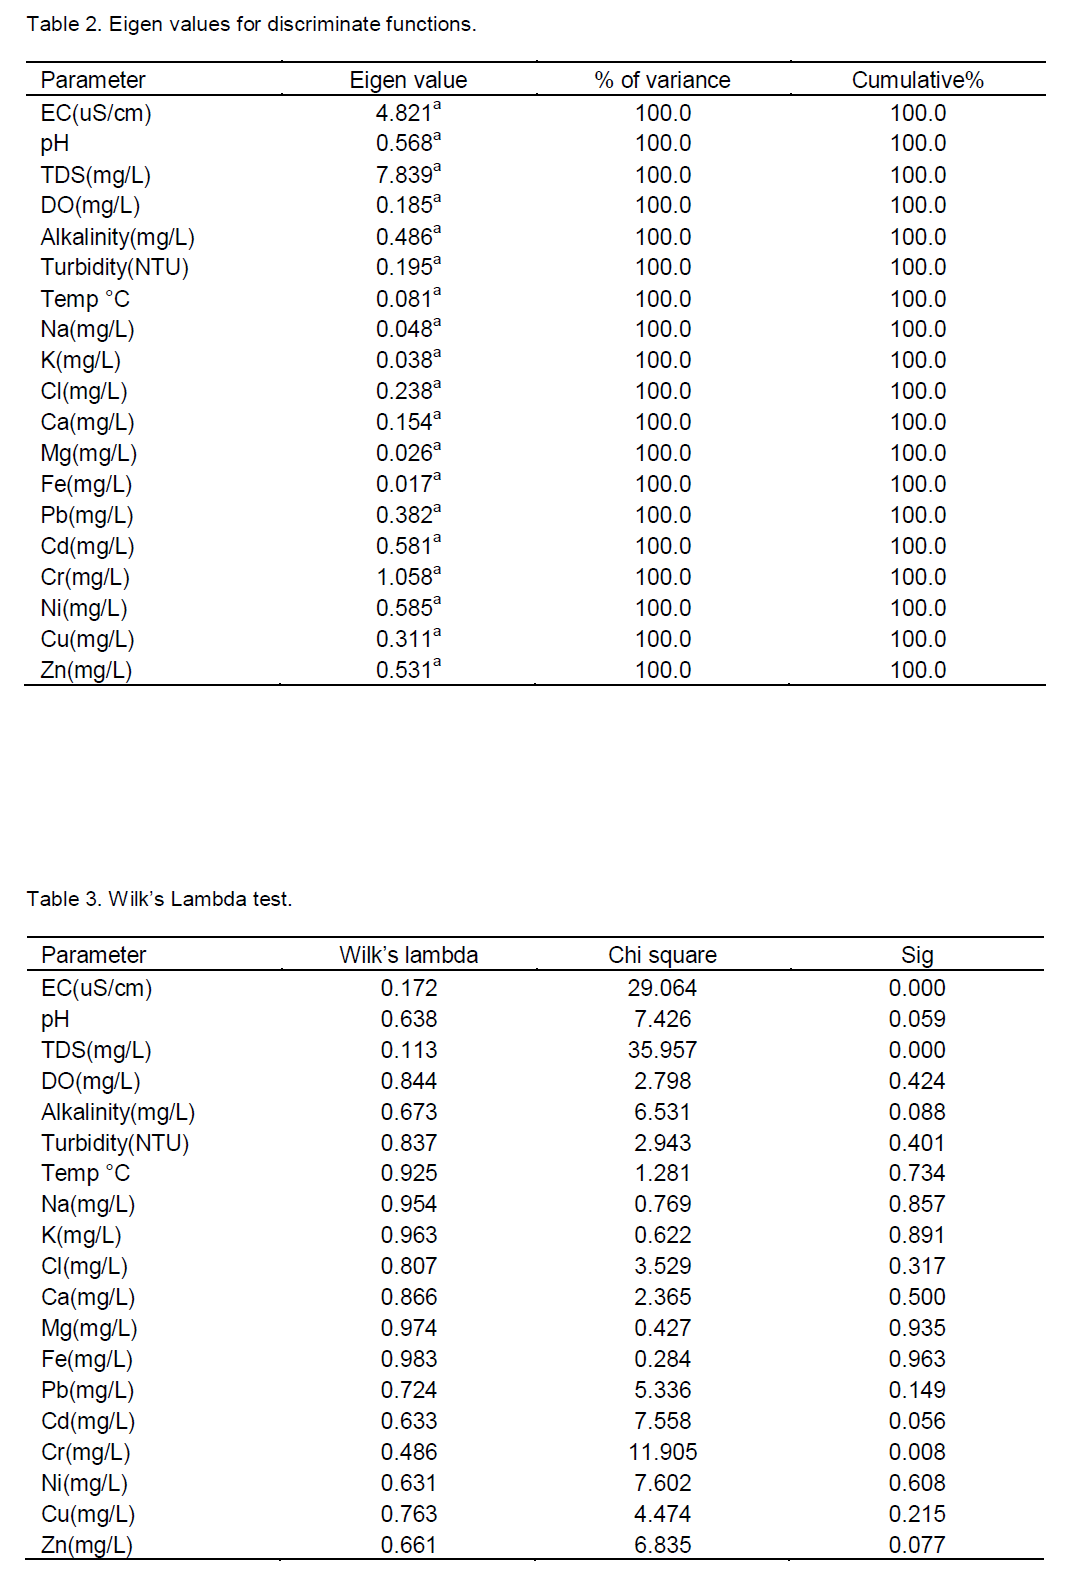
Tables 2 and 3 shows eigen values for all studied discriminate functions and total percentage of variance and cumulative is 100%. While Wilk’s lambda value depicts how well the parameters vary from the other in groups. It also explains variance among the discriminate scores. Table 3 indicates that all values are used for factor analysis and are equal in frequency. By applying Chi square statistics and observing significance value at p<0.05, it can easily be concluded that all discriminate function do better than chance at different spatial sampling sites. It highlights its variance at each spatial and temporal distribution.
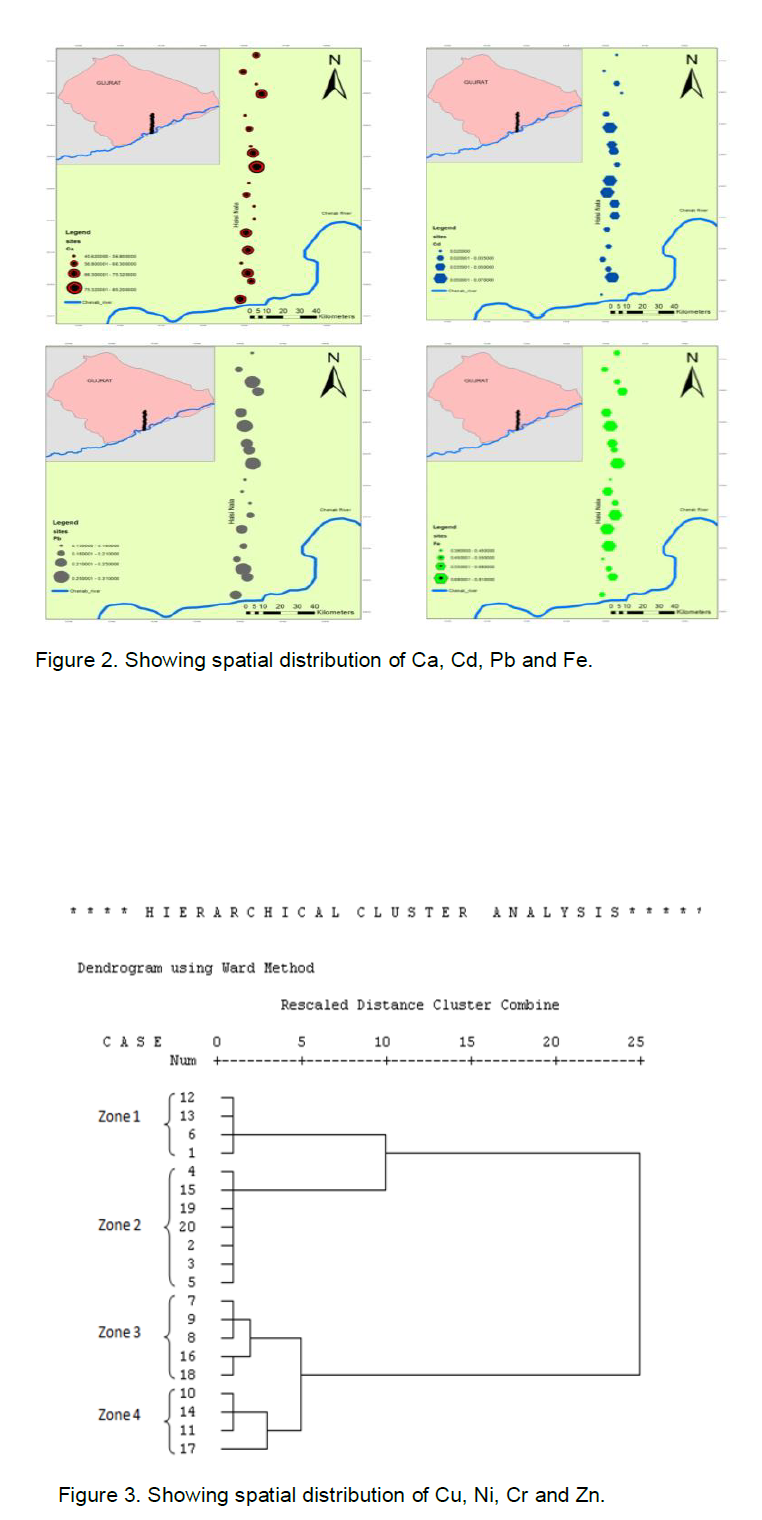
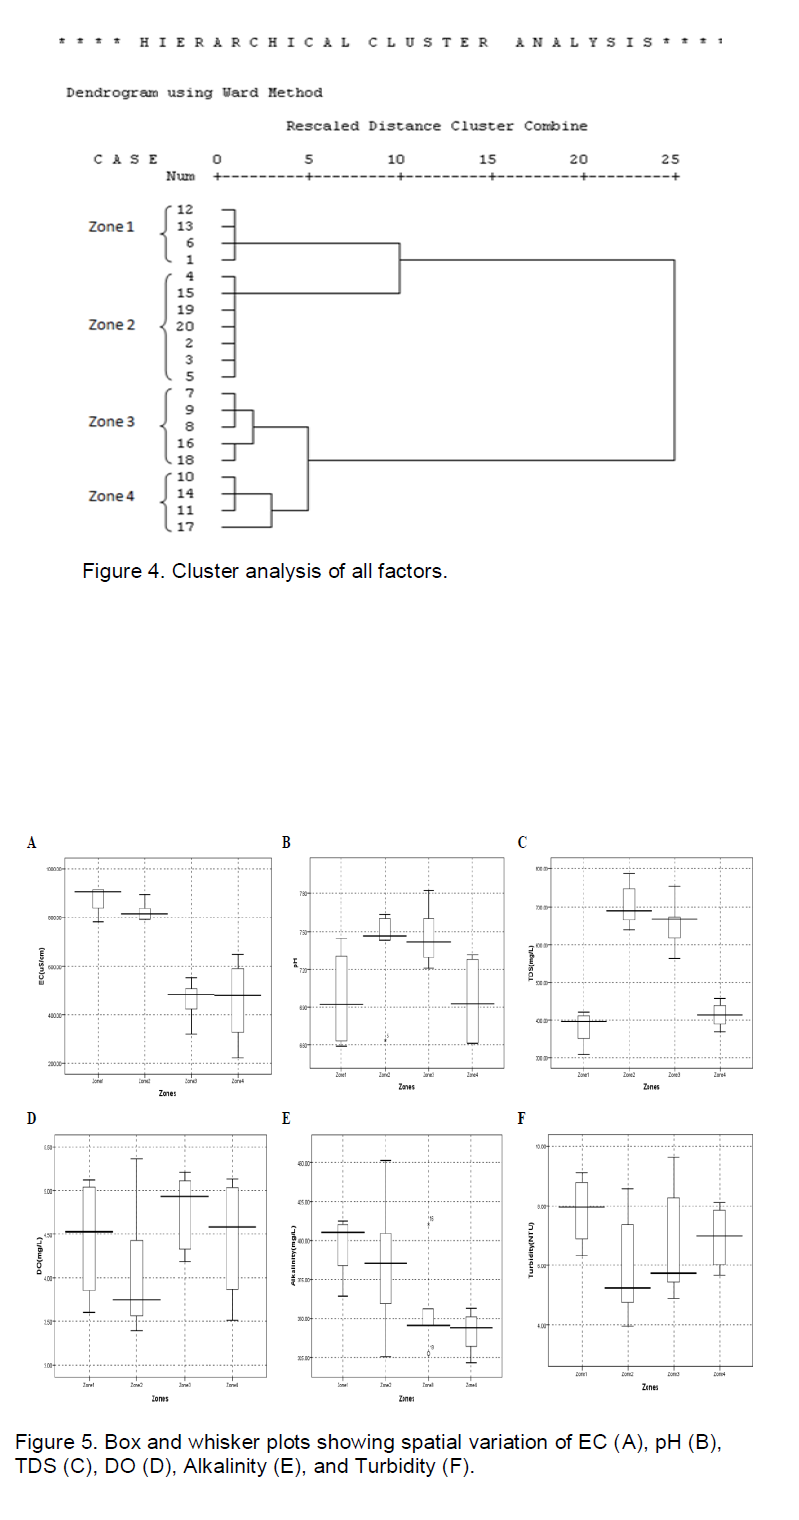
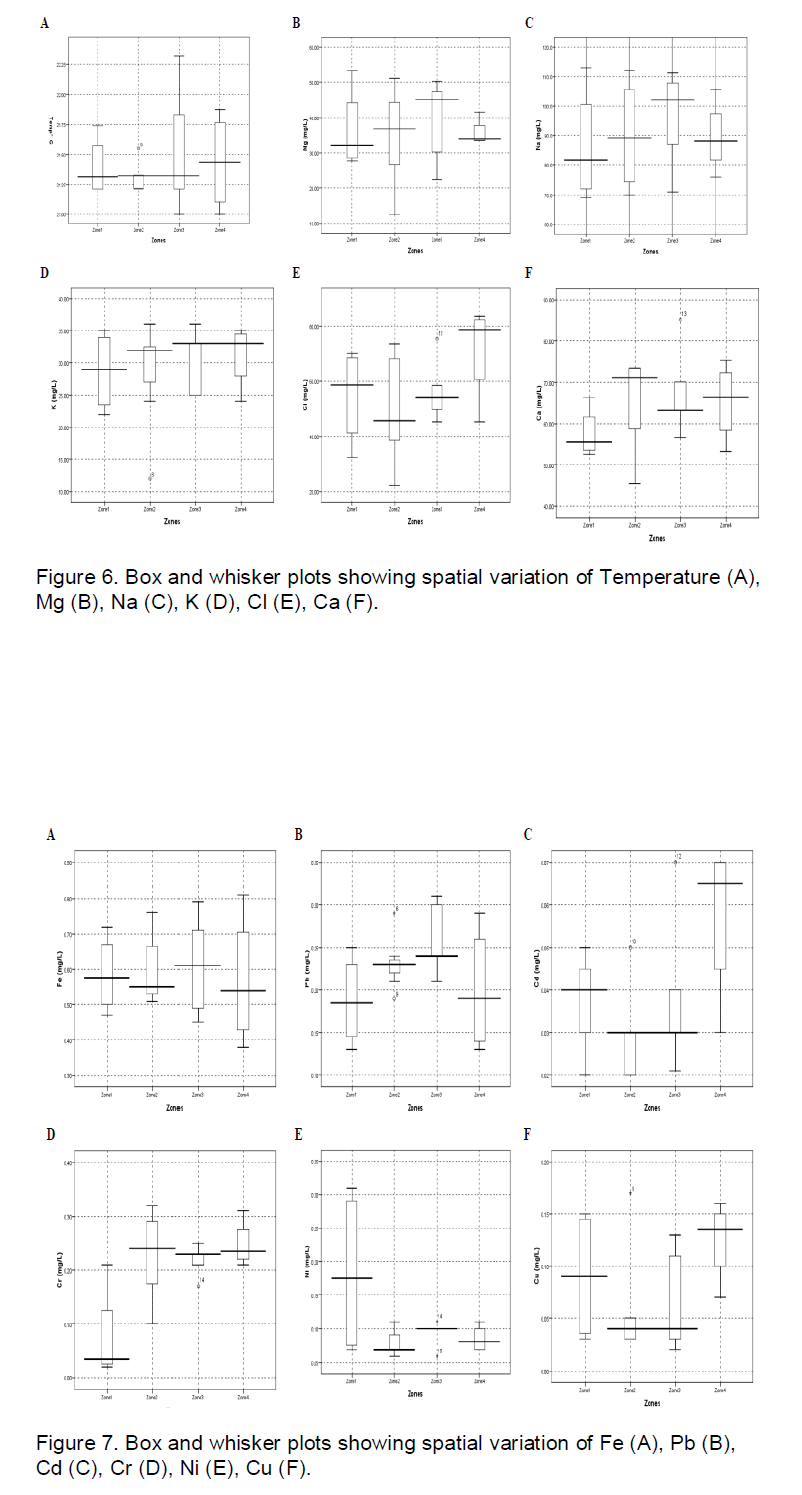
GIS is a database management system used to store, retrieve, manipulate and analysis of spatial data. The four important components of a geographical information system are data storage, data retrieval, data manipulation and data analysis. GIS has the capacity to relate layers of data for the same points in space, combining, analyzing and finally represent it in the map form. Figures 2 and 3 represent spatial distribution through a complete linkage analysis using the Bray Curtis Similarity Measure at all studied sampling localities. For grouping of all studied locations, Cluster analysis was done using statistics of agglomeration schedule and by Ward’s method as a clustering technique and square Euclidean distance as interval. All sampling sites were grouped into four groups (to be called zones here) on the basis of spatial similarities among sites and differences among different groups (zones). Clusters are formulated on the basis of variations in the loads of pollutants at each studied location. The results grouped all sampling localities into four zones and each zone contain following sites: Zone 1 (S12, S13, S6, and S1), Zone 2 (S4, S15, S19, S20, S2, S3, and S5), Zone 3 (S7, S9, S8, S16, S19) and Zone 4 (S10, S14, S11, S17).
Zone 1 and 2 were found less pollutant as these were at a reasonable distance from industries and also receives fresh water from nearby running streams and nullahs. Hence stream quality in these localities was better because pollution load decreases from nearby logged areas. Generally, levels of measured parameters were low in this zone in comparison to other zones. This could be related to the dilution and recharging effects. It is assumed that overall pollutant concentration may decrease as suspended particulate materials mostly settle down at the bottom of the streams with decrease in water flow. While in Zone 3 and 4 heavy loads of pollutants were seen as they were containing higher concentrations of metals and other physic-chemical parameters.
These zones consist of those spatial locations that were in close vicinity of industrial and urban areas. This zone was restricted to those places which were very close to stagnant ponds and seasonal nullahs receiving large volume of effluents and sewage waste throughout the year. Site 10, 11 has a stagnant water pond in which pollutants from urban, industrial waste and agricultural runoff during monsoon are discharged. It is likely that seepage and infiltration of pollutants from this pond affect the quality and purity of groundwater at this site. Site 16, 17 is situated in a densely populated area and surface water channels (seasonal nullahs) pass nearby, receiving pollutants from untreated urban sewage. There is no sewage and industrial effluents treatment to plants for the whole Gujrat District, and untreated waste is disposed directly into open spaces, streams and rivers.
It is a known fact that human anthropogenic activities in catchment areas are major contributing factor for deteriorating water quality. Such catchments receive pollutants from effluents of industries, sewage waste and automobile exhaust that are added by atmospheric rain fall. These areas are located downstream of Gujrat city and receive waste water and sewage throughout the year. The effluents consist of large amount of organic matter which require a rich oxygen supply for its bio degradation and ultimately cause depletion of DO and Low level of DO cause death in fishes and other invertebrates. Presence of PO4-3 in surface water indicates discharge from domestic wastes particularly detergents wash outs and it is found elevated above permissible limits. Certain other factors that may affect total contents of organic matter are the season, average rainfall and stream discharge level. For example highest concentrations for EC, Ca, Na, Pb and Cd were recorded during winter season which gradually reduced from spring season to monsoon. Whereas during the rainfall Halsi Nala stream will flow at high discharge level and dilute the total contents and lower concentrations are recorded (Qadir et al., 2008). For spatial variations among different zones, some important significant parameters are represented by box and whisker plots in Figures 3 and 4. EC provides a rapid and convenient means for estimating the concentration of electrolytes and gives information about all the dissolved minerals. EC of most fresh waters is normally in the range of 50 to 500 mS/cm. Groundwater always has higher EC levels when compared with surface water. The average value of electrical conductivity (EC) was recorded as 800.689 uS/cm which is above permissible limits of WHO standards. The value of EC is relevant to total concentration of sodium ion (Na+) in water and average recorded Na concentration is 90.625 mg/L.
The observed values of pH and Alkalinity of water from all sampling locations is shows water to be slightly acidic. Highest concentration of Dissolved Oxygen (DO) was recorded from zone 4, while in Zone 1 and 2 it was within permissible limits. Depletion of dissolved oxygen was found as a result of presence of high level of organic matter that requires high load of dissolved oxygen for its degradation as documented by Morrison et al.
(1990, 2001) and Gallo et al. (2006).
Calcium is contributed predominantly by clay material, gypsum, and dolomite and by process of weathering from the soil in catchment area of Halsi Nala. As mentioned by Rathowell et al., 2006 concentration of Calcium (Ca) is a measure of total hardness of water and recorded average load of calcium is 64.235 mg/L which is considered as “doubtful” as per rule of WHO (Qadir et al., 2008). Hence it can be concluded that water of Halsi Nala is hard water and is unsuitable for all aquatic life forms. Box and Whisker plots of significant discriminating parameters identified by spatial DA (backward mode) were constructed to evaluate the association of these parameters with spatial variation in groundwater quality (Figures 5 to 8).
Certain other metals and trace heavy metals such as Fe, Pd, Cd, Cr, Ni Mg, Cu and Zn are also observed as in doubtful limits as set by World Health Organizations standards and all these heavy metals are also contributed mainly by agricultural activities by using phosphate fertilizers and use of pesticides. Whereas high level of Fe is released from organic and inorganic matter of municipal waste and rock material along the pathway of this stream (Simeonov et al., 2000). The concentration of TDS was found significantly (p >0.05) different between four zones. Only the values of TDS in Zone 4 exceeded the permissible limited of the PSQCA (100 to 500 mg/L). The level of TDS in groundwater increased due to high concentration of salts and these values were beyond the internationally accepted water quality standards. The pH of the groundwater was in the permissible limits of PSQCA. The chemical and biological properties of water are affected by pH and suitable pH levels have been reported to reduce the corrosion and also helpful in management of water and wastewater treatment processes (Ahmed and Ali, 2000). Turbidity of water contaminants also considered as important parameter to calculate the quantity of coagulants and serve as useful tool to estimate un-dissolved substances. The result of present study implies that the water at the studied localities is highly turbid and cannot be considered safe for drinking purpose.
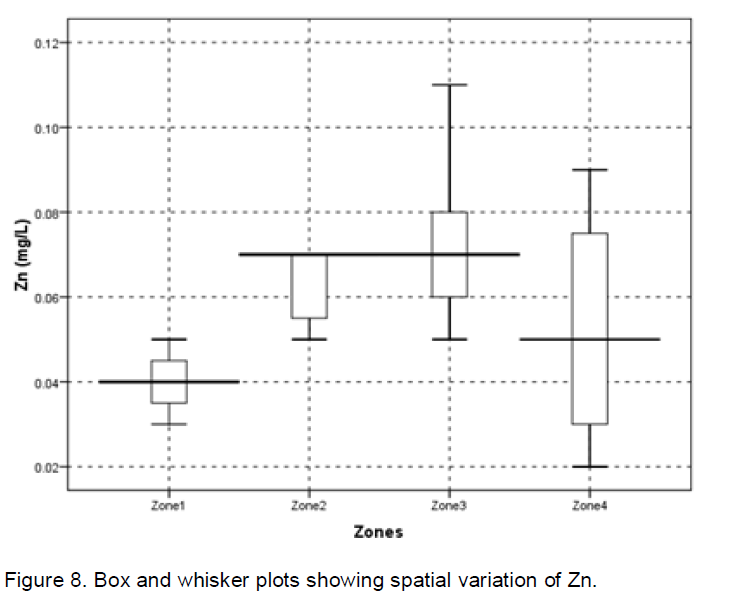
However, overall load of non biodegradable suspended particulate material of Cd, Cr, Ni, Pb and Zn is contributed by lead batteries, industrial effluents, municipal waste, paints and varnishes, discharge from automobile (Temnerud and Bishop, 2005). Lead is found naturally in earth crust in small concentration and it can cause irreversible effects if it is not found in permissible limits (Boman et al., 2000). Concentration of above mentioned heavy metals is recorded above permissible limits and is vulnerable for aquatic ecosystem. The suspended particulate material is degrading water quality and in turn by the process of biomagnifications and accumulation, these toxic heavy metals in fishes and other aquatic invertebrates is a threat for all living organisms in a food chain. Hardness of water was also recorded due to relative high concentrations of calcium and other mineral ions. Studies have shown that this water can be source of number of cardiovascular, gastric diseases, hepatitis, encephaly, nervous system disorder and cancer. The result of this study offers new clues to environmental managers to develop restoration activities with minimum cost and expenditures. It also implies the dire need to conduct a detailed study for assessment of hazardous effects of harmful contaminants on human health.
This study reports the results from a spatio-temporal monitoring of organic contaminants in a river basin termed as “Halsi Nala”. The results show the importance of selecting the appropriate sampling points and timing of sampling collection to monitor the chemical quality of a river basin. The river basin is clearly influenced by wastewater discharges and also by its proximity to agricultural areas. It also highlights increasing aquatic pollution load in district Gujarat as a result of human intervention in the name of industrial development.
This study also presents the usefulness of Multivariate Statistical Techniques in groundwater quality assessment, identification of significant parameters to get better information about pollution sources. The Cluster analysis performed on all water parameters evidently revealed four zones with analogues concentrations of contaminants. It revealed that ground water from these sites requires further purification to ensure its suitability for human consumption. It also points the attention of local and municipal authorities to one of the major issue of water pollution by measuring the water quality and analyzing all physic-chemical parameters and was found unsatisfactory. Water quality has completely deteriorated for all aquatic life forms and need immediate control. It also stresses the dire need of management of municipal, domestic waste sites and for implementing laws regarding disposal of industrial effluents.
The authors have not declared any conflict of interest.
REFERENCES
|
Abbas ST, Mehdi SM, Sarfraz M, Hassan G (2004). Contents of heavy-metals in waters of Nullahs Dek, Bisharat and Aik and their effect on soil-health. Sci. Vis. 9:1-11. |
|
|
Bester K (2009). Analysis of musk fragrances in environmental samples. J. Chromatogr. A 1216:470-480.
Crossref |
|
|
|
Boman BJ, Wilson PC, Ontermaa EA (2002). Understanding water quality parameters for citrus irrigation and drainage systems, Circular 1406, U.S. Department of Agriculture, Cooperative Extension Service, University of Florida, IFAS, Florida, USA. |
|
|
Gafny S, Goren M, Gasith A (2000). Habitat condition and fish assemblage structure in a coastal mediterranean stream (Yarqon, Israel) receiving domestic effluent. Hydrobiology 422/423:319 - 330.
Crossref |
|
|
Gallo M, Trento A, Alvarez A, Enico HB, Campagnoli D (2006). Dissolved and particulate heavy metals in the Salado, River (Santa Fe, Argentina). Water Air Soil Pollut. 174:367-384.
Crossref |
|
|
Honnen W, Rath K, Schlegel T, Schwinger A, Frahne D (2001). Chemical analyses of water, sediment and biota in two small streams in southwest Germany. J. Aqua. Ecos. Stress Recov. 8:195- 213.
Crossref |
|
|
Kern S, Fenner K, Singer HP, Schwarzenbach RP, Hollender J (2009). Identification of transformation products of organic contaminants in natural waters by computer-aided prediction and high-resolution mass spectrometry. Environ. Sci. Technol. 43:7039-7046.
Crossref |
|
|
Khan MH, Khan N, Aslam H (2003). Hudiara Drain - A case of trans-boundary water pollution between India and Pakistan. Pak. J. Biol. Sci. 6:167-175.
Crossref |
|
|
Lee S, Moon JW, Moon HS (2003). Heavy metals in the bed and suspended sediments of Anyang River, Korea: Implications for water quality. Environ. Geoch. Health 25:433-452.
Crossref |
|
|
Morrison G, Fatoki OS, Persson L, Ekberg A (2001). Assessment of the impact of point source pollution from the Keiskammahoek Sewage Treatment Plant on the Keiskamma River- pH, electrical conductivity, oxygendemanding substance (COD) and nutrients. Water SA 27:475- 480.
Crossref |
|
|
|
Morrison GM, Revitt DM, Ellis JB (1990). Metal speciation in separate storm water systems. W. Sci. Technol. 22:53-60. |
|
|
Paul MJ, Meyer JL (2001). Streams in the urban landscape. Ann. Rev. Ecol. Syst. 32:333-365.
Crossref |
|
|
Qadir A, Malik RN, Husain SZ (2008). Spatio-temporal variations in water quality of Nullah Aik-tributary of the river Chenab, Pakistan. Environ. Mon. Assess. 140:43-59.
Crossref |
|
|
Rothwell JJ, Evans MG, Allott T (2006). Sediment- water interactions in an eroded and heavy metal contaminated peatland catchment, Southern Pennines, UK. Water Air Soil Pollut Focus 6:669-676.
Crossref |
|
|
Saeedi M, Daneshvar S, Karbassi AR (2004). Role of riverine sediment and particulate matter in adsorption of heavy metals. Int. J. Environ. Sci. Technol. 1:135-140.
Crossref |
|
|
Shrestha S, Kazama F (2007). Assessment of surface water quality using multivariate statistical techniques: A case study of the Fuji River basin, Japan. Environ. Mod. Softw. 22:464-475.
Crossref |
|
|
|
Simeonov V, Stratis JA, Samara C, Zachariadis G, Voutsa D, Anthemidis A, Sofoniou M , Kouimtzis T (2003). Assessment of the surface water quality in Northern Greece, W. Res. 37:4119-4124. |
|
|
Singh A, Ghosh S, Pankaj S (2007). Water quality management of a stretch of river Yamuna: An interactive fuzzy multi-objective approach. W. Res. Manag. 21:515 -532.
Crossref |
|
|
Singh KP, Malik A, Mohan D, Sinha S (2005b). Chemometric data analysis of pollutants in wastewater- A case study. Ana. Chim. Acta 532:15 -25.
Crossref |
|
|
Singh KP, Malik A, Sinha S (2005a). Water quality assessment and apportionment of pollution sources of Gomti river (India) using multivariate statistical techniques- a case study. Ana. Chim. Acta 538:355-374.
Crossref |
|
|
Tariq M, Ashraf M, Jaffar M, Afzal M (1996). Pollution status of the Indus River, Pakistan through heavy metal and macronutrient contents of fish, sediment and water. W. Res. 30:1337-1344.
Crossref |
|
|
Temnerud J, Bishop K (2005). Spatial variation of stream water chemistry in two Swedish Boreal Catchments: Implications for environmental assessment. Environ. Sci. Technol. 39:1463-1469.
Crossref |
|
|
|
Wright DA, Welbourn P (2002). Environmental toxicology, Cambridge environmental chemistry series 11, University press, Cambridge, UK. |