Full Length Research Paper
ABSTRACT
The objective of this work is to determine the methanogenic potential of landfill waste. To do this, two types of tests were carried out. The first one is the pre-test of anaerobic digestion by incubation carried out in a 500 mL flask in which 50 g of waste is placed in contact with 350 mL of water and the second one is the pre-test of the anaerobic digestion by fermentation also carried out under the same conditions as the test for anaerobic digestion by incubation with the difference that in the latter case, inoculum (cow dung) is added up to 21.54 g, that is, 19.23 g of MV in order to respect an I/S ratio of 2. The production of biogas is measured by displacement of an acidified water solution to pH = 2 using an inverted test tube. The results showed that the waste is more favorable for anaerobic digestion by fermentation than for anaerobic digestion by incubation and that all the digesters operated at mesophilic temperature. Indeed, at the end of the experiment, a mass of 20 g produced; with the digester by fermentation 83.895 mL of biogas or 77.75 mL of methane for the waste and 34.307 mL of biogas or 30.25 mL of methane for the sand. With the digester by incubation 4.6 mL of biogas or 2.1 mL of methane for the waste and 4.35 mL of biogas or 2.05 mL of methane for the sand. These results clearly show that landfill waste can be recovered by anaerobic digestion and therefore the establishment of a biogas installation on site and will not only reduce GHGs but also recover the biogas in the form of electricity.
Key words: Anaerobic digestion, methanogenic potential, biogas, landfill.
INTRODUCTION
Landfill is an easy and inexpensive technique for disposing of household and similar waste without adequate management. However, it can cause various problems in terms of hygiene and health as well as the environment (Thonart et al., 1998). Landfill waste is a source of soil and groundwater contamination due to leachate on the one hand and on the other hand leads to significant biogas emissions (Amarante and Lima, 2010; Adjiri et al., 2018). Biogas mainly consists of combustible methane (50 to 70%) and inert carbon dioxide (20 to 50%). Other gases can be added in a minority way in the composition of biogas: hydrogen, hydrogen sulphide (H2S), ammonia (NH3), and nitrogen (N2). The content of these gases depends closely on the waste treated and the degree of anaerobic digestion (Buffiere 2007; Jung, 2013). In Togo, 80% of household and similar waste is sent to landfill (Tcha-Thom, 2014). The abandoned Agoè-Nyivé landfill has an area of ??65,552 m2 with a landfill capacity of 272,041 m3 and receives around 800 tonnes of waste per day, the majority of which is organic (around 30%) (Koledzi, 2011). In Togo, as in most developing countries, the amount of energy produced is less than consumption (Samah, 2015). Biomass, which is the main source of energy, represents 76% of final energy consumption, with mainly wood fuels, in particular fuelwood, charcoal and certain agricultural residues. Despite the fact that energy production remains below demand, the energy supplying countries in Togo only reduce the amount over time as demand only exacerbates. In order to fill this ever-widening void, the use of renewable energies has become essential (Tcha-Thom, 2019). In this context, the production of biogas from fermentable waste is an opportunity for the diversification of energy resources and sustainable management of the environment. The production of biogas through organic waste and its use could increase the economic feasibility of sanitation projects through the production of electricity. The use of biogas will directly contribute to meeting the challenges of climate change and to meeting Togo's current energy challenges. Thus, the objective of this work is to determine the methanogenic potential of the waste from the Agoè-Nyivé landfill with a view to setting up an anaerobic digestion unit on site.
MATERIALS AND METHODS
Presentation of the discharge and characterization of substrates
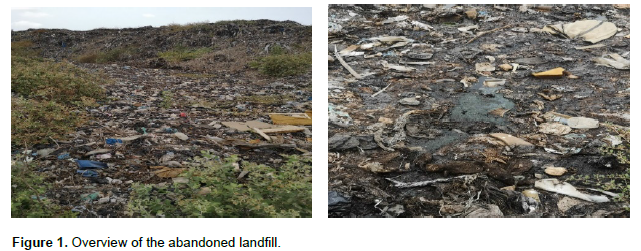
Agoè-Nyivé landfill, the site of this study, is located in the district of Agoè-Nyivé, a locality located in the northern suburbs of the city of Lomé. That landfill has an area of 65,552 m2 with a landfill capacity of 272,041 m3. Lomé is located at 10 m above sea level. Lomé's dominant climate is known to be tropical. In winter, there is much less rainfall than in summer. The average temperature in Lomé is 26.6°C. Figure 1 shows the overview of the Agoè-Nyivé landfill in the city of Lomé.
Fermentable waste and sand to which cow dung is added are studied. The sample of cow dung (40 kg) primarily used as inoculum for the experiments is taken from the agronomic farm of the Higher School of Agronomy of the University of Lomé. These samples are characterized in terms of pH, dry matter (DM) and organic matter (OM) necessary to launch the digestion tests. The moisture percentage of the various organic waste is determined by the difference in weight of the sample before and after drying until the mass stabilizes (Equation 1):

with %H: percentage of humidity and MS: dry matter.
The organic matter content (OM) is obtained by weighing difference between the mass of the dry waste (M1) and the mass of the waste calcined at 550°C (M2) up to a constant weight for more than 6 h.

with M2: the final mass of waste calcined at 550°C.
BMP pretest
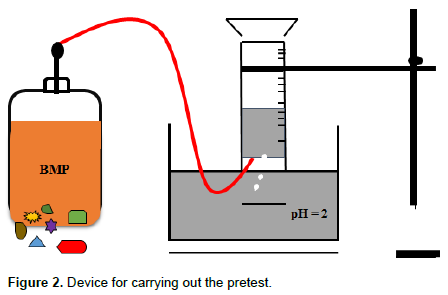
Two types of tests are carried out. This is firstly the pre-test of the anaerobic digestion by incubation carried out in a 500 mL flask (PVC bottle) in which 50 g of waste is contacted with 350 mL of tap water at 27°C. The bottle is filled to 80% of the total volume and then closed tightly. Then a second pre-test of the anaerobic digestion by fermentation is also carried out under the same conditions as the test of the anaerobic digestion by incubation with the addition of the inoculum (cow dung) in the amount of 21.54 g, that is, 19.23 g of MV in order to respect an I/S ratio of 2. The production of biogas is measured by displacement of an acidified water solution to pH = 2 using an inverted test tube (Figure 2). The use of acidified water prevents the dissolution of CO2 from the biogas (Tcha-Thom, 2019; Lacour, 2012). At the end of these pretests, 48 and 16 mL of biogas were produced, respectively by the anaerobic digestion by fermentation and the anaerobic digestion by incubation.
Implementation of anaerobic digestion tests
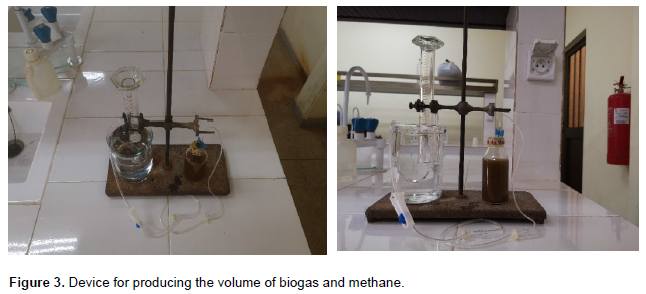
In anaerobic digestion by incubation, 20 g of wet waste are introduced into a 100 mL flask and make up with tap water to 80% of the total volume of the flask and then sealed. In the first week, the production of biogas and methane is measured daily using the device in Figure 3, then after 5 days the measurements were carried out every two days. The methane content is measured by displacing the liquid using NaOH solution (pH = 13) which traps the CO2 and that of the biogas using a HCl solution, pH = 2. The entire device is kept at room temperature to stimulate tropical conditions. The test is carried out over 30 days and in duplicate. A total of 4 flasks were used, 2 for the measurement of the biogas and 2 for the measurement of the methane content for each test:
(1) Test 1 noted BAC1 (Wet waste from the landfill): 20 g of waste from the landfill;
(2) Test 2 noted BAC2 (Wet sand from the landfill): 20 g of sand from the landfill.
For anaerobic digestion by fermentation, the inoculum used is cow dung. Thus, 20 g of sample is brought into contact with inoculum (cow dung) so that the ratio Inoculum/Substrate (I/S) g of MV is equal to 2. Tap water is used to bring the whole to 80% of the volume of the bottle and then hermetically closed. The volume of production measurements were made under the same conditions as the test for anaerobic digestion by incubation. The test also lasts 30 days. Three tests were carried out all in duplicate:
(1) Test 1 noted BAC3 (Landfill waste + inoculum + water): 20 g of landfill waste, that is, 3.84 g of MV with 8.6 g of cow dung or 7.68 g of MV;
(2) Test 2 noted BAC4 (Sands + inoculum + water): 20 g of sand from the landfill, that is, 7.8 g of MV with 17.47 g of cow dung, or 15.6 g of MV;
(3) A test 3 noted BAC5 (Inoculum + water): 20 g of cow dung is carried out, anaerobic digestion of the inoculum to evaluate the production of biogas therein.
The device (Figure 3) makes it possible to produce the volume of biogas and methane.
Monitoring of the reaction environment of the digestion medium
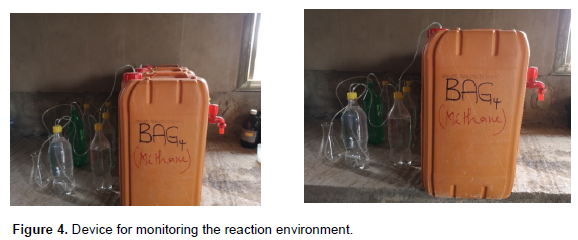
Monitoring the reaction environment requires large amounts of liquid phase which taken from the 100 mL vials could alter the volume of productions monitored. This is why the larger 25 L reactors (Figure 4) are set up and allow the sampling of the liquid phase and the monitoring of anaerobic digestion parameters such as pH, temperature, TAC and AGVs. Thus, in these 25 L reactors are placed 5 kg of wet waste and 15 L of water. Anaerobic digestion by incubation and fermentation are also carried out. For anaerobic digestion by incubation, two tests were carried out:
(1) The first noted BAG1 containing the waste
(2) The second denoted BAG2 containing sand
The anaerobic digestion of the inoculum (cow dung) is added so that the I/S ratio of MV is equal to 2. The tests carried out were:
(1) The first noted BAG3 containing 5 kg of waste from the landfill, that is, 960 g of MV with 2.15 kg of cow dung or 1920 g of MV so that the I/S ratio of MV is equal to 2;
(2) The second noted BAG4 containing sand from the landfill is 1950 g of MV with 4.37 kg of cow dung or 3900 g of MV so that the I/S ratio of MV is equal to 2;
(3) A test noted BAG5 containing 5 kg of inoculum.
To monitor the parameters, a tap is placed on the digester to recover the liquid phase. Depending on the different matrices related to the stages of the anaerobic digestion process, the following parameters: Temperature; VFA; TAC; pH; % H; DM; and VM were analyzed.
RESULTS AND DISCUSSION
Physico-chemical characterization of substrates
The preliminary characterization of the substrates is essential because it makes it possible to identify the difficulties inherent in the anaerobic digestion of the substrates in order to remedy them or the opportunities to optimize them. This also makes it possible to fix the experimental conditions for the experiments to be developed in the later phase. The physicochemical characterizations of the substrates (sand and waste) and of the inoculum (cow dung) are shown in Table 1.
All the substrates studied have a basic pH varying from 8.4 to 9.7. That of waste from landfill is more pronounced than that of cow dung. Such pHs are not a priori favorable for anaerobic digestion. At least 70% of the substrates are dry matter showing their low water content. The organic matter content of the substrates is higher (89.3%) for cow dung than in landfill waste which contains a content of 39% (Sand) and 19.2% (organic waste). The results on cow dung are similar to those presented by Tcha-Thom (2019) who showed that cow dung had a pH of 8.5, a dry matter content of between 15 and 30% and high organic matter content of the order of 71% DM. The high pH of the waste from the landfill is believed to be primarily due to the reactions taking place within the landfill which would cause significant volatilization of ammonia.
Study of the inoculum response
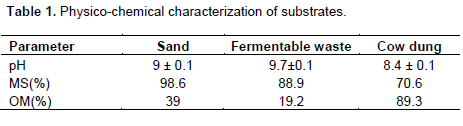
The objective of the study of the inoculum response is to assess the effectiveness of the microbial flora present within the substrate of cow dung and its ability to degrade any substrate dedicated to methanization. The evolution of the cumulative volume of biogas and methane produced (Figure 5) shows an increase over time. After 30 days, the total volume of biogas produced reaches 97.75 mL, that is, 5.2.10-3m3 biogas/kg of MV, and that of methane is 91.75 mL, that is, 5.5.10-3 m3/kg of MV. The cumulative curve for biogas is similar to that for methane and the difference between methane and biogas is due to the fact that the CO2 has been stripped of the biogas. The methane content is 93.8% gold, under optimal conditions the methane content varies between 30 and 55%. This discrepancy is due to the fact that the reaction at the reactor level did not proceed until the production of biogas was stopped.
Reactors by incubation and fermentation
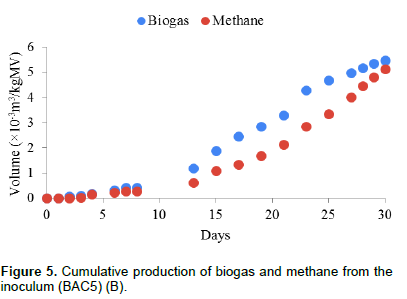
Figure 6 shows the evolution of the cumulative volume of biogas and methane from BAC1 and BAC2 digesters by incubation. Figure 7 shows the change in the cumulative volume of biogas and methane from BAC3 and BAC4 from digesters by fermentation. The change in the cumulative volume of biogas and methane produced in BAC1 and BAC2 (Figure 6) shows that it increases over time. After 30 days, the total volume of biogas produced for BAC1 reaches 4.6 mL, that is, 1.2.10-3 m3 biogas/kg of MV; that of BAC2 reaches 4.35 mL, that is, 5.6.10-4 m3 biogas/kg of MV. The total volume of methane produced for BAC1 reaches 2.1 mL or 5.5.10-4 m3 methane/kg MV, that of BAC2 reaches 2.05 mL, that is, 2.6.10-4 m3/kg MV. The results showed that the biogas and methane production of BAC1 is slightly higher than that of BAC2. This is because BAC1 contains the organic fraction while BAC2 contains sand. The methane content for BAC1 is 45.7% and that of BAC2 is 47.1% which respects the biogas content of methane.
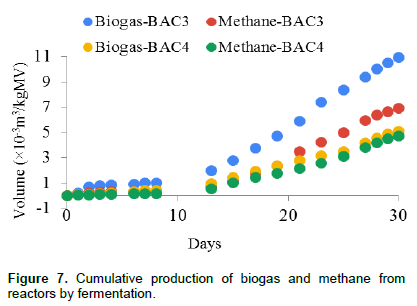
The change in the cumulative volume of biogas and methane produced in BAC3 and BAC4 (Figure 7) shows that it increases over time. After 30 days, the total volume of biogas produced for BAC3 reaches 126 mL, that is, 1.1.10-2 m3 biogas/kg MV that of BAC4 reaches 119.75 mL, that is, 5.1.10-3 m3 biogas/kg MV. The total volume of methane produced for BAC3 reaches 79.85 mL or 6.9.10-3 m3 methane/kg of MV that of BAC4 reaches 110.45 mL or 4.7.10-3 m3/kg of MV. The results showed that the biogas production (volume) of BAC3 is slightly higher than that of BAC4 and the methane production of BAC4 is much higher than that of BAC3. The methane content for BAC3 is 63.4% and that of BAC4 is 92.2% gold, under optimal conditions the content is between 30 and 55%. This difference is related to the presence of inoculum and the fact that the reaction in the digester did not take place until the production of biogas was stopped.
Physico-chemical characterization of the different reactors
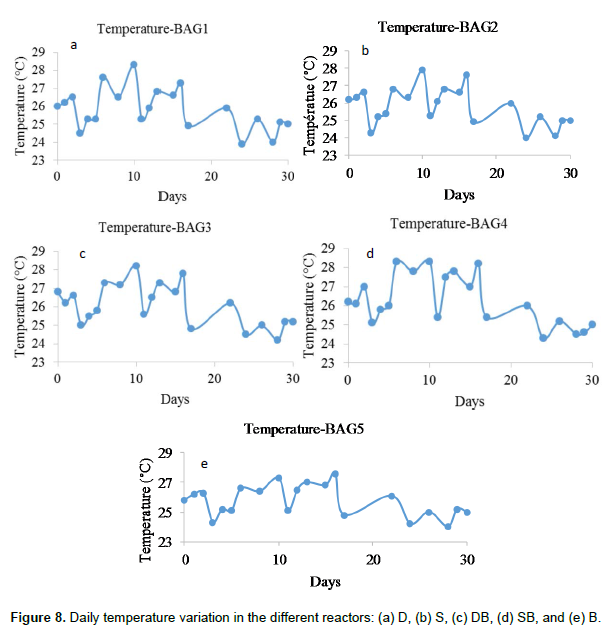
The temperatures recorded vary between 23.9 and 28.3°C for the BAG1 (D) reactor (Figure 8a), between 24 and 27.9°C for the BAG2 (S) reactor (Figure 8b), between 24.2 and 28.2°C for the BAG3 (DB) reactor (Figure 8c), between 24.3 and 28.3°C for the BAG4 (SB) reactor (Figure 8d), between 24 and 27.6°C for the BAG5 reactor (B) (Figure 8e). The experiments were carried out at room temperature to stimulate natural conditions in a tropical environment. The analysis results showed that all the reactors operated in the mesophilic fermentation range of 23 and 29°C with an average of 26 ± 1°C, that is, a deficit of around 9°C compared to the optimum temperature in mesophilic digestion. This temperature is far from the optimum which is between 35 and 37°C under mesophilic conditions (Tcha-Thom, 2019). This deficit was not observed by Morais and Joácio (2006), where the average temperature inside the bioreactors is (35.0 ± 2°C) throughout incubation. The trials took place between September and October, and at this time of year, the ambient temperature is around 27°C. This deficit of around 9°C can be explained by the fact that the average ambient temperature is around 27°C.
Evolution of pH and VFAs
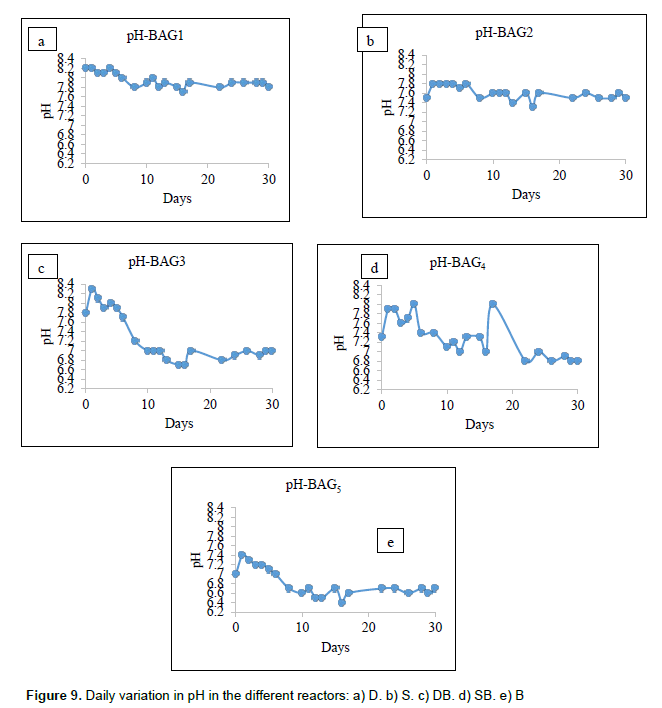
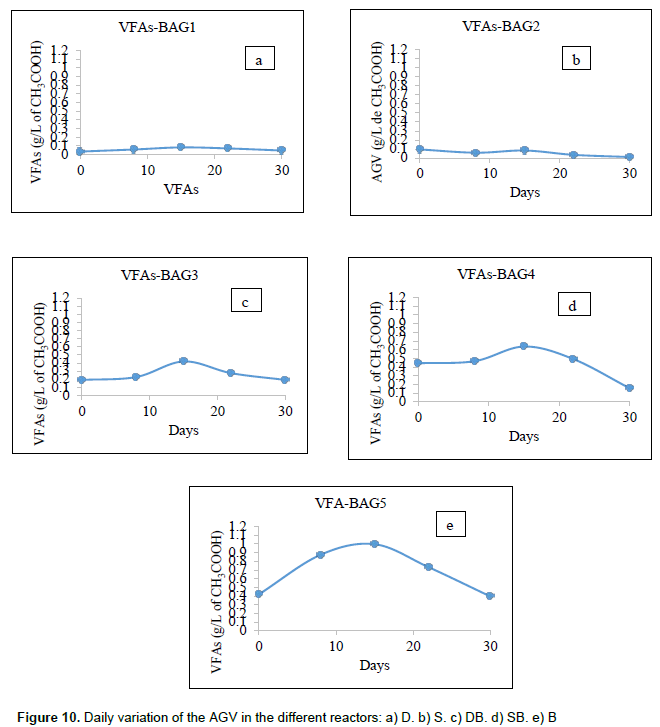
The recorded pH values ??vary between 7.7 and 8.2 for the BAG1 (D) reactor (Figure 9a), between 7.3 and 7.8 for the BAG2 (S) reactor (Figure 9b), between 6.7 and 8, 3 for the BAG3 (DB) reactor (Figure 9c), between 6.8 and 8 for the BAG4 (SB) reactor (Figure 9d), and between 6.4 and 7.4 for the BAG5 reactor (B) (Figure 9e). The test results show that all of the reactors operated in the pH range of 6.4 and 8.3. The pH must be between 6 and 8.5 for good fermentation and that the pH is not an inhibitor, which justifies the proper functioning of digesters (Tcha-thom, 2019). Figure 10 illustrates the evolution of VFAs in reactors. From the start to the 15th day the VFAs underwent an increase in the reactors except in the BAG2 reactor where there was a decrease until the 8th day before a slight increase until the 15th day. This increase in VFAs in the 4 reactors up to day 15 is explained by a decrease in pH. Indeed, the main cause of acidification of the environment is the accumulation of volatile fatty acids (Buffiere et al., 2007; Berthe, 2006; Bautista, 2019). The decrease of VFAs in the BAG2 reactor up to day 8 is explained by an increase in pH. From the 15 to 30th day there was a decrease in VFAs in all the reactors. Indeed, the re-increase of the pH and its stabilization is justified by an overconsumption of VFAs for the production of biogas. After 30 days the VFAs are less than 3 g/L in all the reactors. A VFAs concentration of less than 3 g/L is recommended for proper operation of the reactors (Farquhar and Rovers, 2013).
Methanogenic potential of reactors by incubation and fermentation
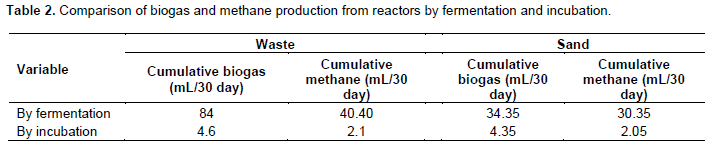
After 30 days, the incubation reactor containing 20 g of waste (BAC1) produced 4.6 mL of biogas while the fermentation reactor containing 20 g of waste and 8.6 g of cow dung (BAC3) produced 126 mL of biogas by withdrawing the production of biogas from 8.6 g of cow dung which is 42 mL if 20 g of cow dung gives 97.75 mL, 84 mL of biogas is obtained for the waste. It was deduced that the production of biogas during the fermentation of the waste is 18.3 times greater than that of the incubation. The incubation digester containing 20 g of sand (BAC2) produces 4.35 mL of biogas while the fermentation digester containing 20 g of sand and 17.47 g cow dung (BAC4) produces 119.75 mL of biogas by withdrawing the production biogas from 17.47 g of cow dung which is 85.4 mL if 20 g of cow dung gives 97.75 mL, 34.35 mL of biogas is obtained for the sand. It was deduced that the biogas production at the level of the fermentation of the sand is 7.9 times higher than that of the incubation. After 30 days, the digester by incubation containing 20 g of waste (BAC1) produces 2.1 mL of methane while the digester by fermentation containing 20 g of waste and 8.6 g of cow dung (BAC3) produces 79.85 mL of methane by withdrawing the production of methane from 8.6 g of cow dung which is 39.45 mL if 20 g of cow dung gives 91.75 mL, 40.40 mL of methane is obtained for the waste. It was deduce that the production of methane during the fermentation of the waste is 19.2 times greater than that of the incubation. The incubation digester containing 20 g of sand (BAC2) produces 2.05 mL of methane while the fermentation digester containing 20 g of sand and 17.47 g cow dung (BAC4) produces 110.45 mL of methane by withdrawing the production methane from 17.47 g of cow dung which is 80.1 mL if 20 g of cow dung gives 91.75 mL, 30.35 mL of methane is obtained for the sand. It was deduced that the production of methane during fermentation is 14.8 times greater than that of incubation. Consequently, anaerobic digestion by fermentation produces more biogas and methane than an anaerobic digestion by incubation starting from the same mass and duration (Table 2). The values obtained are comparable to those of Tanios (2017).
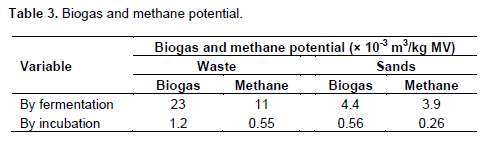
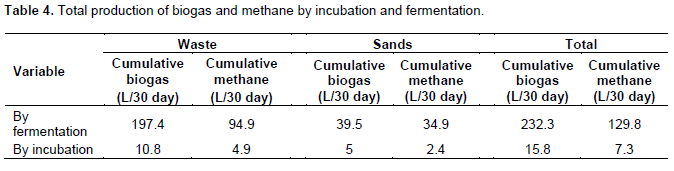
The results of the calculation of the potential of biogas and methane in m3/ kg MV are presented in Table 3. The results of biogas production are shown in Table 4.
CONCLUSION
The objective of this study is to assess the potential for anaerobic digestion by incubation and anaerobic fermentation of waste from an abandoned landfill in Lomé, Togo. The results obtained show that the waste from the Agoè-Nyivé landfill can be treated by anaerobic digestion. The experimental results showed that all the reactors operated at mesophilic temperature and that the presence of inoculum in a reactor is essential in the fermentation process of biodegradable waste. To optimize the anaerobic digestion of waste, it is essential to control several factors including pH, TAC, VFA, agitation as well as temperature. In landfill, these parameters cannot be controlled. On the other hand, in anaerobic digestion they are controllable. This study has shown that the waste from an abandoned landfill has methanogenic potential and the biogas could be recovered in the form of energy and thus reduce GHGs. Indeed, thanks to this study, the determination of the potential for anaerobic digestion by incubation and fermentation of waste from an abandoned landfill was possible. This study opens up new horizons for better recovery of organic waste by deploying a biogas installation on site for conversion into electricity.
CONFLICT OF INTERESTS
The authors have not declared any conflict of interests.
ACKNOWLEDGEMENT
The authors thank the Laboratory of Waste Management, Treatment and Recovery (LWMTR) in which this work was carried out.
REFERENCES
|
Adjiri O, Koudou A, Soro G, Biémi J (2018). Study of the energy recovery potential of biogas from the Akouédo landfill (Abidjan, Ivory Coast). Waste, science and technology, n°77. |
|
|
Amarante J, Lima A (2010). "Anaerobic digestion of putrescible municipal waste - available technologies and challenges for Quebec", 99. |
|
|
Bautista A (2019). "Feasibility study of micro-methanization by co-digestion at the district level". IMT Atlantique University. |
|
|
Berthe C (2006). Study of the Organic Matter contained in leachate from different household and similar waste treatment channels. Thesis, University of Limoges. |
|
|
Buffiere P, Carrere M, Lemaire O, Vasquez J (2007). "Methodological guide for the operation of solid waste methanization units", Repport 40 p. |
|
|
Farquhar G, Rovers F (2013). Gas production during refuses decomposition. Water, Air, and Soil Pollution. Solid Waste Treatment Routes 2(4):483 495. |
|
|
Jung C (2013). Solid waste treatment methods: material and energy recovery. Bull. Sci. Inst. Natl. Conserv. Nat., 50-54. http://bi.chm-cbd.net/biodiversity. |
|
|
Koledzi E (2011). "Valorization of solid urban waste in the districts of Lomé (Togo): Methodological approach for a sustainable production of compost.," PhD,thesis, University of Lomé,Togo P 224. |
|
|
Lacour J (2012). Valorization of the organic fraction of agricultural residues and other similar wastes using anaerobic biological treatments. INSA of Lyon; Quisqueya University (Port-au Prince). NNT: 2012ISAL0026ff. tel-00825479:218. |
|
|
Morais D, Joácio J (2006). "Influence of the mechanical and biological pre-treatment of Residual Household Waste (OMR) on their bio-physico-chemical behavior in Waste Storage Facilities (ISD)". National Institute of Applied Sciences of Lyon. |
|
|
Samah K (2015). Diagnosis of the energy situation in Togo. Ministry of the Environment, Department of Water and Forests. Togolese Republic. |
|
|
Tanios C (2017). Characterization, evaluation of the toxicity of biogas from household waste and recovery by catalytic reforming. Cote d'Opale Coastal University and Lebanese University. |
|
|
Tcha-Thom M (2014). Assessment of the impact of organic matter fractions on the characteristics of Togolese and French soils. Research master's thesis, University of Limoges. |
|
|
Tcha-thom M (2019). Search for a sustainable sector for the methanization of fruit and slaughterhouse waste from Togo: Assessment of the agronomic potential of digestates on soils in the Kara region.," Geochemistry P 205. |
|
|
Thonart P, Steyer E, Drion R, Hiligsmann S (1998). Biological management of a landfill. Report pp. 590-591. |
|
Copyright © 2024 Author(s) retain the copyright of this article.
This article is published under the terms of the Creative Commons Attribution License 4.0


