ABSTRACT
The arrangement of diodes in a solar cell array affects the Maximum Power Point (MPP) of the solar cell system. Thus, a pre-wiring method for determining the optimal arrangement of the diodes, which results in the highest MPP, is desirable. This paper proposes a numerical algorithm that predicts the optimal diodes arrangement. A computer program, written in 'Spice', measures the MPP of many different combinations of diode arrangements in a Photovoltaic (PV) array. The program then evaluates the array power harvesting efficiencies. By using the statistics of these results it can then point to the best arrangement of diodes for optimal MPP. A pre-requisite for this method is the knowledge of the electrical characteristics of each photodiode. Simulations and measurements indicate that for an array of 15 diodes (3 parallel columns of 5 diodes in series) the relative improvement achieved by using this method is 15% when compared to the average efficiency of an arbitrarily configured array. One application is for high power PV arrays in which the wiring and optimum arrangement is fixed and the optimal diode arrangement may then be found. Alternatively, for small scale low power PV arrays dynamic real time reconfigurable PV arrays may be realized.
Key words: Photovoltaic (PV) array, Maximum Power Point (MPP), spice, Monte-Carlo, module-mismatch.
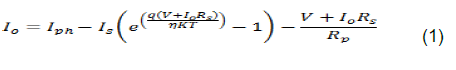
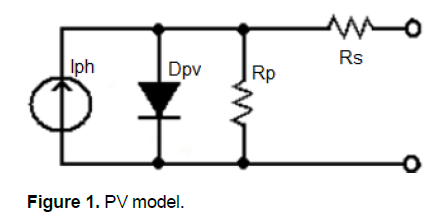
P-N junctions of solar cells can be modeled as a current source in parallel to a diode and two resistors as shown in Figure 1 where Rs is the cell series resistance and Rp is the shunt resistance (Nelson, 2003; Cooper, 2008).
The output current is then described by the equation:
Where: Io - Output current; Rs - Cell series resistance;
Iph - Photo generated current; η – Diode ideality factor; Is - Diode’s saturation current; K - Boltzmann constant; q - Charge of an electron; T – Temperature; V - Voltage across the PV cell and Rp - Cell shunt resistance. For a given temperature the characteristics of each individual diode are defined by the parameters; Isc, η, Is, Rs, Rp and the Maximum power point (MPP) that can be extracted from its I-V curve. An Optimal array would be one where all of the diodes in the array are identical and have the same parameters.
The MPP of such an array would be the sum of the MPP's of each diode separately. This is the maximum theoretical MPP that can be achieved.
In practice, due to process variations a mismatch exists between any two photodiodes. Even if two manufactured photodiodes show a close value in one parameter, they may have large differences in other parameters. As a result, the performance of each photodiode module is different. It is assumed that the performance differences between the modules have a normal distribution. It follows that the maximum power output of an entire PV array is always less than the sum of the maximum outputs of the individual modules. This degradation is due to slight inconsistencies between the various module performances and is termed module mismatch. Losses due to module mismatch amount to at least 2% loss in array power harvesting (Endecon, 2001; Henze et al., 2009).
Some solar cell module manufactures provide micro inverters or other power management electronics to improve and optimize the overall power output from their solar cell modules (Lee et al., 2013). However, with a standard solar cell array the cell wiring typically cannot be reconfigured to achieve better power efficiencies nor can its cell arrangement accommodate the particular conditions at the installation site. Even when power management electronics are added this does not really solve the problem for a number of reasons; it increases the cost of the systems' components, it requires additional installation and maintenance and is also limited to the hardwired fixed cell arrangements of the solar cells in the panel (Sager, 2014).
Another typical industry approach when dealing with module mismatch loss is to sort the diode cells into groups of 1σ, 2σ and 3σ, where σ is the standard deviation of the diodes' performances. Following the sorting step, PV arrays can be built which are then sorted into three classes of performance and efficiency; best, medium and poor. The cost of the PV array can then be respectively determined by the vendor. The total power supplied from the PV arrays is higher using this method than in the case of building the PV arrays with randomly selected diode cells (Webber and Riley, 2013).
In this article we present a numerical solution for the module-mismatch problem. Before wiring the PV array, each diode is electrically characterized and its major parameters are extracted. The diode parameters are then loaded into a computer program (written in 'Spice') (Pongratananukul and Kasparis, 2004). A large number of arrangement combinations for these diodes are then sampled by the program. In each iteration, the program calculates the theoretical MPP of the specific array arrangement. Assuming the distribution of the resulting MPPs is Gaussian, the program finds an arrangement that is closest to the optimal arrangement after a reasonable number of iterations. The exact number of iterations depends on the runtime of the program. The limitation of the program runtime on the number of iterations will be analyzed later in this article.
The program can be realized with off-chip software for a pre-sorting phase, or implemented in on-chip hardware to enable dynamic configuration settings that reach system specifications like a specific required power value (Gaul, 2012) or an optimized power conversion efficiency (Dzung and Lehman, 2008; Kaushika and Gautam, 2001; Picault et al., 2010). An implementation for on-chip dynamic switching applications is suitable for small low powered solar panels (Sol-chip, 2013).
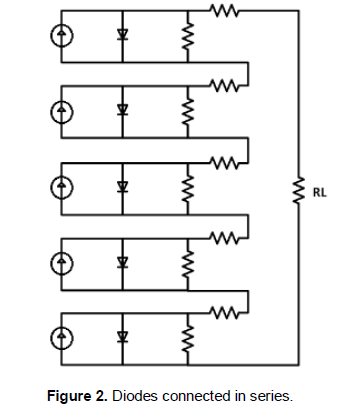
When diodes are connected in series, as illustrated in Figure 2, they are all forced to have the same current flow. If all of the diodes are identical, then they supply the same current and also drop by the same voltage.
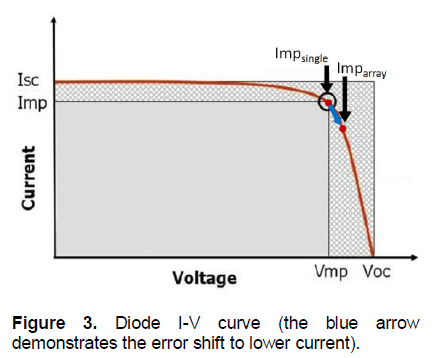
Yet, due to process variation, the solar cells' diode parameters are not identical. Since the diodes are forced to conduct the same current, a difference exists between the Imparray (photo current at maximum power point) of the whole vector to the Impsingle of each individual diode. Figure 3 illustrates how diodes that have an Impsingle higher than Imparray must increase their voltage drop to reach the lower level of the total Imparray.
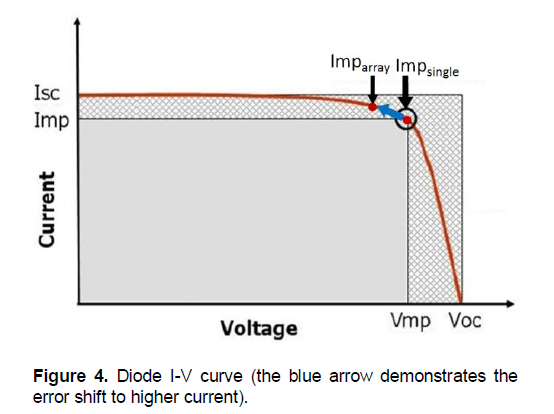
The opposite holds for diodes that have an Impsingle lower than the Imparray value, as illustrated in Figure 4. Such diodes decrease their voltage Vmp to reach the desired current. As a result, the diodes in the vector will not work at their intrinsic MPP.
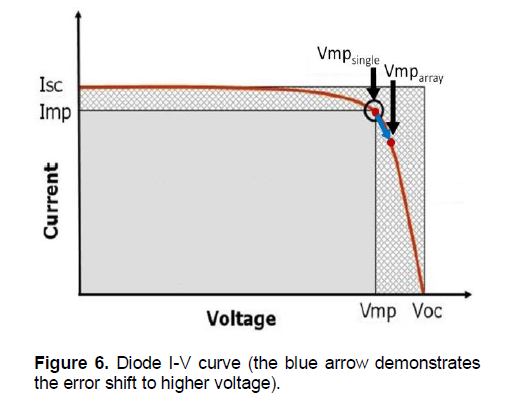
When diodes are connected in parallel as illustrated in Figure 5, the current on the load is the sum of all of the diodes’ currents, and all of the diodes are forced to drop by the same voltage. The differences between the diodes cause each diode to have a different Vmp (maximum power voltage) value. As a result a difference exists between Vmparray of the whole system to VmpSingle of each individual diode, thus causing the diodes to work at a different power point than their intrinsic MPP. Diodes with lower VmpSingle will increase their voltage to Vmparray level, while their current will decrease as is shown in Figure 6.
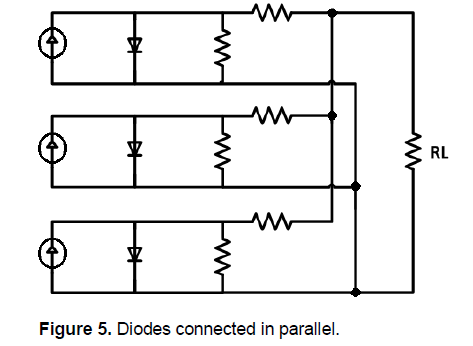
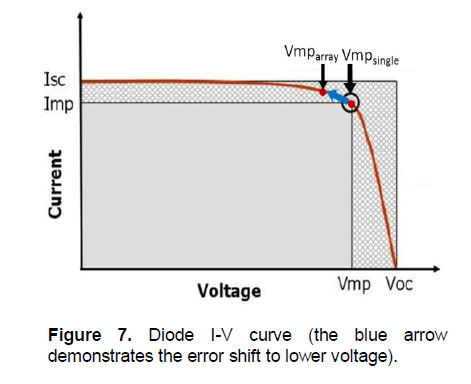
For the case of diodes with higher VmpSingle Figure 7 shows that they will decrease their voltage value to reach the Vmparray level and will generate a higher current. As in the case of diodes in a series, when combined in parallel each individual diode in the array, and therefore the array as a whole, does not reach its ideal MPP value. The PV array performance will be affected by the parameter mismatches in any connectivity or cell arrangement.
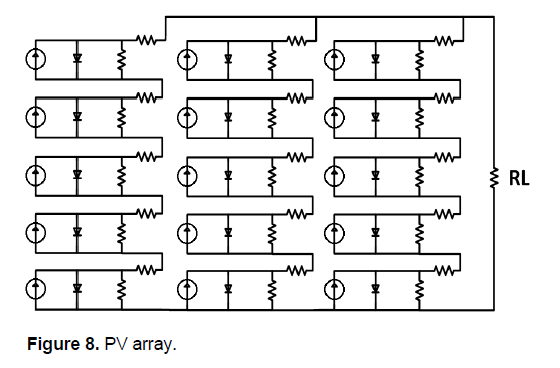
Figure 8 illustrates an arrangement in which for each serial vector all of the diodes are forced to flow with the same current and the parallel vectors are forced to drop by the same voltage, regardless of their ideal intrinsic Imp and Vmp. It is important to note that from an electrical point of view a vector can be effectively treated as a single diode, having a single I-V curve and a single Vmp and Imp (Solmetric, 2010). Consequently, the MPP of the whole array is always lower than the sum of the MPPs of each individual diode.
The numerical solution for the module-mismatch problem is based on a large number of simulation measurements, which calculates the MPP of different diodes' arrangement in the PV array. A photovoltaic array is constructed from 'm' parallel columns of 'n' diodes in series. Taking into account that each diode can be placed at every array node, there are (n×m)! possible diode arrangements in total. For a 5×3 PV array, for example, there are 15! ≈ 1.3×10¹² possible diode arrangements. Assuming the distribution of the MPP of all possible configurations is Gaussian, the desired diode configuration then, is the one that yields the highest MPP or, equivalently, the Gaussian maximum value.
The order of the diodes within each vector does not affect the panel efficiency. This is due to the fact that the vector voltage is the sum of all of the biases of the diodes in the vector which are determined by the current. The current itself is determined by the weakest cell in the vector, regardless its exact location in the vector. Considering this then it is possible to reduce the number of configurations that need to be tested.
As indicated, the number of all possible configurations is (n×m)!. For each given arrangement of diodes in the PV array there are (n!)m arrangements that will result with the same MPP since the diodes positions will simply be shuffled within the same vector. Thus, there are in fact only (n×m)!/ (n!)m arrangements that need to be tested.
In addition, a swapping between the vectors will not affect the panel efficiency since the wiring connections remain the same. Thus, it is possible to divide the number of meaningful arrangements by m!. Therefore, in total there are (n×m)!/ (n!)m/m! configurations to be tested.
The first step of the computer program is to extract the diodes five reference parameters that were mentioned above. The extraction procedure is also explained in this study. After determining the diode parameters the program then creates many arrangement schemes for the diodes. For each arrangement the Spice simulator
characterizes the I-V behavior (Oldenkamp et al., 2004), measures the generated power and finds the MPP.
Ideally, all of the relevant permutations would be tested. However, considering the iteration of the program is time consuming (in the suggested technique each iteration lasts 2 seconds), the simulation of all permutations may last an unreasonable amount of time.
In order to overcome the runtime problem it is possible to simulate random configurations until a pre-defined stop condition is reached. A stop condition can be, for example: 1) A configuration that shows an improvement of 15% in MPP in respect to the average. 2) A limit on the total number of iterations allowed (equivalent to a limit on the program's running time). When the stop condition is reached the output of the program gives the maximum MPP of all the configurations that were tested and the diode arrangement in the optimal configuration.
It would be worthwhile to evaluate if, when using this method, arrays whose cells were pre-sorted to 1σ, 2σ and 3σ classes provide better MPPs than arrays whose cells were not sorted. In simulation 2 it is shown that the sorting process does not improve the MPPs when used with this method.
Simulation 1: All permutations
In a 5×3 PV array (3 vectors of 5 diodes in each vector), there are (5×3)!/(5!)3/3! = 126,126 relevant permutations to test. The execution of one lasts about 2 seconds. In all this translates into about 70 hours for the testing of all of the relevant permutations.
The relatively small size of this array enables the characterization of the overall MPP distribution. For larger arrays, such as a 34×3 PV array, there are 6.2×1045 iterations and the characterization of the MPP distribution is not feasible. In this case the only option is to use a stop condition as mentioned in the numerical solution. As such, the program will run random permutations until the pre-defined stop condition is achieved.
For the simulation of the 5×3 PV array, in order to ensure a normal distribution for the various diode parameters, a Monte-Carlo function was used. In real cases, a characterization step will measure the parameters of each diode and load the cell parameters into the program. In this case study the nominal values set for the diodes parameters were: Iph = 0.71 [A]. η = 1.5. Is = 1e-14 [A]. Rs = 0.12 [Ω]. Rp = 800 [KΩ]. The relative variation of 1σ class was set to 20%.
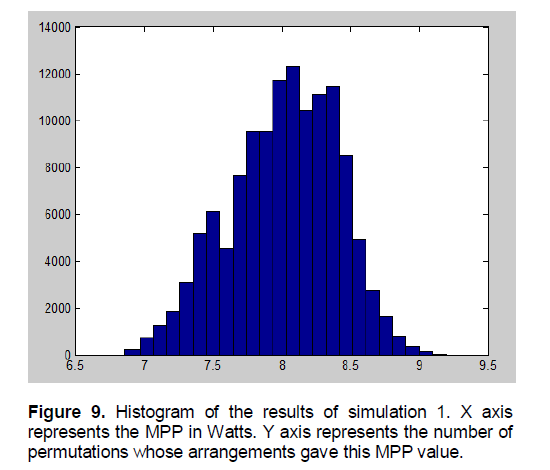
The MPPs of the simulation results for the 5×3 PV array are shown in the histogram in Figure 9. The average MPP value was 8 Watts, the minimum MPP was 6.8 Watts and the maximum MPP was 9.2 Watts.
Statistically, the MPP of an arbitrarily ordered PV array will approach the average value. Thus, the relative improvement of the suggested technique is 14.8%. The absolute improvement, however, depends on the efficiency of the given PV system. For example, for a PV system with efficiency of 17%, the absolute improvement is 2.5%.
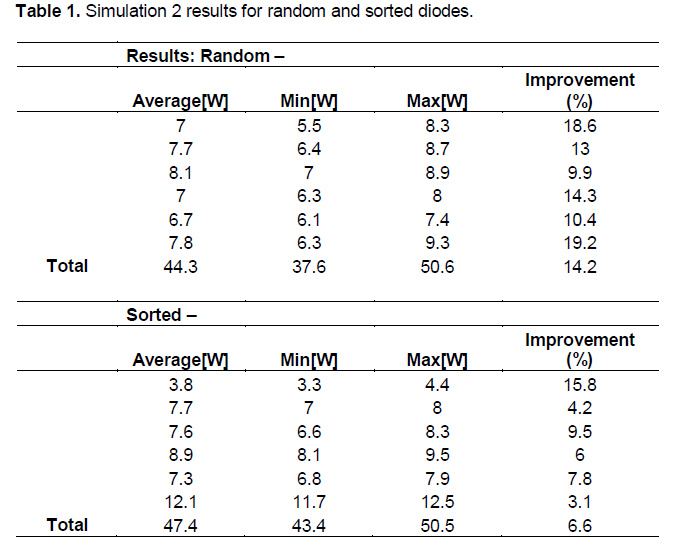
Simulation 2: Sorting the diodes
The second simulation presented here determines if advantage exist for pre-sorting the cells into classes over random selection when using the proposed method. A Monte-Carlo function in Spice was used to produce 1500 random values for each diode parameter (Iph, η, Is, Rs, Rp) with a normal distribution. The nominal values and relative variations were set in the Monte-Carlo function. Using these parameters, 1500 independent "diodes" were arbitrarily built. For each diode the MPP value was then evaluated. From these 1500 diodes, 90 were then selected and used to build 6 simulated panels of 5×3 diodes in two different manners:
(1) The 90 diodes were randomly selected from the 1500, from these 90 diodes 6 panels of 15 diodes each were built.
(2) The 1500 diodes were pre-sorted to three groups by their MPP value - 'Worst' [-infinity, -1σ], which were 15.9% of the diodes, 'Medium' [-1σ, 1σ] making up 68.2% of the diodes and 'Best' [1σ, infinity] which made up 15.9% of the diodes. Six PV panels were simulated: one panel was made up of diodes randomly chosen from the ‘Worst’ group, four panels used diodes that were chosen randomly from the ‘Medium’ group and the last panel was from the ‘Best’ group. This partition was chosen because 68.2% is approximately 4/6, and 15.9% is approximately 1/6.
For each simulated panel, the program evaluated the MPP of 200 different diode arrangements. This number was determined as a stop-condition of the program, as mentioned in the numerical solution. Table 1 summarizes the evaluated MPP's for the sorted and non-sorted arrays.
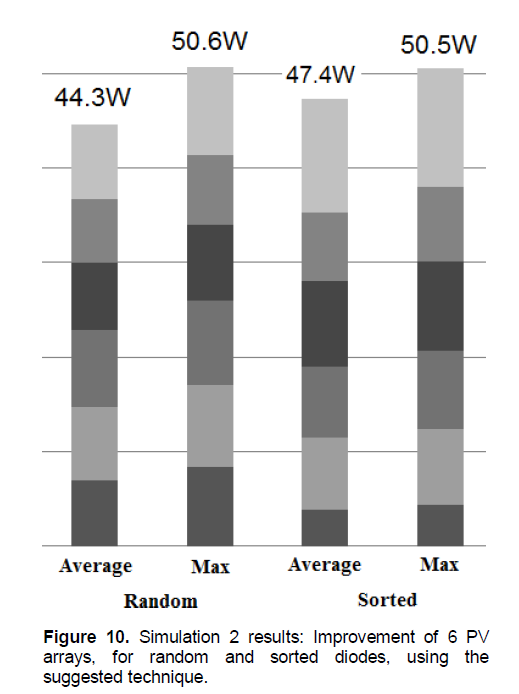
The sorting process increased the average MPP from 44.3W to 47.4W (average vs. average) an improvement of 6.9%. Using the suggested computer program on random arrays, the overall MPP increased to 50.6W an improvement of 14.2%.
Yet, it is worthwhile noting that the overall MPP of the best arrangement for the sorted panels is less than the MPP value of the best arrangement that was achieved when applying the program on the 6 non-sorted panels. The conclusion is that the sorting process is needless. There is no benefit to sort and classify the diodes into classes when using the program presented here for optimal diode arrangement.
Moreover, as can be seen in Table 1 and Figure 10 a larger deviation in the diodes' MPP exist when using panels that are built from the sorted diodes than the deviation in diodes' MPP when using panels which are built from randomly chosen diodes. This benefit, of using the random process over the sorted process, remains also after applying the optimization program.
The program achieved the efficiency improvement in only 200 iterations, an operation that takes less than 7 min. The average relative improvement of the program output is 14.2%. On a PV array with an efficiency of 15%, this is a 2.1% absolute improvement.
MEASUREMENTS AND COMPARISON
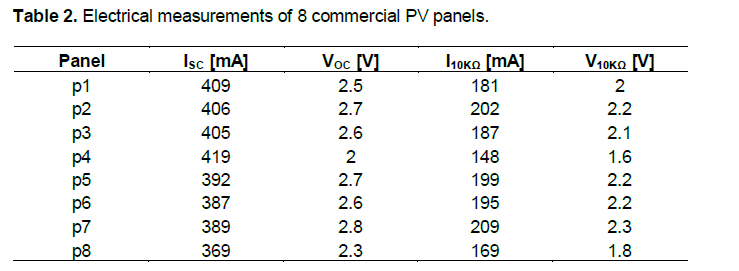
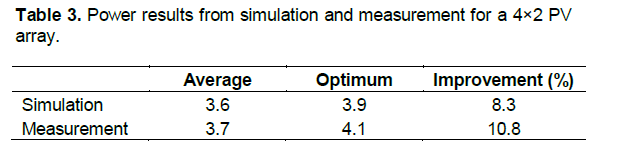
This study presents a comparison between simulations and actual measurement results from 8 commercial PV panels. The configuration being tested is made up of 2 vectors in parallel, in which each vector has 4 panels in serial (4×2 array).
Each panel is a serial connection of 8 diode cells. However, as mentioned in M-mismatch loss, from an electrical point of view a serial module can be treated as a unified diode that has a single I-V curve, with a single MPP (Solmetric, 2010). The area of an individual diode is 3×2 cm2, so the overall area of the PV panel (representing an "effective diode") is 48 cm2.
Based on simulation results, the expected improvement for 5×3 array was in the range of 10 to 20%. According to the expression for relevant permutation given in Simulation 1: All permutations, for an array of 4×2 there are 35 relevant permutations.
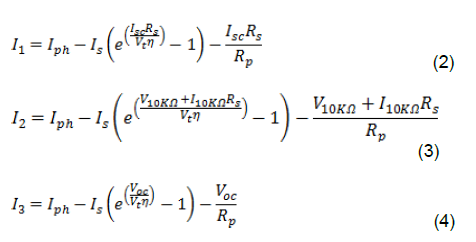
In order to pre-wire the PV array the parameters ISC, VOC, I10KΩ and V10KΩ (current and voltage when the load resistance is 10KΩ) were measured for each of the 8 panels. Table 2 lists these measurements. ISC, VOC, I10KΩ and V10KΩ represent three points in the panels' I-V curve: (0, ISC), (V10KΩ, I10KΩ), (VOC, 0). Using a best fit numerical program, the five reference parameters (Iph, η, Is, Rs and Rp) are extracted for each panel using the following PV equations derived from Equation 1:
Where: I1, I2, I3 - output currents; Isc, I10KΩ, V10KΩ, Voc - measured values and Vt =KT/q.
Since the effect of RP on I1, I2 and I3 is negligible, we arbitrarily set RP to be 1MΩ for all of the panels. Using these parameters, different 4×2 array combinations were built in the simulation program and power output was extracted for all of the 35 relevant configurations.
The simulation results gave an average power of 3.6 Watts and a maximum power of 3.9 Watts - which is an improvement of 8.3%. Four different arrangements of industrial 4×2 PV arrays were then built in arbitrary order with the real panels. Power was measured with a load resistance of 10 KΩ. The results of these arbitrary configurations were as follows: Arbitrary 1 = 3.9 Watts, Arbitrary 2 = 3.9 Watts, Arbitrary 3 = 3.6 Watts, Arbitrary 4 = 3.5 Watts. The average was then 3.7 Watts.
A fifth 4×2 PV array was built according to the best arrangement that the simulation found. The Power value with a load resistance of 10KΩ in this case was 4.1Watts a 10.8% improvement over the arbitrary configurations. The results are summarized in Table 3.
The simulation successfully predicts the PV panel arrangement (connectivity and panel position) that gives the best power value measured. The differences between the level of improvement claimed by the simulation and the actual measurements are mainly due to the effect of the load resistance conditions on power efficiency and the limited number of measurements. The five panel parameters were extracted by using a numerical method approximation from a limited number of load conditions (open, short and 10KΩ). Nevertheless, the simulation program found the specific arrangement of the PV array that achieved the best output power.
Additional methods of finding the parameters of the diodes can be found. For example, an analytical calculation of four parameters (Iph, η, Is and Rs) is presented based on an educated guess approximation and evaluation according to three points (0, ISC), (VMP, IMP), (VOC, 0) on the diode's I-V curve (Chenni et al., 2007). Another approach and technique is the MPP meter-card, which measures 256 I-V points and enables an accurate calculation and extraction of the parameters (Glotzbach and Kirchhof, 2009).
This paper proposes a solution to the power loss problem which occurs due to the module-mismatch in solar cell arrays. The number of all possible diodes arrangements in the solar cell array is huge. Without sorting and optimization procedures the typical MPP value of the wired array will approach the average value. However, by using the program and procedure presented in this article solar cell arrays can be made with a diode arrangement that yields the optimal MPP. The relative improvement of the output power is in the range of 10 to 20%, depending on the array size which dictates the overall number of relevant permutations.
It is evident at this point that the program achieves still finer results with as little as 200 iterations. The improvement will increase as the number of iterations is higher. At 200 iterations the program achieved a relative improvement of 14.2%; at 126,126 iterations (all permutations of 5×3 array) the program achieved a relative improvement of 14.8%.
The absolute improvement depends on the efficiency and size of the given PV system. If the efficiency of the PV system is, for example, 15% then the absolute improvement will be 2%. The program and procedure presented here can be realized with off-chip software for finding the optimal diodes arrangement in the solar array for optimal pre-wiring the diodes. Another application of the suggested program is to implement it with on-chip hardware, to enable dynamic configuration settings that reach a specific required power, voltage or current values, or optimized power conversion efficiency.
On-chip dynamic configurations are suitable for small solar power based applications and self-sustained low power consumption systems. Such systems or accessories are remote controls, reconfigurable mobile tags and sensors for irrigation and farming or any module that can be powered by a small sized photocell array.
In order to reconfigure the array arrangement in response to environmentally varying conditions, for example, temperature or triggering events (which may need a different voltage/current in different conditions to operate efficiently), additional integrated switching devices need to be realized. Nevertheless, as the typical generated photo current of such systems is relatively low, the requirement for low resistance of these switches is respectively not severe as in the case of large area solar arrays. The additional voltage drop and dissipated power penalty due to these switching devices can be low as well. It may be negligible in comparison to the added power efficiency achieved by the on-the-fly configuration optimization. This makes such systems particularly suitable platforms to implement the proposed dynamic procedure.
For large area photocells, which produce high currents, the proposed procedure and algorithm is more suitable for pre-sorting followed by fixed wiring of the selected optimal array arrangement.
The authors have not declared any conflict of interest.
REFERENCES
|
Braun M, Büdenbender K, Magnor D, Jossen FA (2009). Photovoltaic Self-Consumption in Germany - Using Lithium-Ion Storage To Increase Self-Consumed Photovoltaic Energy. IWES (Institute for Wind Energy and Energy System Technology). View |
|
|
Chenni R, Makhlouf M, Kerbache T, Bouzid A (2007). A detailed modeling method for photovoltaic cells. Energy 32(9):1724-1730.
Crossref |
|
|
|
Cooper SM (2008). Control of a Satellite Based Photovoltaic Array for Optimum Power Draw. Diss. Worcester Polytechnic Institute. |
|
|
|
Dzung N, Lehman B (2008). An Adaptive Solar Photovoltaic Array Using Model-Based Reconfiguration Algorithm. Industrial Electronics, IEEE Transactions 55(7):2644-2654. |
|
|
|
Endecon Engineering (2001). A Guide to Photovoltaic (PV) System Design and Installation, Engineering with Regional Economic Research, Inc. Version 1.0. June 14, 2001. |
|
|
|
Gaul SJ (2012). Series/Parallel Power Supply Switching. 10.16.2012. http://www.google.com/patents/US20110101787 |
|
|
|
Glotzbach T, Kirchhof J (2009). Novel Measuring System for Long Term Evaluation of Photovoltaic Modules. Institut für Windenergie und Energiesystemtechnik (IWES), Königstor 59, D-34119 Kassel, Germany, 21-25 September 2009. |
|
|
|
Henze N, Sahan B, Koirala B (2009). Study on MPP Mismatch Losses in Photovoltaic Applications. 21.9.2009. |
|
|
|
Kaushika ND, Gautam NK (2001). Mismatch losses and time to failure of solar PV arrays. In Proceedings of international solar energy society meeting, Adelaide, Australia. P. 336. |
|
|
|
Lee DM, Raichle BW (2013). A Side-by-Side Comparison of Micro and Central Inverters in Shaded and Unshaded Conditions. World Renewable Energy Forum, Denver, USA. 2012. |
|
|
|
Nelson Jenny (2003). The Physics of Solar Cells © Imperial College Press. Chapter 1 pp.13-15. |
|
|
|
Oldenkamp H, de Jong I, van der Borg N, de Boer B, de Moor H, Sinke WC (2004). PV-Wirefree versus conventional PV-systems: detailed analysis of difference in energy yield between series and parallel connected PV-modules. Power [W] 150(300):450. |
|
|
Picault D, Raison B, Bacha S, Aguilera J, De La Casa J (2010). Changing Photovoltaic Array Interconnections to Reduce Mismatch Losses: A Case Study. Published in EEEIC 2010 (International Conference on Environment and Electrical Engineering), Prague, Czech Republic.
Crossref |
|
|
|
Pongratananukul N, Kasparis T (2004). IEEE. Tool for Automated Simulation of Solar Arrays Using General Purpose Simulator. Proceedings on Computers in Power Electronics. Page, 10 – 14, 15-18, August 2004. |
|
|
|
Sager B (2014). Solar Panel with Reconfigurable Interconnections. Publication Date: 12.4.2014. http://www.google.com/patents/US20120112557 |
|
|
|
Sol-chip Saturn datasheet. (v2.4 – 11/2013) © Copyright Sol Chip Ltd. 2011-2013 www.sol-chip.com |
|
|
|
Solmetric Corporation (2010). Guide to Interpreting I-V Curve Measurements of PV Arrays. © Copyright Solmetric Corporation, 2010. |
|
|
|
Webber J, Riley E (2013). Mismatch Loss Reduction in Photovoltaic Arrays as a Result of Sorting Photovoltaic Modules by Max-Power Parameters. |