ABSTRACT
The main objective of this study is to investigate the economy-wide effect of improving road transport infrastructure. The study uses the updated and adjusted version of the 2005/2006 social accounting matrix of Ethiopia. The study applies a single country computable general equilibrium model. The simulation scenario is a reduction of trade and transport margin and an increase in the total factor productivity (TFP) of activities that produce trade and transport services due to public investment in road infrastructure (and hence better access to road infrastructure). The simulation results indicate that improving road transport infrastructure reduced the purchaser and supply price of marketed commodities. This facilitates transportation of commodities to the market and stimulates production; leading to an increase in domestic production in agriculture, trade, and manufacturing sector. The simulation results also indicate that expansion of road infrastructure results in welfare improvement among rural and urban households. Furthermore, better road transport infrastructure facilitates investment flow, foreign trade and hence accelerates economic growth (GDP) of the country. Therefore, public investment in road transport infrastructure should be considered as one of the policy pillars in the design of development policy and strategies of Ethiopia.
Key words: Road transport infrastructure, trade and transport margin, computable general equilibrium model, social accounting matrix, Ethiopia.
Road infrastructure is one of the core components to attain broad based and sustainable development. In the context of the geographical features of Ethiopia, settlement pattern and economic activity, road transport has a very significant importance for accelerating socio-economic development. Access to improved road creates an enabling environment for the promotion of agricultural and non-agricultural activities and stimulates the growth of all sectors of the economy. Ethiopia heavily relies on road infrastructure for public transport service
and its freight. Roads is the main transport modality in Ethiopia; it accounts for over 95% of passenger movement and motorized inter-urban freight (Ethiopian Road Authority, 2009). For the past two decades, the Ethiopian government massively engaged in the upgrading, rehabilitation, and widening of the road network across the country. Ethiopia’s road infrastructure expenditure is more than 3% of GDP in recent years.
Road network in the country quadrupled from 1997 to 2015, but the density of road is the lowest in Africa. About 60% of the Ethiopian rural populations are without access to all-weather roads (World Bank, 2016). Accessibility of rural roads is very low in Ethiopia; 10% of population in rural areas resided 2 km away from all-weather roads. This is only half of the benchmark level for Sub-Saharan Africa countries (Foster and Morella, 2011). Poor road transport is the major constraint of market access in the country. Long travel times and higher transportation costs arise because of poorly developed road infrastructure. This adversely affects economic activities and market access to rural households. Better access to road transport reduces travel time, it also reduces trade, and transportation costs. This facilitates access to market and rural non-agricultural employment, which have economy-wide effects. Furthermore, an improved access to road infrastructure potentially accelerates poverty reduction in the country. Trade and transport margins can be reduced through public investments on road infrastructure. The objective of this paper is to investigate and discuss the economy-wide effect of improving road transport infrastructure.
AN OVERVIEW OF ROAD INFRASTRUCTURE IN ETHIOPIA
Road sector development strategies of Ethiopia
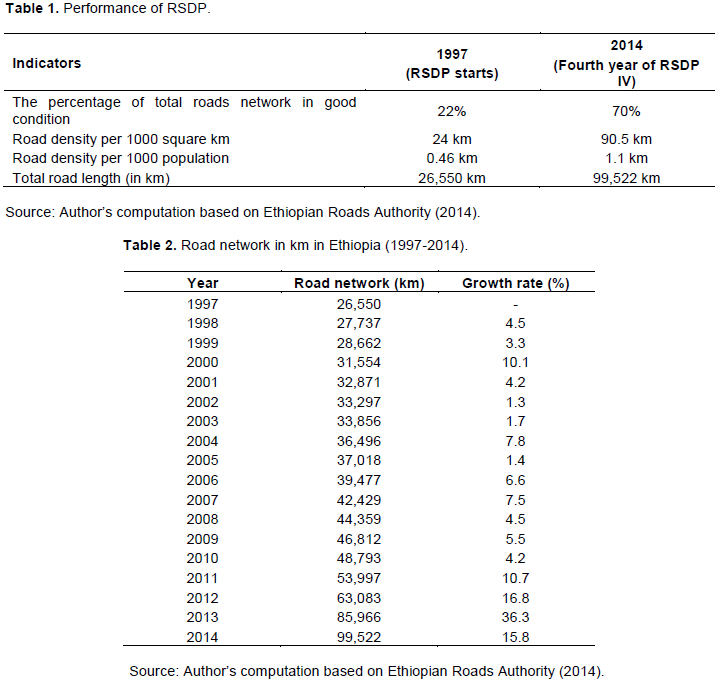
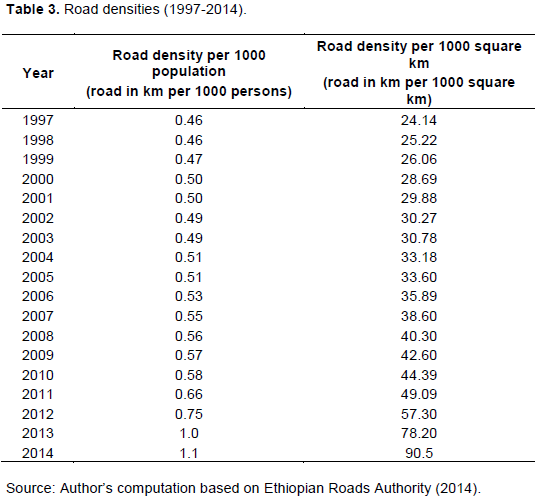
Public investment in road infrastructure is acknowledged as one of the pillars of rural development strategies of Ethiopia for the past two decades. Specifically, by recognizing the socio-economic significance of road transport, the government launched a Road Sector Development Program (RSDP) in 1997. The main objectives of RSDP were rehabilitation, upgrading and expanding road network by construction of new road across the country. RSDP was implemented in four separate phases: RSDP I (run from July 1997 to June 2002), RSDP II (run from July 2002 to June 2007), RSDP III (run from July 2007 to June 2010) and RSDP IV run from July 2010 to June 2015 (Ethiopian Roads Authority, 2014).The major achievements of RSDP from 1997 to 2014 include the total network of road increased from 26,550 to 99,522 km and the share of roads in good condition increased from 22 to 70%. Furthermore, road density per 1000 square km increased from 24 to 90.5 km and road density per 1000 population increased from 0.46 to 1.1 km (Table 1).
Trends of road network in Ethiopia
The aggregate road network stock in Ethiopia was 6400 km in 1951 and the size of the road network reached to 9160 km in 1973 with the annual growth rate of 2.05%. In the derg regime (1974-1991), the total stock of road network reached 19017 km with 6.2% annual rate of growth (Ethiopian Roads Authority, 2009; Worku, 2011). Since the inception of RSDP, rehabilitation and construction of new road network has been widening across the country. Road network size of the country from 1997 to 2014 is described in Table 2. The total road network in Ethiopia increased from 26,550 km in 1997 to 99,522 km in 2014 and the sizes of road network annually grow on average by 8.4 km. The rates of growth of road networks are bigger in the current regime relative to the past regime of Ethiopia.
Road density in Ethiopia
Road density defined as the ratio of the length of the aggregate road transport network in the country to the total area of land in the same country. In other words, road density can be defined as road length per 1000 square km of land area or length of road per 1000 person. Density of road is a rough indicator for measuring road accessibility (World Bank, 2008). In Ethiopia, road density per 1000 person increased from 0.46 km in 1997 to 1.1 km in 2014. On the other hand, density of road per 1000 square km increased from 24.14 km in 1997 to 90.5 km in 2014 (Table 3).

Financing of road development
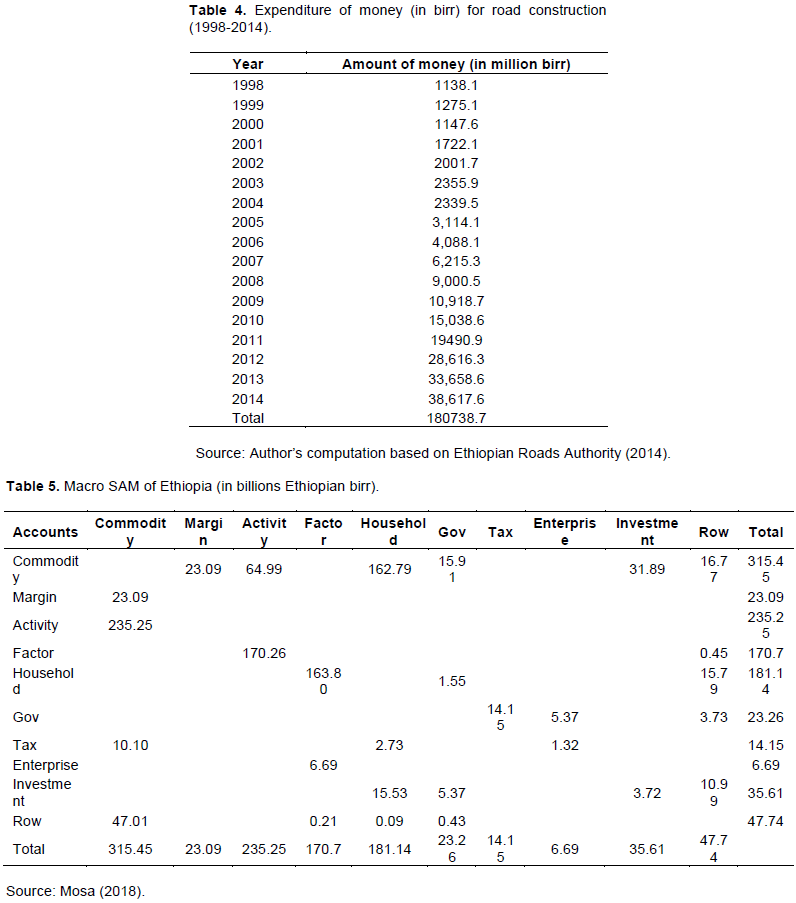
Large amounts of capital are invested for the development of road transport network throughout the country. Table 4 shows annual expenditure for road construction in Ethiopia from 1998 to 2014. During this period, a total of 180.7 million birr was invested for road development in the country. The main source of funding to finance road investment was obtained from domestic source (78.8%) and the remaining 21.2% collected from international sources. The external source of finance for road development mainly acquired from World Bank, European Union, China, African Development Bank and Japan (Ethiopian Roads Authority, 2014).
Data
The source of data for this study is the 2005/06 updated social accounting matrix (SAM) of Ethiopia (Mosa, 2018). The 2005/06 SAM of Ethiopia was built by Ethiopian Development Research Institute in collaboration with the University of Sussex (Tebekew et al., 2009). However, the 2005/06 SAM of Ethiopia is updated by Mosa (2018); specifically, the household, factor, activity, and commodity accounts in the SAM are updated. A SAM represents the circular flow of the economy that captures transactions and transfers between all economic agents in the system for a particular period, usually for a year. Every transaction in the SAM is shown in a cell. Each cell in the SAM describes the flow of funds from the column to the row account. The receipts (income) are recorded in the row whereas the payments (expenditures) are recorded in the column (Pyatt and Round, 1985; Round, 2003). SAMs are generally built by incorporating the following account groups: activities, commodities, factors, institutions (household, enterprise, and government), savings and investment, and the rest of the world.
The updated SAM used for this study comprises of 199 activities and 194 commodities, 34 household groups, 31 factors of production (10 labor categories and 21 other factors), 17 tax accounts, trade and transport margins, savings and investment, stock changes, enterprises, government and rest of the world. Therefore, the updated SAM comprises of 481 row and column accounts. The detail documentation of the updated SAM can be referred to in Mosa (2018).
Relevant activities and commodities accounts are included in the SAM for making the SAM suitable for addressing the objectives of this study. Specifically, in the updated SAM, separate activity accounts such as trade, transport, communication, and storage are created. Similarly, separate commodity accounts such as trade, transport service and communication included in the updated SAM. Furthermore, trade and transport margin is treated as separate account in the updated SAM. The balanced macro SAM of Ethiopia is depicted in Table 5.
For example, the margin in the SAM is 23.09 billion birr that is cost of trade and transport margin for supplying marketed commodities. The total commodity supply in the market is 315.5 billion worth of birr, out of this 235.3 billion birr (81.9%) sourced from domestic supply of commodities, 47 billion birr (14.9%) derived from commodities imported from the rest of world, and the rest 10.1 billion birr (3.2%) is a tax payment (Table 5).
This study study uses Computable General Equilibrium (CGE) model. The CGE model is a system of equations that illustrate the economy as whole and the interaction among its parts. The term CGE composed of three terms: “Computable,” “General” and “Equilibrium.” “Computable” means that the model has a solution or solvable and can generate numerical results. “General” refers that the model integrates the behaviour of the entire agents in the economy. Agents in the economy incorporate producers, households, government, saving-investment, and the rest of the world. “Equilibrium” refers to agents in the economy are optimizing their objectives given budget, time and other resource constraints (Burfisher, 2011).
The analysis of this study applies the STAGE CGE model developed byMcDonald (2015). STAGE is a single country CGE model and it is implemented in General Algebraic Modelling System (GAMS). It is a SAM based model. The SAM helps to distinguish economic actors, and it provides the database for calibration of the model. Behavioural relationships in the STAGE model comprise of linear and non-linear relationships. Households choose a bundle of commodities to consume in order to maximize Stone-Geary utility function. The commodities consumed by households are a composite of imported and locally produced commodities. The constant elasticity of substitution (CES) is used to combine imported and locally produced commodities by assuming that these commodities are imperfect substitutes using the Armington assumption (Armington, 1969).
In the STAGE model, a single activity can produce multiple commodities and commodities can be produced using multiple activities by assuming that the proportionate composition of each activity’s production of commodity outputs remains the same. Domestically produced commodities are provided to the domestic market or to export. Domestically produced and exported commodities are aggregated by a constant elasticity of transformation (CET) function. The relative prices control the optimal supply of domestically produced commodities for local and export markets. This model is flexible for modelling small countries (that is, being a price taker) or large countries (that is, being a price maker). The STAGE CGE model is calibrated using the updated SAM of Ethiopia. STAGE CGE is an appropriate model for addressing the objectives of this study. This is because the model has a separate block of equations for accommodating the trade and transport margin. Trade and transport margin refers to the cost of transporting commodities to consumers that is the difference between producer price and consumer price excluding indirect taxes. The detailed documentation of STAGE CGE model can be referred to McDonald (2015).
Policy simulations and model closure rules
Policy scenarios
Scenario one (reducing trade and transport margins): Investment in road infrastructure expands the size of the road transport network and increases road density in the country. Road density is defined as the ratio of aggregate length of road transport in the country to the total size of the country. It is also described as road length per 1000 square km of land area or length of road per 1000 person. Increased road density facilitates transportation services that reduce the costs of transportation and hence transport margins. The effect of road density on transport margins can be obtained through the estimation of the elasticity of the transport margin with respect to road density. The elasticity of the transport margin with respect to road density is estimated by Schürenberg-Frosch (2014)and adopted for the purpose of this study.
Schürenberg-Frosch (2014)estimated these elasticity using an econometric model based on a panel data sourced from a sample of 58 countries, 28 of which are Organisation for Economic Co-operation and Development (OECD) countries and 30 developing and transition economics including some of sub-Saharan countries such as Tanzania, Egypt, and Zambia. Alike to Ethiopia, most of these sub-Saharan countries have low road density and have comparable economic characteristics that make sense to adapt transport margin to road density elasticity calculated from these countries. Schürenberg-Frosch (2014)estimated the elasticity of transport margins with respect to road density to be 0.19 and 0.16 for agricultural and non-agricultural commodities, respectively. In other words, 1% increase in road density results in a transport margin decline by 0.19% for agricultural commodities and by 0.16% for non-agricultural commodities.
The first scenario is carried out based on the road budget and the growth rate of road network density during the period of the Growth and Transformation Plan of Ethiopia (GTP) (2010-2015). During the GTP period, 7.4 billion birr was invested for road construction annually and on average the road density annually expanded by 22% (Ministry of Finance and Economic Development, 2014). Since the Ethiopian government made huge investments in the road sector in the past two decades, only a small increase in road investment is assumed for the future. In this scenario, we assumed only half of the GTP period’s annual road budget (that is 3.7 billion birr) is invested for road infrastructure that would expand
road density by 11%
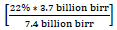
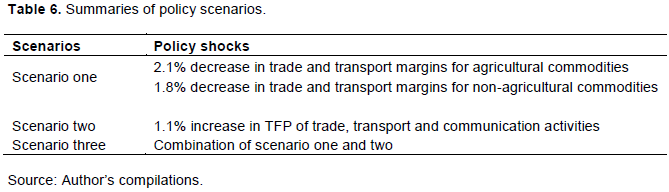
(based on the GTP period’s road density growth and road budget). Based on the above-mentioned elasticity of transport margins with respect to road density, this is equivalent to a 2.1% (11%*0.19) reduction of trade and transport margins for agricultural commodities and a 1.8% (11%*0.16) reduction for non-agricultural commodities. Therefore, this scenario is a 2.1% reduction of trade and transport margins for agricultural commodities and 1.8% reduction of trade and transport margins for non-agricultural commodities.
The cost of financing road infrastructure can be acquired from domestic sources and international donors. During the GTP period (2010-2015), 79% of the funds for the road investment came from domestic sources and the remaining 21% were collected from international sources (Ethiopian Roads Authority, 2015). Based on these figures, the government savings and foreign savings are considered the sources of finance for building road infrastructure in all scenarios. Government treasury is the largest source of funds for road investment and hence the larger share of funds is obtained from the government savings relative to foreign savings. In the SAM updated for this dissertation, the total government savings are 5.4 billion birr and foreign savings are 10.9 billion birr in the updated SAM. Thus, the required fund (3.7 billion birr) is generated through a 38% increase in government savings (that is 2.1 billion birr) and a 15% increase in foreign savings (that is 1.6 billion birr). This funding leads to the road network density expanding by 11%.
Scenario two (Increasing TFP of activities that produce trade and transport services: Improved access to road infrastructure facilitates transportation of commodities to the market. Better access to road transport potentially increases the efficiency of activities that produce trade and transport services such as trade, transport, and communication. The TFP effect of better access to road infrastructure is obtained through the elasticity of the TFP of activities that produce trade and transport services with respect to public expenditure on road infrastructure that is adopted from Fan and Rao (2003). Fan and Rao (2003)using an econometrics model estimated the elasticity of public expenditure to productivity of trade and transport service based on the aggregate data from 1980 to 1998 for 17 sub-Saharan countries including Ethiopia.
According to Fan and Rao (2003), the elasticity of TFP of trade and transport services with respect to public expenditure on road infrastructure is 0.021 for Sub-Saharan African countries that is a 1% increases in public expenditure for road infrastructure results in a 0.021% increase in the TFP of activities that produce trade and transport services. The increased government savings and foreign savings for building road infrastructure from scenario one is applied to this scenario.
Thus, a 38% increase in government savings and a 15% increase in foreign savings results in a 0.79% (38%*0.021) and 0.32% (15%*0.021) increase in the TFP of activities that produce trade and transport services respectively. Therefore, in this scenario, TFP of activities produces trade and transport services increase by 1.1% (0.79 + 0.32).
Scenario three: Combination of scenario one and two: Since improved access to road infrastructure reduces trade and transport margins and simultaneously increases TFP of activities that produce trade and transport services, it is expected that the combined scenarios would have larger economy-wide effects relative to the separate effects.
Therefore, scenario one and scenario two are combined to constitute scenario three; a reduction of the trade and transport margin by 2.1% for agricultural commodities and by 1.8% for non-agricultural commodities and in the same scenario, the TFP of trade, communication and transport activities increasing by 1.1%. For financing road infrastructure, government savings exogenously increase by 38% and foreign savings increase by 15% in all scenarios. The policy scenarios are summarized in Table 6.
Model closure rules
The external balance is fixed and the exchange rate is flexible to clear the external balance. The exchange rate is flexible to produce the required level of foreign savings for funding road infrastructure. Investment driven saving is assumed where investment is fixed and saving adjusted for the change in the investment demand. Government raises funds through income tax replacement. Government savings are fixed and income tax rates endogenously adjusted to produce a fixed level of government savings for financing the building of road infrastructure. The consumer price index (CPI) is chosen as a numeraire.
Furthermore, factor supply is fixed and in order to enable the mobility of water fetchers and firewood collectors across different sectors, perfect factor mobility is assumed in the model. Next is reports of the policy impact on domestic commodity prices, household consumption, domestic production, welfare, and major macroeconomic indicators.
Changes in commodity prices
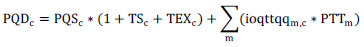
The effect of a decline in trade and transport margins and increase in TFP of activities that produce trade and transport services are injected in the economy through the purchaser price of composite commodities (PQD), which is defined as follows:
Where PQSc is the supply price of commodity c, TSc is the sales tax rate, TEXc is the excise tax rate, ioqttqqm,c is the quantity of transport margin ‘m’ used per unit of domestic demand and PTTm is the price of the trade and transport margins.
Better access to road transport infrastructure mainly affects prices of marketed commodities. This is because these groups of commodities use the services of trade and transport. The decrease in trade and transport margins and increase in TFP of activities that produce trade and transport services reduce the gap between consumer price and producer price. Table 7 depicts the implication of lower trade and transport margins and increase in TFP of activities that produce trade and transport services on consumer price (PQD) and producer price (PXAC). In response to less trade and transport margins and higher TFP, the consumer price for marketed commodities declines in all scenarios. In scenario one, the consumer price decreases by 0.8% for both market food and market non-food. In the second scenario, PQD decreases by 0.4% for market food and by 0.9% for market non-food commodities. Furthermore, the PQD for market food and market non-food decreases by 0.9 and 1%, respectively, in the third scenario.
The producer price for own consumed commodities increased in all scenarios. Specifically, it increases by 0.8% for both Home production for home consumption (HPHC) food and HPHC non-food commodities in the first scenario and by 0.3% for HPHC food commodities and by 0.7% for HPHC non-food commodities in the second scenario. In the third scenario, the producer price increases by 0.9% for both HPHC food and HPHC non-food commodities. Even though the policy scenarios do not directly affect HPHC commodities, the producer price of these commodities is influenced indirectly through the income effect. Specifically, improved road transport infrastructures facilitate market supply of commodities that enhances domestic production and increases income of households. This leads to increases in the demand for own consumed commodities and hence the PXAC for these commodities rises in all scenarios.
Changes in household consumption
The policy scenarios also affect household consumption. Table 8 describes the impact of improved road transport on the consumption of commodities. Consumption of marketed and HPHC commodities increases in all scenarios. Lower trade and transport margins result in lower PQD for marketed commodities that make these commodities relatively cheaper and hence household consumption increases. Furthermore, increased TFP of activities that produce trade and transport services facilitates the transportation of commodities. This results in extra commodity supply in the market and lower PQD and enhances consumption.
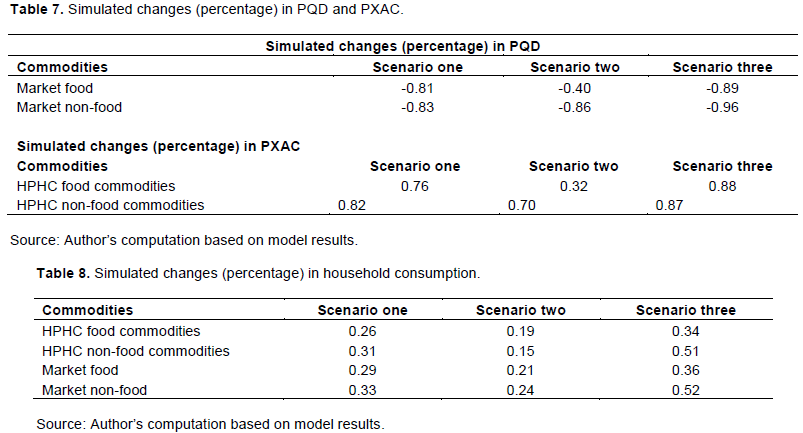
Accordingly, household demand for marketed commodities increases in the first scenario: by 0.3% for both market food and non-food commodities. In the second scenario, the consumption of marketed commodities also increases: by 0.2% for both market food and non-food commodities. Similarly, the consumption of marketed commodities also increases in the third scenario: by 0.4% for market food and by 0.5% non-food commodities. Trade and transport margins constitute a higher share of the cost of marketed non-food commodities in comparison to marketed food commodities. Therefore, due to less trade and transport margins, consumption of marketed non-food commodities increases more compared to marketed food commodities.
The policy simulations also influence household consumption of HPHC commodities. Consumption of HPHC food commodities increases in all scenarios: by 0.3% in scenario one, by 0.2% in scenario two and by 0.3% in the third scenario. Likewise, the consumption of HPHC non-food commodities also increases in all scenarios: by 0.3% in the first scenario, by 0.2% in the second scenario and by 0.5% in the third scenario. Although trade and transport margins do not directly affect HPHC commodities, the consumption of these commodities increase due to the income effect. Particularly, domestic production is enhanced by improved road infrastructure (Table 9) that led to increased household income and hence increased consumption of HPHC commodities.
Changes in domestic production
Less trade and transport margins and higher efficiency facilitate trade activities, encourage larger supply of commodities to the market, and enhance domestic production. Table 9 depicts the implication of lower per unit margin requirements and improved TFP on domestic production. The simulation results indicate that production increases in agricultural and non-agricultural sectors (industry and services) in each scenario. Agricultural production increases in all scenarios: by 0.1% in scenario one and scenario two and by 0.2% in the third scenario. Service production also increases: by 0.6% in the first scenario, by 0.8% in the second scenario and third scenario. Similarly, industrial production increases: by 1.1% in the first scenario, by 0.8% in the second scenario and by 1.4% in the last scenario.
Since trade and transport margins are higher for non-agricultural commodities relative to agricultural commodities, the reduction of margins provides bigger incentives for non-agricultural production. For instance, industrial production increases by a larger proportion relative to other sectors in all scenarios. Furthermore, domestic production increases by larger proportions in the third scenario relative to scenarios one and two; this is because the combined effects of lower trade and transport margins and increased efficiency have a stronger effect on domestic production relative to the separate effects.
Changes in household welfare
Table 10 describes the welfare implication of lower trade and transport margins and improved TFP of activities that produce trade and transport services. Simulation results indicate that expansion of road infrastructure results in welfare improvement among all household groups except non-poor households located in urban areas. However, the amount of welfare gain varies across households. Welfare gains are driven by the increase in the consumption of households in response to lower prices. Households that consume a larger proportion of market non-food commodities are relatively better off than other households are. This is because the cost of margin services accounts for a relatively high proportion of the total expenditure of market non-food commodities. Accordingly, lower trade and transport margins and improved efficiency strongly increase the consumption of market non-food commodities and hence contribute to the well-being of households.
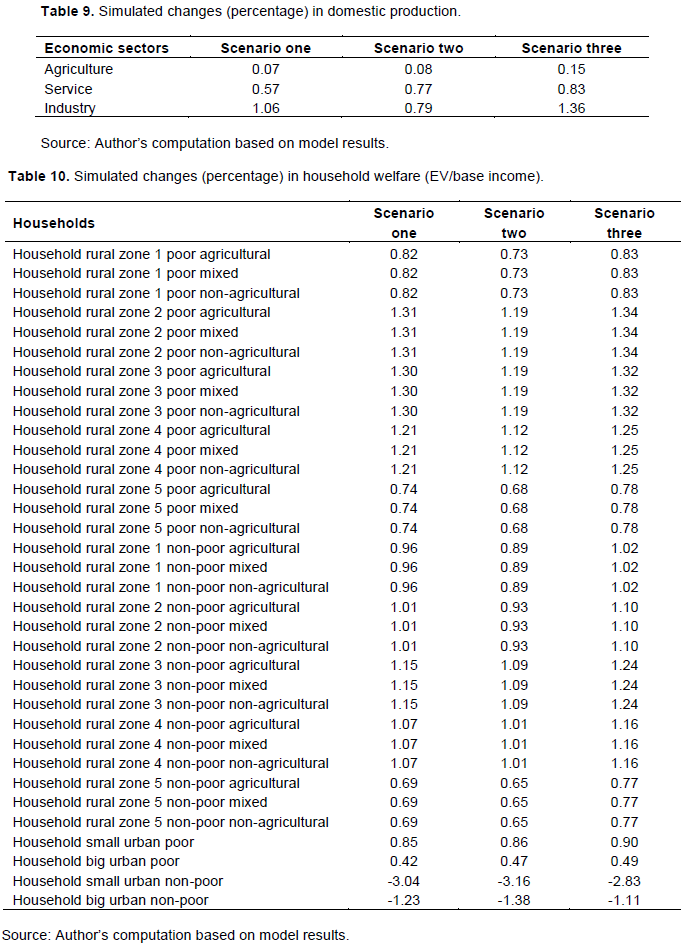
Furthermore, lower transport margins and improved efficiency decrease the cost of production and facilitate domestic production (Table 9) leading to increased factor income to households (Appendix Table 1) and hence positive welfare effects. Only the welfare of non-poor urban households declines in all scenarios because those households pay the largest share of taxes.
Macroeconomic effects
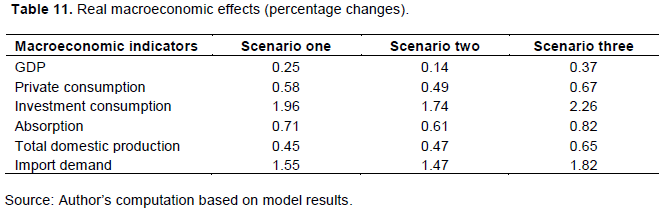
Reducing trade and transport margins and increasing the TFP of activities that produce trade and transport services create economy-wide effects and positively affect the entire macroeconomic indicators such as GDP, private consumption, investment consumption, absorption, total domestic production and import demand. Table 11 depicts macroeconomic implications of reducing trade and transport margins and improved efficiency. For instance, in the first scenario GDP increases by 0.3%, private consumption by 0.6%, investment consumption by 1.9%, absorption by 0.7%, total domestic production by 0.5% and import demand by 1.6%. In the second scenario, total domestic production increases by 0.5%, GDP by 0.1%, private consumption by 0.5%, investment consumption by 1.7%, absorption by 0.6% and import demand by 1.5%. Similarly, in the third scenario GDP increases by 0.4%, total domestic production by 0.7%, private consumption by 0.7%, investment consumption by 2.3%, absorption by 0.8% and import demand by 1.8%. Improved road infrastructure facilitates trade and transport activities in the economy that enhance transportation of commodities into the market and results in lower prices of commodities. This leads to an increase in domestic demand and hence more domestic production, which accelerates the growth of the economy and increases GDP.
Sensitivity analysis
Sensitivity analysis is conducted to ensure the stability of model results in response to changes in behavioural parameters. Since better access to road infrastructure mostly affects marketed commodities, sensitivity analysis is carried out by changing the income elasticity of demand for these commodities. In other words, because the reduction in margin and increase in TFP of activities that produce trade and transport services is injected to the economy through purchaser prices of marketed commodities, the income elasticity of demand for these commodities is selected for sensitivity analysis. Specifically, the income elasticity of demand for marketed commodities increases and decreases by 50%. The details of the sensitivity of demand for marketed commodities, domestic production, household welfare, and macroeconomic effects in response to a 50% increase and decrease in the income elasticity of demand are reported in Appendix Tables 2 to 6. Household consumption of market commodities is sensitive to the change in the income elasticity of demand for marketed commodities. The higher the income elasticity of demand, the larger the change in consumption of marketed commodities across all scenarios.
Similarly, domestic production is sensitive to the change in the income elasticity of demand for marketed commodities. The higher the income elasticity of demand, the larger the increase of domestic production in all scenarios. Household welfare is also sensitive to the change in income elasticity of demand. The magnitude of welfare gain varies by a small margin in response to the change in the income elasticity of demand. The biggest welfare gain (or the smallest loss) is achieved at the higher income elasticity. Furthermore, macroeconomic indicators such as GDP, absorption, total domestic production and import demand are sensitive to the change in the income elasticity of demand. A lower income elasticity of demand leads to smaller macroeconomic effects across all scenarios. The sensitivity analysis indicates that changes in income elasticity of demand for marketed commodities cause a change in the magnitude of the consumption of commodities, domestic production, household welfare, and real macroeconomic indicators. Although changes in the income elasticity of demand for marketed commodities lead to changes in the size of simulation results, the directions as well as the order of magnitude of changes remain the same in all scenarios.
Ethiopia is heavily dependent on road infrastructure for transportation services. However, access to rural roads is still very low in Ethiopia. Poor road transport is a major constraint of market access and non-agricultural activities in the country. The aim of this paper is to investigate the economy-wide effect of improving road transport infrastructures. Better access to road infrastructure potentially reduces per unit trade and transport margins and increases efficiency of transporting commodities into the market. Three policy scenarios are conducted in this paper. Based on the growth rate of road network density during the GTP period, trade and transport margins are reduced by 1.8 to 2.1% in the first scenario. The TFP of activities that produce trade and transport services is increased by 1.1% in the second scenario. Scenario one and two are combined to form the third scenario with the expectation it might produce a larger effect. The cost of financing road infrastructure is sourced from government savings (government raises funds through income tax replacement) and foreign savings (international aids/loans).
The policy simulations indicate that lower margins and increasing TFP result in a reduction of PQD for marketed commodities across all scenarios. Household consumption and domestic production of agricultural and non-agricultural sectors are positively affected by the policy simulation. Furthermore, the simulation scenarios also indicate that expansion of road infrastructure results in welfare improvement among rural and urban households. The policy simulation also affects real macroeconomic indicators including GDP, investment consumption, private consumption, absorption, total domestic production, and import demand. All the policy scenarios depict the expected outcome. There is no huge difference between scenario one and two for most simulation results. As expected, the third policy scenario produced a larger effect relative to the separate effects of scenario one and two. As scenario one is carried out based on empirical literature, it seems to be the most realistic policy simulation.
Even though the simulation results are sensitive to the change in the income elasticity of demand for marketed commodities, the direction of changes is unaltered in all scenarios. Improved access to road transport is tremendously important for the promotion of both agricultural and non-agricultural activities. Therefore, improvement of road transport infrastructure should be considered as one of the policy pillars in the design of development policy and strategies of Ethiopia.
The authors have not declared any conflict of interests.
REFERENCES
|
Armington PS (1969). A Theory of Demand for Products Distinguished by Place of Production. IMF Staff Papers 16(1):159-178.
Crossref
|
|
|
|
Burfisher M (2011). Introduction to Computable General Equilibrium Models. New York: Cambridge University Press.
Crossref
|
|
|
|
|
Ethiopian Roads Authority (2009) RSDP Performance: Twelve Years Later. Addis Ababa.
|
|
|
|
|
Ethiopian Roads Authority (2014). Road Sector Development Program 17 Years Performance Assessment. Addis Ababa.
|
|
|
|
|
Ethiopian Roads Authority (2015). First Growth and Transformation Plan Five Years (2003-2007) and EFY 2007 Performance Report. Addis Ababa.
|
|
|
|
|
Fan S, Rao N (2003). Public Spending in Developing Countries: Trends, Determination and Impact. 99. Washington, D.C.
|
|
|
|
|
Foster V, Morella E (2011). Ethiopia's Infrastructure: A Continental Perspective. 5595. Washington DC.
Crossref
|
|
|
|
|
McDonald (2015). A Static Applied General Equilibrium Model: Technical Documentation STAGE Version 2 Draft. Stuttgart.
|
|
|
|
|
Ministry of Finance and Economic Development (2014). Growth and Transformation Plan Annual Progress Report for EFY 2012/13. Addis Ababa.
|
|
|
|
|
Mosa (2018). Non-agricultural Activities and Household Time Use in Ethiopia: A Computable General Equilibrium Model Analysis, PhD Dissertation. University of Hohenheim.
|
|
|
|
|
Pyatt G, Round JI (1985). 'Social Accounting Matrices: A Basis for Planning', in Pyatt, G. and Round, JI (eds) A World Bank Symposium. Washington, D.C.
|
|
|
|
|
Round J (2003). Social accounting matrices and SAM-based multiplier analysis - Chapter 14. In F. Bourguignon & L. A. P. da Silva (Eds.), Techniques and tools for evaluating the poverty impact of economic policies (pp. 301-324). Washington, DC: World Bank and Oxford University Press (September).
|
|
|
|
|
Schürenberg-Frosch H (2014). 'Improving Africa's Roads: Modelling Infrastructure Investment and Its Effect on Sectoral Production Behaviour. Development Policy Review 32(3):327-353.
Crossref
|
|
|
|
|
Tebekew T, Amoge A, Teferra B, Seyoum Z, Amha M, Beyene H, Fisseha E, Tsehaye E, Ahmed H, Robinson S, Willenbockel D, Dorosh P, McDonald S (2009). Ethiopia Input Output Table and Social Accounting Matrix. Addis Ababa.
|
|
|
|
|
Worku (2011). Road Sector Development and Economic Growth in Ethiopia. Ethiopian Development Research Institute, Working Paper 004. Addis Ababa.
|
|
|
|
|
World Bank (2008). World Development Indicators. Washington DC.
|
|
|
|
|
World Bank (2016). Federal Democratic Republic of Ethiopia Priorities for Ending Extreme Poverty and Promoting Shared Prosperity Systematic Country Diagnostic. Washington DC.
|
|