Full Length Research Paper
ABSTRACT
The objective of this study is to measure the productive efficiency of the external debt of the Togo economy. To do this, the technique of stochastic production frontier used by Drine and Nabi was used to assess the contribution of different factors, especially external debt to the productivity performance over the period from 1980 to 2012. The study results confirm the non-linear effect of external indebtedness on productive efficiency. They show an increase in the external debt level to gross domestic product (GDP) which improves the productive efficiency of the Togo economy. The determination of the efficiency scores by the data envelopment analysis method in mono input and mono output shows that the external debt was not used in an optimal way in the production on the period of the study. However, this productive inefficiency can also be explained by an inefficiency of scale. This result calls therefore to a better allowance of the external debt.
Key words: External debt, stochastic frontier analysis (SFA), data envelopment analysis (DEA), productive efficiency, Togo.
INTRODUCTION
In recent decades, the economic environment of low-income countries, especially those in Africa, has been marked by an external debt crisis which is very high. Stock and external debt service of these countries have increased continuously. In Togo, public finances were characterized by a chronic budget deficit that resulted in an accumulation of both domestic and external payment arrears. The total external debt of Togo, which was 2.2 billion USD in nominal value at the end of 2007, accounted for 72% of gross domestic product (GDP). After the cancellation of part of the debt with the attainment of the completion point of the HIPC Initiative, it amounted to 33.4% of GDP in 2010. However, if the external public debt represented only 27.5% of GDP in 2011, it knows a revival, watching closely the loans that are obtained after debt relief to finance infrastructure.
It is clear that external debt is an important funding source for an economy characterized by low domestic savings. However, like the "debt cycle" proposed by Avramovic (1964), several developing countries appear to be trapped in the first stage as the stock of external debt is increasing while their per capita income is still low.
Has the external debt, which is expected to finance development, become an obstacle to the same development? To move to the second stage of this "debt cycle", these countries had to achieve sufficient and sustained economic growth, the growth of total factor productivity and/or by the accumulation of factors of production. To this end, Grosskopf (1993) distinguishes productive efficiency, in addition to technological progress as a vector of growth of total factor productivity.
To look at the weakness of the technological progress in Togo as in most developing countries and to achieve the growth of the total productivity of the factors could depend on a better use of the production factors that leads to an improvement of the productive efficiency. It is then interesting to analyze the following problem: has the public external debt improved or otherwise damaged productive efficiency in Togo?
The objective of this study is to measure the productive efficiency of the external debt of Togo economy. In other words, this to show if the external debt is effective in improving the productivity of Togo economy. To do this, the study used the technique of stochastic production frontier initially used by Aigner et al. (1977) and taken up by Drine and Nabi (2007) to assess the effect of external debt on productive efficiency of Togo economy during the period of 1980 to 2012.
Macroeconomic framework
Togo's economy has suffered from the serious socio-political crisis that began in 1991, and led to a suspension of aid to many multilateral and bilateral partners. This aid has gradually resumed since 2007, allowing in particular starting rehabilitate infrastructures that were much degraded. The revival of GDP growth that began in 2009 with the stabilization of the socio-political situation, and the return of donors continued and would be increased from 4.9% in 2011 to 5.9% in 2012. Also, inflation is contained under the West African Economic and Monetary Union (WAEMU) norm of 3%. With an estimated income to 607 USD/capita in 2012 (1096 USD PPP), Togo is among the least developed countries (LDCs). Human development index (HDI) is 159th out of 187 of the 2012 UNDP report. 38.5% of the population lived below the poverty line of USD 1.25 a day in 2012. In terms of business environment, Togo is ranked 156th out of 185 in 2013.
The agricultural sector represents 41% of GDP in 2011, and employs over 75% of the workforce. Cotton, coffee and cocoa are the traditional agricultural exports of Togo, and represent 8% of total exports in 2011. Cotton production, which reached a maximum of 187,000 tons in the past, is recovering after a long crisis. It reached 82.000 tons for the 2012 to 2013 campaign. Coffee and cocoa plantations have aged and need to be regenerated. The growth in production of cereals (maize in particular) is remarkable. It increased from 741 000 tons in 2000 to 1,265,000 tons in 2012. Togo becomes net exporter of corn in the sub region.
The secondary sector (16.8% of GDP) long affected by a deterioration of the situation in the extractive industries, primarily phosphate, due to the deterioration of equipment and of the public company SNPT management deficiencies, is experiencing recovery of investment.
This recovery primarily concerns the sector of clinker and cement, where ScanMines – Togo and Heidelberg cement group, set up a clinker production unit at a cost of 254 million USD which begun to be exploited since 2014. The completion point of the HIPC initiative was reached late 2010. This resulted almost immediately an overall reduction of 1.8 billion USD, accounting for 82% of external debt in nominal. In terms of ratio to GDP, external debt rose from 81.4% in 2007 to 17.2% in 2010. Togo has reindebted quickly and its debt exceeded 45% of GDP to 31st December, 2012 according to official statistics.
LITERATURE REVIEW
In the cases of several countries, studies have analyzed the effects of debt on growth and total factor productivity. Drine and Nabi (2007) analyzed the effect of public external indebtedness on productive efficiency. In the first part, through an endogenous growth model with overlapping generations, they showed that an increase in the share of public external debt has two opposite effects. On the one hand, it increases the positive externalities and increases production efficiency. On the other hand, it exerts a crowding out effect on the formal private sector, reducing its size in favor of a less efficient informal sector.
The marginal effect of public external indebtedness on efficiency becomes negative when its share of the total external debt exceeds an optimal threshold. In the second part, they used the method of stochastic frontier production to test the effect of external indebtedness on productive efficiency of a sample of 28 developing countries between 1970 and 2005. Their results confirm the nonlinear effect of public external indebtedness on productive efficiency, and shows that the optimal share is about 84%. They also found that reducing the share of public external debt from ninety years has contributed to the improvement of production efficiency.
Similarly, a study of Patillo et al. (2002) of 93 developing countries over the period 1969 to 1998 also shows a non-linear effect of external debt on growth. Moreover, Patillo et al. (2004) in an empirical study on a sample of 61 developing countries between 1969 and 1998 found that the negative impact of debt on growth is due to its negative effects on the accumulation of physical capital (1/3 contribution on average) and total factor productivity (2/3 of an average contribution). The negative effect of external debt on total factor productivity has been identified by Akinlo (2006) for 34 countries in Sub-Saharan Africa during the 1980 to 2002 period. The approach used is in two stages. The first is to estimate the Solow residual from a specification of the Cobb-Douglas production function. The second step is to regress the term of the Total Factor of Productivity (TFP) on macroeconomic variables.
Analysis tools
The study of efficiency refers to the question of the optimal use of resources in production. The theoretical framework for the efficiency measurement was initially developed by Farrell (1957) to measure the efficiency of firms or decision units (DU) in the framework of a production process. According to Farell (1957), the total efficiency or economic of decision units operating on the border is composed of two elements:
1. Technical efficiency: One unit is technically efficient if it produces as much output as possible with a given amount of inputs, or if it produces a given level of output with a minimum amount of inputs.
2. Allocative efficiency: One unit is allocatively efficient if, firstly, it is technically efficient and if, secondly, it uses the resources and services produced in such quantities that after consideration of Price, minimizes production costs and maximize revenue.
Measuring Efficiency: Conceptual framework and estimation methods
The measure of efficiency emerged in the work of Koopmans (1951) relating to the analysis of production and Debreu (1951) who introduced the coefficient of resource utilization. In 1957, Farrell found that the efficiency of a firm can be calculated empirically and offered, for the first time, a radial method of estimating efficiency borders from the observation of real situations of production. Theoretical and empirical efficiency measures are generally based on ratios comparing the levels observed at the maximum level of output that could be achieved given the input levels used. This maximum is the efficiency frontier which will be the reference point for measuring the efficiency of the observed production units. Generally, two main techniques are available to estimate this boundary: non-parametric techniques and parametric techniques.
Non-parametric methods
Among the non-parametric approaches, it was the method of Free Disposal Hull (FDH) and Data Envelopment Analysis (DEA) that was used. But it is the DEA method that is most commonly used to measure efficiency in the sectors of the economy (Hollingsworth, 2003). It was originally developed by Charnes et al. (1978), who were inspired by the work of Farrell (1957). The main feature of this approach is that the location and shape of the efficiency frontier are determined by the data, not by theory. One advantage of this method is that it imposes no specification of production technology (no underlying functional form) or efficiencies distribution law. This assumes that this technique is more suitable when the study focuses on an area not having a form of production clearly specified.
The technique of DEA approach is based on measuring the efficiency of a decision unit (UD) by calculating the relative difference between the point representing the values of inputs and outputs observed compared to a hypothetical stock of the production frontier. Thus, one can estimate the degree of efficiency of each decision unit (UD) from the border that determines the best observed practices (best practice).
Usually, the hypothesis of constant scale outputs often formulated in models (Charnes et al., 1978) is appropriated when all units of decision operate to an optimal scale. However, the presence of an imperfect competition, the governmental regulations or some financial constraints can bring a unit of decision to not to achieve its production to an optimal scale. Many authors suggested to adjust the DEA model to outputs of constant scale in order to be able to take in account of the situations characterized by variable outputs of scale. The use of the specification to variable outputs of scale, permits to calculate the net technical efficiency of the effects of scale efficiency. The measures of efficiency of scale can be gotten for every unit of decision by carrying out at the same time an analysis DEA with constant outputs of scale and variable outputs of scale. The scores of technical efficiency gotten with outputs of constant scale are decomposed in two elements: one coming from the inefficiency of scale and the other coming from a "pure" technical inefficiency. If the scores with constant outputs of scale are different from those with variable outputs of scale for a unit of particular decision, then that means that the latter is characterized by a inefficiency of scale (Coelli et al., 2005).
Parametric methods
One can generally identify three approaches among parametric methods: Free distribution approach (FDA), the thick frontier approach (TFA) and the stochastic frontier analysis (SFA). However, only two categories of econometric techniques are often used for the analysis of efficiency: the smallest corrected ordinary squares (COLS) and the SFA. Both methods follow the traditional approach of specifying an econometric model of the form:

Where Y is output; i is the number of observations (i = 1,
..., I);  is a constant; X is a vector of explanatory variables; β is the vector of coefficients expressing the relationship between the dependent variable and the explanatory variables, and ε is the residue which is the deviation between the observed data and the predicted relationship by the explanatory variables of the model. In most econometric or statistical models of this type, the relationships between Y and X are the main object of the investigations, while no special attention is given to the residue. In the analyzes of efficiency on the contrary, the residue is always the parameter of interest (it is indeed from the residue that efficiency estimates are derived).
The difference between the COLS and SFA methods based on the interpretation of the residue; COLS in the method, while the residue is regarded as coming from inefficiency while SFA in the method contain a portion of inefficiency and a measurement error part. The latter approach seems more interesting because the measuring efficiency is generally prone to measurement errors.
The method of SFA was originally proposed by Aigner et al. (1977) and Meeusen and van den Broeck (1977). The original specification involved a production function using cross-sectional data with an error term in two components, one taking into account the random errors and the other one technical inefficiency. The model can be expressed as follows:

Where Yi is the output of the ith decision unit; Xi is a vector ( k x 1) the amounts of inputs used by the ith decision unit ; β is a vector of unknown parameters; Vi represents the random variables assumed iid ,  ) and independent Ui where Ui is the vector of non-negative random variables assumed to represent the technical inefficiency in production and always assumed iid N,
  ). Technical efficiency is defined as:
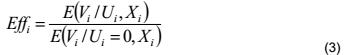
The denominator represents the production frontier as the technical inefficiency term is set to 0. To estimate this model, it is necessary to ask two additional assumptions:
1. The delivery of technical inefficiency U, specific to the UD
2. Separating U as (V-U) is observed.
Typically, given the constraint of non-negativity, U is assumed to be distributed according to one or other of the semi-normal laws, truncated normal, exponential, or gamma. The choice between these distribution laws is often arbitrary. Once the distribution of U is specified, the model parameters can be estimated using the maximum likelihood method.
The econometric analysis for the estimation of the level of productive efficiency: Estimation of a SFA and a DEA model
The aim in addressing this part is to empirically verify if the effect of external indebtedness is a source of productive inefficiency. To achieve this goal, it is necessary to present the methodology, followed by the results of statistical tests and their interpretations.
Model
The model chosen over others takes into account the fact that it is more suitable in this case for a functional form can be provided in accordance with economic theory. According to a work by Drine and Nabi (2007), a production functions with three variables namely the physical capital, the human capital and the labor; the border is estimated from the following model:

Where Yt represents GDP, Kt the physical capital stock, Ht the stock of human capital and Lt the workforce at time t.
From equation (4), productive efficiency is given by:

Note that  belonging to the interval (0, 1) means that a country is more efficient in the use of these inputs; the higher the actual production approaches its potential output equal to

The stock of human capital per head Ht is obtained by the level of secondary schooling. To build the stock of physical capital, the study use the perpetual inventory method used by Amadou (2009). According to these studies, the stock of physical capital (Kt) at time t is measured by the following formula:

The study designates the amount of additional investment. δ is the depreciation rate, which is assumed to be 0.03. The initial capital stock K0 of the country is given by the following formula:

Where I/Y is the average share of investment in physical output over the period considered, γ is the average growth rate of output per head during this period, n is the average growth rate population. The study rewrote equation (4) as a function of logarithmic variables:

Estimation technique
The estimate by the SFA approach is made in two stages. First, the production function is estimated, and then the extracted residues. These residues are regressed in terms of variables that explain the inefficiency/ efficiency. Like ALS, let vi follows that N (0, σ v2) and ui (technical inefficiency) follows a half-normal distribution. Once the coefficients of the border are estimated by the maximum likelihood method, the specific technical inefficiency ui to each observation can be estimated either by the user or the ui medium. As part of this, the study will retain the average estimate (Appendix 2).
Data
The country as most African countries are faced with the statistical problem of availability, obtaining data at the national level is difficult which leads us to see the statistics of the World Bank and other international sources. The data used for the estimates are annual. They came from the World Bank database (World Development Indicators 2015) and the Economics Direction (DE, 2012). The period runs from 1980 to 2012.
RESULTS
Descriptive statistics
Figure 1 shows that the public external debt has increasingly evolved from 1984 to 2007 before beginning to fall significantly from the 2010 with the attainment of the completion point of the initiative HIPC. However, the external debt level of the country has remained almost constant over the period 1991 to 2001 (Appendix 1). This can be explained by periods of crisis known by the country with the interruption of cooperation with most financial partners for democratic deficit. Meanwhile, the share of external public debt in GDP (Figure 2) has declined over the period 1985 to 1990. This decrease can be explained by the implementation of the structural adjustment program. However, it increased significantly between 1993 and 1996 putting a break down seen since the years 1984. This increase is not due to increased external public debt but rather to a significant decrease in economic activity (Appendix 4). Indeed, this period corresponds to a time when the country had just come out of a general strike for almost 10 months marked by a slowdown in economic activity. From 2000, with the gradual resumption of cooperation with its partners, the country has seen a resurgence of activity. This results in a decrease in the ratio of external debt to GDP, decline that worsened with debt relief from 2010.

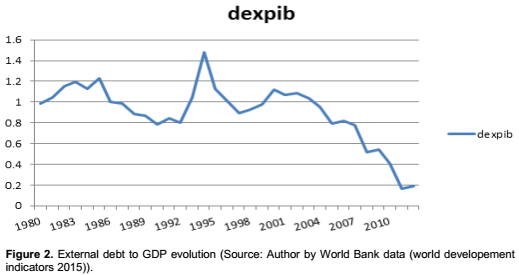
In short, except the period of crisis marked by socio-economic problems and the general strike, the external debt to GDP level is in the downtrend. But, at the same time, the level of external public debt tends to increase, which suggests that the level of public external debt does not have a negative effect on GDP.
Estimation results
The analysis by the Data Envelopment has been used to verify if the external debt has been used in an optimal way in the productivity. The variables used are the external debt and the GDP. The results in mono input and mono output (Appendix 6) only note an efficient allowance of the external debt in 2010 as well in inputs orientation as in output orientation. For the other years of the period considered, the study notes an inefficiency allocation of resources. For example, by considering the input orientation in 1980 and 2012, for the same level of production it’s possible to reduce the respectively contracted level external debt of 5 and 6, 31%. Moreover, the comparison between an estimate with constant output of scale and output of variable scale shows that except for the year 2010, the other years are characterized by inefficiency of scale. An estimate by the method of the SFA has been also made as shown in Table 1.
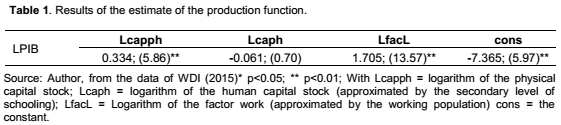
The coefficients relating to physical capital and the labor factor of the production function are positive and significant at 1% level. The results indicate that the labor factor contributes significantly to production with an elasticity of 1.70. Elasticity of output related to physical capital of 0.33 is well lower than the elasticity of labor factor, suggesting that the production is labor intensive.
From residues associated with technical inefficiency were calculated efficiency scores (Appendix 5). The results show that the production is inefficient over the period studied. This means that the resources available during the production cycle are used in an optimal way. However, all scores are very close to one. To estimate the relationship between external debt and the productive inefficiency/productive efficiency, the inefficiency of residue recovered as a result of the estimation of the production frontier are regressed with the following explanatory variables (debt external to GDP , debt to GDP squared, exchange rates and credit to the private sector). Also the model can be written as follows:

With dexpib = external debt / GDP
dexpib2 = (external debt / GDP)2
tchge = exchange rate
cred_sec = credit granted to the private sector
Following the estimates, the results show a significant contribution of variable exchange rates and credit to the private sector to efficiency at 1% threshold. These results imply that an improvement in the exchange rate and credit to the private sector could increase productive efficiency. However, the coefficients associated with these two variables are low. The variable debt to GDP ratio in turn is also significant at the 5% level, and square that is not the 10% threshold.
The results of this assessment show a non-linear effect between the share of public external debt and productive efficiency (Appendix 3). This result confirms those found in a study by Patillo et al. (2002) of 93 developing countries over the 1969 to 1998 period, and Drine and Nabi (2007) on a sample of 28 developing countries between 1970 and 2005. These results also show a positive relationship between the share of external debt to GDP and productive efficiency. This implies that an increase in the external debt share to GDP improves the productive efficiency of Togo economy. And the external debt level is not an obstacle for improving the productivity of Togo economy.
The results of this study has shown that the external public debt improves the productive efficiency of the Togolese economy while having a nonlinear effect contrary to the results of some work on some countries that lead to a negative relationship between debt and productive efficiency. Also, the contribution of this study is to show that the debt may have a positive contribution to production efficiency.
CONCLUSION
The objective of this study was to measure the productive efficiency of the external debt of Togo economy and respond to the following question: has public external debt improved or has it, on the contrary deteriorated Togo productive efficiency? Thus by following the method of Stochastic Frontiers Analysis, the results show a significant contribution of the variable "debt to GDP", variable "exchange rate" and "credit to the private sector" in productive efficiency. These results also showed a non-linear effect of external debt on efficiency. The results of the study show that in the case of Togo, the external public debt improves the productive efficiency of the economy. However, variables such as "credit to the private sector" and the "exchange rate" are also vectors that contribute to improving the production efficiency. The level of external indebtedness was then sub-optimal and thus hampered the growth potential productivity through limiting production efficiency over the period of the study.
The determination of the efficiency scores by the method of the data envelopment in mono input and in mono output shows that the external debt was not used in an optimal way in the production over the period of the study. This result calls therefore to a better allowance of the external debt. However, this productive inefficiency can be also explained by an inefficiency of scale.
Also, to improve the debt effect on the productive efficiency of the country, several tracks can be followed. Public-Private Partnerships (PPPs) are a form of contract by which a public authority uses a private company to finance, design, build and manage or contributing to public service equipment.
This PPP mechanism is an effective way in mobilizing resources for public funding without increasing the debt. As the public-private partnership, secondary education, multinational corporations, government legislative initiatives and the quality of business-to-business (B2B) and consumer services to businesses (B2C) can improve the debt effect on the productive efficiency of the country.
CONFLICT OF INTERESTS
The authors have not declared any conflict of interests.
REFERENCES
|
Aigner DJ, Lovell CAK, Schmidt P (1977). Formulation and Estimation of Stochastic Frontier Production Function Models, J. Econ. 6:21-37. |
|
|
Akinlo AE (2006). Macroeconomic Factors and Total Factor Productivity in Sub-Saharan African Countries, Int. Res. J. Financ. Econ. 1:62-79. |
|
|
Amadou (2009). Analyse de l'effet de l'instabilité des exportations sur la croissance économique au Togo » Revue africaine de l'intégration 3:2. |
|
|
Avramovic D (1964). Economic Growth and External Debt, Baltimore, The John Hopking press. |
|
|
Charnes A, Cooper WW, Rhodes EL (1978). Measuring the efficiency of decision making units, European J. Oper. Res. 2:429-444. |
|
|
Coelli T, Rao D, Battese G (2005). An introduction to efficiency and productivity analysis, Boston: Kluwer Academic Publishers. |
|
|
Debreu G (1951). The coefficient of ressource utilisation, Econometrica 19:273-292. |
|
|
Drine I, Nabi MS (2007). Endettement extérieur public et efficience productive dans les pays en développement, acte de la conférence 2007/antiopa/Economica/363282G/ |
|
|
Farell MJ (1957). The measurement of productive efficiency". J. Royal Stat. Soc. Series A 120:253-290. |
|
|
Grosskopf S (1993). Efficiency and productivity, dans Fried, L. C., H. O Schmidt & S. S. Schmidt (eds), The Measurement of Productive Efficiency. Techniques and Applications, New York: Oxford University Press. |
|
|
Hollingsworth B (2003). Non-parametric and parametric applications measuring efficiency in health care, Health Care Management Science 6(4):203-218. |
|
|
Koopmans TC (1951). An analysis of production as an efficient combination of activities, dans Koopmans, T.C., éditeur, Activity Analysis of Production and Allocation, Cowles Commission for Research in Economics, Monograph 13, Wiley and Sons. |
|
|
Meeusen W, van den Broeck J (1977). Efficiency Estimation from Cobb-Douglas Production Functions with Composed Error. Int. Eco. Rev. 18(2):435-444. |
|
|
Pattillo C, Poirson H, Ricci L (2004). What Are the Channels Through Which External Debt Affects Growth?, IMF Working Paper, n°. 04/15. IMF, Washington, DC. |
|
|
Pattillo C, Poirson H, Ricci L (2002). External Debt and Growth », IMF Working Paper, n°. 02/69 (Washington: International Monetary Fund). |
|
|
Raffinot M (1998). Soutenabilité de la dette extérieure: De la théorie aux modèles d'évaluation pour les pays à faible revenu; Document de travail, Université paris IX. |
|
|
Reinhart C, Rogoff K (2010). Growth in a Time of Debt, Working Paper presented at American Economic Association Meeting |
|
Copyright © 2024 Author(s) retain the copyright of this article.
This article is published under the terms of the Creative Commons Attribution License 4.0


