Full Length Research Paper

ABSTRACT
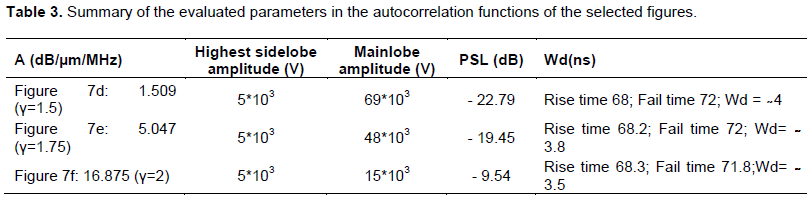
Optical microscopic analysis of honey is time consuming due to the period needed to prepare samples. Time reduction could be achieved with ultrasound microscopy. This paper investigates the behavior of 125 MHz signal modulated by 16-bits Golay code spread out through a honey sample containing pollen. A bipolar phase shift keying (BPSK) modulation of 125 MHz frequency by 16-bits Golay code was implemented in Simulink/Matlab environment. The frequency implemented was set up considering the acoustic properties of honey containing pollen, the thickness of the sample and the size of pollen. At this frequency, the evaluated attenuation coefficient of honey containing pollen was 0.135 dB/µm/MHZ(γ =1); it depends on the power factor γ related to the scattering medium, and the delay induces by the size of pollen. The impact of these parameters, added to 5dB White Gaussian Noise on 200 V magnitudes BPSK Golay sequences, decreased the autocorrelation function magnitude from 8×10⁴ V to 1.5×10⁴ V. The width (Wd) decreases from 4 ns at 0.135 dB/µm/MHz(γ =1) to 3.5 ns at 16.875 dB/µm/MHz(γ =2), when the Pulse Side lobe Level (PSL) increases from -22.79 dB at 1.509 dB/µm/MHz(γ =1) to -9.54 dB at 16.875 dB/µm/MHz(γ =2).
Key words: Ultrasound, honey, attenuation coefficient, Golay code, BPSK modulation, autocorrelation function.
INTRODUCTION
Rheological analysis of honey is often realized using ultrasound at low frequency. It focuses on the determination of the speed of ultrasound, the viscoelastic moduli and contributes to the control quality of the given sample (Awad et al., 2012; Mehryar et al., 2013; Chandrapala, 2015). During their propagation in a medium, the ultrasound undergoes phenomena such as absorption, diffusion and dispersion. These phenomena are amplified with the increase of the frequency and the nature of the medium. Studies have shown that to size up the operational ultrasound frequency, a compromise must be made between resolution and penetration, which are two important parameters to be considered to ensure the quality of the characterization. Indeed, the resolution increases as the frequency goes up high; in the same time, the penetration decreases as the frequency increases (Berson et al., 1994; Clair et al., 2000). Characterization of an environment or a structure can be qualitative (imaging of the structure) or quantitative (evaluation of the speed of ultrasound in the milieu, also the evaluation of the attenuation coefficient, and the evaluation of the thickness of the considered structure). The Quantitative analysis can be performed without introducing any chemical or biological damage in the sample and can give the way to appreciate the interfaces in the structure under analysis (Berger and Laugier, 1992; Chandrapala, 2015).
One of the acoustic parameter that is not well-known, but is considered important when carrying quantitative characterization of honey is the attenuation coefficient. Indeed, Laux et al. (2011) measured the amplitude of the first echo in chestnut honey at 15.7% of moisture using 200 V magnitude ultrasonic signal at 13.5 MHz but they could not be able to measure the amplitude of the second echo in the same sample. The absorption loss coefficient, which is nothing other than the attenuation coefficient was not determined (Laux et al., 2011). By developing a non-destructive and non-invasive method, using ultrasonic spectrometry, Kulmyrzaev and McClements (2000) measured the phase and amplitude of the reflected signal at the honey surface at various concentrations, as well as the viscous dynamic and the Elastic dynamic moduli. The operational frequency varied between 5 MHz and 10 MHz. Results on rheological analysis of honey were produced but did not come to the determination of the attenuation coefficient (Kulmyrzaev and McClements, 2000). Cereser and Laux (2010a) has developed a method based on the measurement of the complex reflection coefficient at the interface between an elastic material and a viscoelastic material. This method has allowed the determination at 10 MHz of the elastic dynamic modulus and the viscous dynamic modulus of honey, without a determination of the attenuation coefficient of that honey (Cereser and Laux, 2010a). Nevertheless, the mathematical expression of these two module allows the expression of this attenuation, which is known to be proportional to the reverse of the deep penetration of the ultrasound in the medium as indicated in literature (Cereser and Laux, 2010b). The measurement of the loss absorption coefficient requires the identification of at least two interfaces in a given sample and their acoustic parameters known (McClements and Fairley, 1992). If honey is considered as a medium with more than one interface, it is possible to model the amplitude of the signal crossing the identified interfaces, and to calculate the attenuation coefficient of each of them. This method was implemented by McClements and Fairley (1991); McClements and Sundaram (1997) with an ultrasonic reflectometer to determine the viscosity, the attenuation coefficient as well, as the acoustic impedance of some food and liquids at the frequency of 2.1 MHz but did not carry out the study on honey (McClements and Fairley, 1991; McClements and Sundaram, 1997). To mark this lack of information on the value of the attenuation coefficient of honey, Szabo (2014) has presented a table of the acoustic parameters of parts of the human body and some liquids including honey without indicating the value of its attenuation coefficient (Szabo, 2014). This work considers a sample of honey containing pollen and evaluates the acoustics parameters of honey and pollen. Those parameters lead to the dimension of 350 MHz frequency for the qualitative characterization of honey. One problem faced was the transmission of this frequency considering the power law of the attenuation. Indeed, high frequency induced better resolution of the imaging, but at the same time, attenuation increases and the penetration of the characteristic signal in the sample is poor. To overcome this difficulty, the frequency was reduced to 125 MHz and has considered the coded signal for the quantitative characterization of honey containing pollen. In literature, Golay code presents good characteristics in the transmission of signal, such as the improvement of signal-to-noise ratio, the reduction of side lobes in the autocorrelation function and also the elongation of Golay code can improved the penetration of encoded signal in the sample (Nowicki et al., 2007; Alvaro et al., 2007; Trots et al., 2008). The encoded signals using complementary Golay code are more developed for RADAR and biomedical imaging process (Nowicki et al., 2003; Vijay, 2011). In those files, the transmission of encoded signal is usually made simultaneously in the medium for it characterization using a transducer having more than one piezoelectric element. In this case, any sequence of encoded signal will arrive at the same time on the medium (Shin et al., 2008). For this study the transducer has one piezoelectric element and the expectation is to obtain comparative results.
MATERIALS AND METHODS
This study is based on honey containing pollen since the natural presence of pollen in honey can give information on its geographical origins. Also, the dimension of the pollen cannot be negligible if the thickness of the sample to be analyzed is considered. So, modeling the attenuation coefficient of honey containing the pollen is the first stage to be carried out. After this, the algorithm of Golay code just as evaluation parameters will be presented, and the mathematical equations of BPSK modulation of a high frequency by the 16 bits Golay code and its propagation in an impulse response medium, will be established. These equations will be implemented in the Simulink/matlab environment and the results of the simulations of the disturbances of the attenuation coefficient of honey containing pollen that were found on the propagation of Golay code sequences, will be analyzed.
Modeling of the attenuation coefficient of honey containing pollen
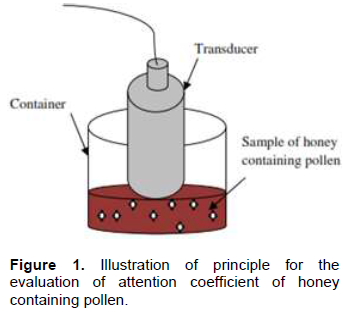
Considering D(μm) as the thickness of honey sample containing pollen and knowing that the largest pollen size has a diameter of 250 μm (Dahdouh, 2011; Ferrus, 2012), it is agreed that the honey/pollen interface has a minimum thickness of (D-250) μm, if pollen is found at the bottom of the container. Assuming that there is one pollen in the ultrasonic propagation field, in the focal area of the transducer, the magnitudes would be modeled across these different interfaces during the propagation of emitted signal. The principle is depicted in Figure 1. From this illustration one can identify the following interfaces:
(i) The honey/pollen (upper side) interface, designated by MPs;
(ii) The pollen (lower side)/honey interface, designated by PiM;
(iii) The honey/container interface, designated by MB.
These three interfaces allow the writing of the ultrasound attenuation relationships in the medium as follows:
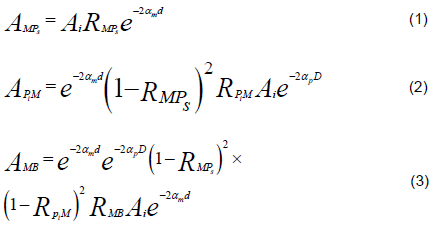
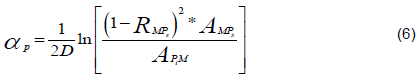
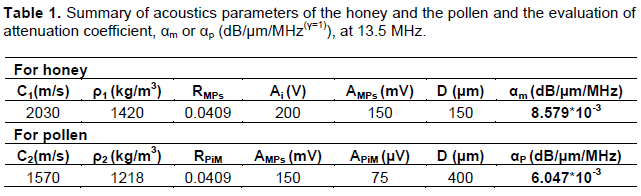
Where Ai is the initial amplitude emitted by the transducer, AMPs is the amplitude at honey/pollen (upper side) interface, APiM is the amplitude at the pollen (lower side)/honey interface, RMPs is the reflection coefficient at the honey/pollen (upper side) interface; RPiM is the reflection coefficient at the pollen (lower side)/honey interface; αm is the attenuation coefficient of honey; αp is the attenuation coefficient of pollen; d (D-250) µm is the thickness of honey interface; D is the thickness of the honey sample containing pollen. The attenuation coefficient of honey αm is obtained from Equations 1 and 2:
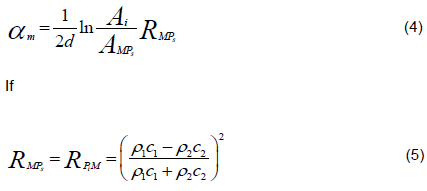
Where, C1, ρ1 and C2, ρ2 are respectively the speed of ultrasound and density for honey and pollen. For honey, C1 equals to 2030 m/s and, ρ1 equals to 1420 kg/m3 (Szabo, 2014). The density ρ2 of the pollen of “Amaranthus Palmeri” is equal to1218 kg/m3 (Sosnoskie et al., 2009) and the evaluated velocity C2 of ultrasound in the pollen is equal to 1570 m/s (Aouzale et al., 2010; Duclos et al., 2009; Duclos et al., 2010). The attenuation coefficient of pollen is obtained from equations 2 and 3, and leads to the following relation:
Considering that the density of pollen is identical for all the pollen sizes, the reflection coefficient will be determined and will proceed to the determination of the attenuation coefficient of the honey and the pollen. This hypothesis is justified if there is only one type of pollen in the considering sample of honey. Laux et al. (2011) has realized an experiment that permitted to measure the amplitude of the first echo in a given sample of monofloral chestnut honey, (Laux et al., 2011). They emitted an ultrasound of 13.5 MHz with 200 V Amplitude in the sample haven 400 µm thickness, at different temperatures and they measured the amplitude of echo. The value of 150 mV was measured at 23.5°C (Laux et al., 2011). Attenuation coefficient is given in Np/µm and Knowing that α(dB)=8,6886α(Np), at the operational frequency, the result is in dB/µm/MHZγ (Szabo, 2014). The relationship between attenuation coefficient and frequency is given by the following equation:

Algorithm of generating Golay code
Golay code is a pair of binary code, belonging to the large family of complementary codes. It consists of two sequences with the same length L, whose autocorrelations have identical side lobes in absolute value but opposite signs. The autocorrelation function obtained by summing up the two previous sequences has a main lobe with amplitude equal to 2L, and the secondary lobes with amplitude equal to zero (Edgar et al., 2008). Sequences a(n) and b(n) are Golay codes of length L if and only if the following autocorrelation function is checked (Shin et al., 2008; Edgar et al., 2008).
a(n)â•a(-n)+ b(n)â•b(-n)=2Lδ(n) (8)
(â•) is the convolution operator and δ (n) is the Kroneker of the Delta function.
If aL(n) and bL(n) are Golay codes, a2L(n) and b2L(n) are also Golay codes obtained by concatenation.
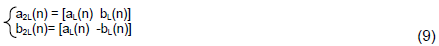
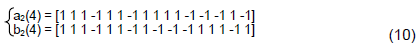
Therefore, sequences of Golay codes can be built recursively knowing the initial values. For example a2(n) = [1 1] and b2(n) = [1 -1]. For a length L = 16 = 24 these sets are as follow (Nowicki et al., 2007).
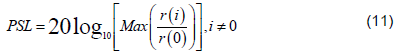
According to Trots et al. (2008), the comparison of results obtained for different lengths of Golay coded (8 bits; 16 bits; 32 bits and 64 bits), 16 bits Golay codes seems to be a good compromise because using longer coded sequences leads to increase the blain area in front of the transducer and consequently, the dead zone in the final signal. In the other hand, a short sequence does not assure sufficient Signal to noise ratio (SNR) (Trots et al., 2008). In RADAR and clinical applications, the general definitions of the following quality factors are used to evaluate Golay code application: Peak Side lobe Level (PSL), Integrated Side lobe Level (ISL) and the pulse width (Wd) of the autocorrelation function. These quality factors are often used in order to analyze the volume of the signal side lobes at the filter output (Misaridis et al., 2000; Vijay, 2011; Alejos et al., 2008). The PSL and the Wd parameters only will be evaluated in this work.
(i) Peak Side lobe Level (PSL) is the ratio of the maximum of the side lobe amplitude to main lobe amplitude;
(ii) The width of the autocorrelation function (Wd) is the band pass of the main lobe.
Mathematical expression of the characterization of a medium using Golay encoded signal and the application of an adapted filter
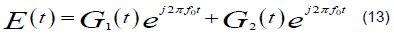
G1 (g1(n), n = 1,2, ..., N)) and G2 (g2(n), n = 1,2, ..., N)) being complementary sequences of Golay, G'1 (g1(-n), n = 1,2, ..., N)) and G'2 (g2(-n), n = 1,2, ..., N)) are the corresponding replicas, and they all represented the temporal expressions of Golay code. The modulations of these sequences with a high frequency are given as follows:
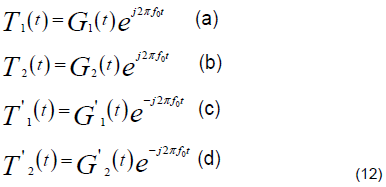
The equation that constitutes the excitation signal of a transducer is given as follows:
It comes down to the exploitation of Equation 12a and b. If the medium of thickness d is characterized by a pulse response M (t, d), that means reflectors in this medium are aligned in the propagation axis of the ultrasonic beam then, the impulse response of a reflector situated at a distance di is a Delta function as shown by the following Equation 14.
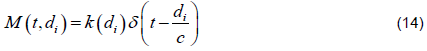
Here K is a function of the depth considering the acoustic diffraction and the attenuation of the medium, and C is the ultrasound speed. Considering that impulse responses are short, the reflection function of the medium will be the sum of impulse responses for all depths. The echo signal Rx (t) will then be the sum of the convolution of the reflection function with the excitation signal.

Equation 15 is nothing other than the time shift of the transmitted signal.

τ0 = di/C is a one way time of fly, corresponding to the beginning of the reception of the echo (Misaridis and Jongen, 2005; Jin et al., 2010). Since the simulation is at fixed frequency, there is no frequency dependency, and that is why after this step, the adapted filtering will be performed directly.
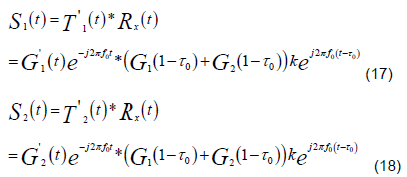
Adapted filtering is a process that allows the optimal detection of a signal present in an observation. Practically it is to get the signal out of the noise. To do so, it is necessary to know a minimum of information on the properties of the disturbing noise (Daffala et al., 2018) To perform the adapted filtering, the echo of the relation (16) was convolved with the expressions (12c) and (12d) and obtain the following relations S1(t) and S2(t):
Equation 19 is the sum of Equations 17 and 18 and it is the autocorrelation function, after realizing the adapted filter of the echoes.
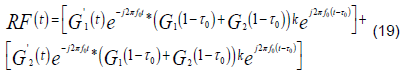
According to the literature (Jin et al., 2010), G'1(t) * G2 (t-τ0) + G'2 (t) * G1 (t-τ0) = 0.
Equation 19 then becomes:

Equation (20) is the simplified autocorrelation function and it representation will concerned only the real part as presented in Equation 21:

RESULTS AND DISCUSSION
Bloc diagram of the characterization
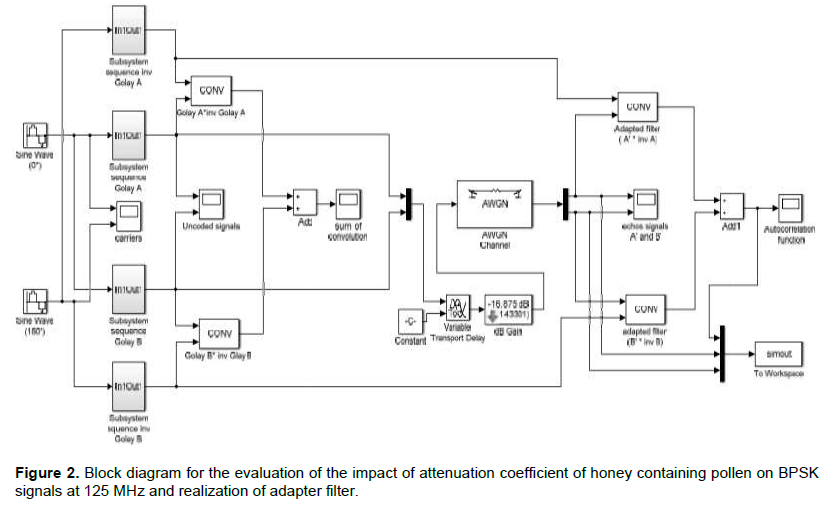
To generate the two sequences of the 16 bits of the Golay code named Golay A and Golay B, two S-function was used and a program in the corresponding subsystem (subsystem sequence Golay A in addition to subsystem sequence Golay B respectively) put any bit at the same frequency as the nominal frequency and proceed to the BPSK modulation. It has been selected in these experiments, one cycle of the nominal frequency per bit of the Golay code. The pulse width of any bit is equal to one period of the high frequency, and that is the reason the phase changing at different bits in the graphs bellow can be observed. The simulation duration in Simulink/Matlab environment is 16 times the duration of 125 MHz frequency. Using the mathematical expression of Equations 19 and 20, the match filtering were performed after acquiring the reflected signals. To do so, the temporal returns of any previous signal were realized as follows. The phase of the high frequency was shifted from zero to 180° and flip different sequences of Golay code. As previously, the BPSK modulation of these new sequences is performing in subsystem sequence Inv Golay A, and subsystem sequence Inv Golay B. After the interaction with the medium model by attenuation coefficient of Honey containing pollen, the delay due to pollen size and a White Gaussian Noise with SNR equal to 5dB, the match filter is realized by the convolution of each reflected signal and the corresponding temporal return. The addition of the two match filtered signals gives the autocorrelation function.
Evaluation of attenuation coefficient of honey and pollen
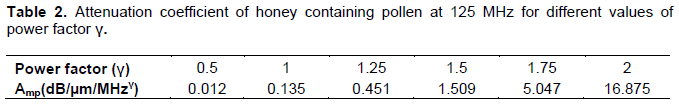
The application of the experiment realized by Laux et al. (2011) in Equations 4, 5 and 6 gives the attenuation coefficient of honey and pollen in the considering thickness of honey as reported in the following Table 1. At 13.5 MHz, the attenuation coefficient of honey containing pollen (αmp) is the sum of two attenuations coefficients and it is equal to 1.463*10-2 dB/µm/MHz(γ=1). The attenuation coefficient of honey containing pollen at 125 Mhz is calculated in agreement with the Equation 7. The result of the calculation of this parameter equal to 0.135 dB/µm/MHz(γ=1), considering that α1 is equal to 1.083*10-3 dB/µm/MHz2. This 125 MHz frequency is the one sized up at the beginning of this study when taking the option of encode signal for the characterization of honey containing pollen. As reported in Table 2, the attenuation coefficient of honey containing pollen for different values of power factor.
Signals obtain at different stages of the simulation
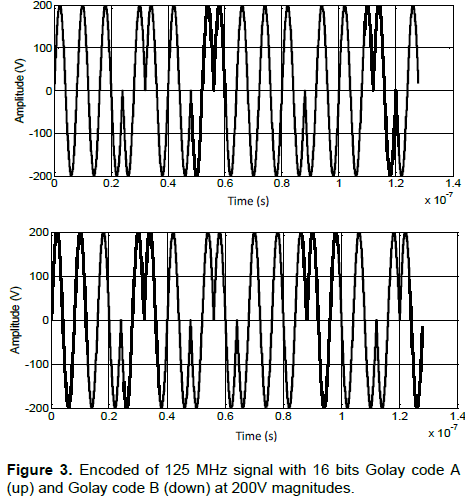
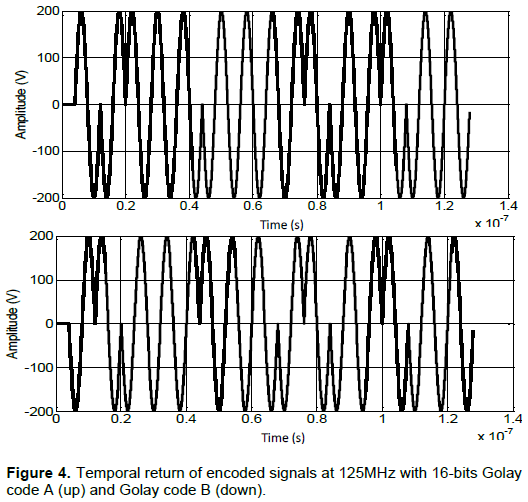
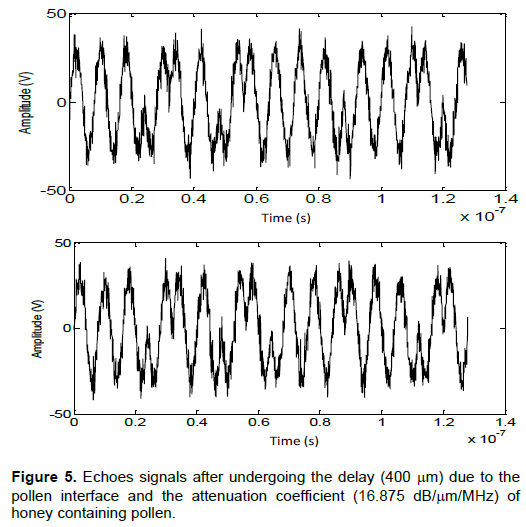
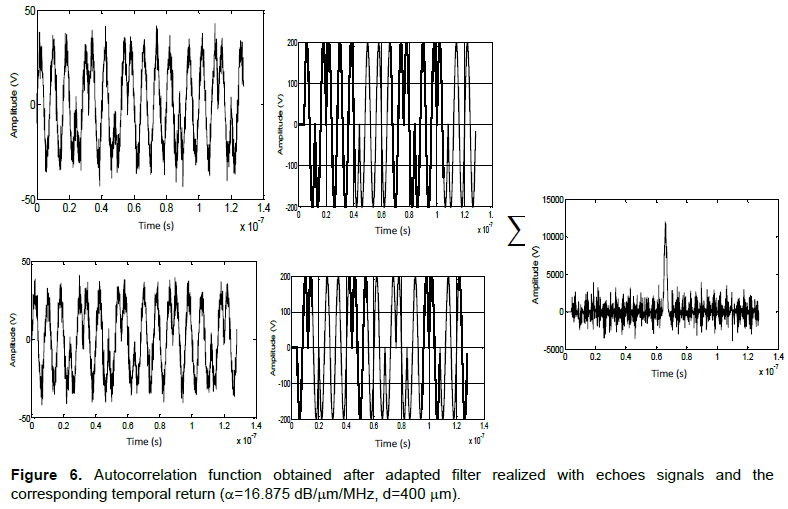
According to the simulation bloc diagram of Figure 2, the first interesting graphs are the BPSK modulation of 125 MHz with 16 bits Golay code and the temporal return of each of them. After the interaction of the signals in Figure 3 with the medium, the following Figure 5 is obtained. Figure 5 is the echoes signals obtained after applying the attenuation coefficient, the 400 µm delay, and a White Gaussian Noise with SNR equals to 5 dB. The autocorrelation function is obtained by convolution of each echo with the corresponding temporal return in Figure 4. Results are as follow in Figure 6.
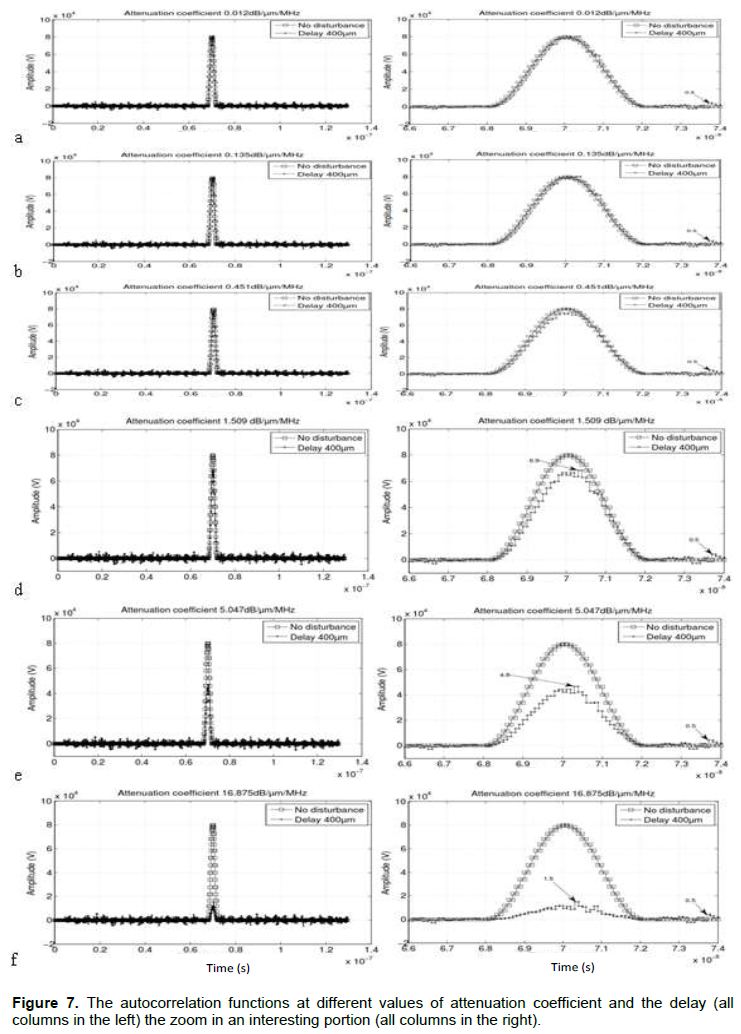
The work proceed, in the same way, for different values of attenuation coefficient and considering the sample size (delay) as it is shown on the obtained results in Figure 7. As indicated in Table 2, the greater the power-factor, the greater the attenuation coefficient. In Figures 7d, e and f, the impact is more significant. To evaluate PSL and Wd, we get very close to the interesting portion as presented in Figure 7 (all the right figures). All the parameters are summarized in Table 3.
DISCUSSION
In Figure 3 the changing of phase depends on the bits applied. There is exactly 16 phases corresponding to 16 bits of the choosing Golay code. These signals are the same obtained by Nowicki et al. (2007) and Trots et al. (2011). Figure 4 is the reverse of Figure 3 and it is in accordance with the previous authors. However, one can observe a delay of about 4 µm due to the temporal return of Golay sequences. This undesirable delay will appear in autocorrelation function and can contribute to increase the dead zone that naturally exist in front of the transducer during it operation. According to Trots et al. (2008), the dead zone is due to the elongation of Golay code (Trots et al., 2008). It appears in this study that this elongation is not the only reason.
The width of the autocorrelation function decreases with the attenuation coefficient. This value specifies the range resolution of the signal. The PSL increases with the rising of attenuation coefficient. In literature, the side lobe-main lobe ratio of 16 bits Golay code is -21.0721 dB (Kabakchiev et al., 2010) and -24.08 dB (Sethi, 2013). The values obtained show losses of bits in the application. These losses increase with the attenuation coefficient of honey containing pollen and the application of AWGN.
In Figure 7, the power factor has a considerable impact on the determination of attenuation coefficient so is the transmission of characteristic signal. This power factor reveals the dispersion of the given honey. If the dispersion is high, attenuation coefficient of honey is high also. Cereser and Laux (2010b) found at 5 MHz that the attenuation coefficient of honey is around 30 µm (Cereser and Laux, 2010b). This result does not give any idea about the dimension of the attenuation coefficient of honey as was done in this work. Moreover, the operational frequency is 25 times theirs.
CONCLUSION AND RECOMMENDATIONS
This work valuated the attenuation coefficient of honey containing pollen and the work proceeded to the characterization of BPSK modulation of 16 bits Golay code at 125 MHz in Simulink/Matlab environment. The results have shown that the impact of attenuation coefficient of honey containing pollen on characteristics signals depended on the power factor that reveal the dispersion of the structure. The magnitude of the autocorrelation function is noticeable and can help to predict the behavior of BPSK signal in honey structure. The interest of this work is a contribution to recognise natural honey, doing so by the interpretation of a quantitative analysis of a sample. The lack of the consideration of the natural presence of the pollen inside of the honey, make us miss to study rightfully honey as a complex that possesses various interfaces. In future works, it would be interesting to study the effect of the composition of honey and moisture content on the attenuation coefficient. The implementation of this method of characterization will be carried out to construct a prototype and therefore to contribute to the rightful labeling of honey, taking into consideration the presence of pollen in it.
CONFLICT OF INTERESTS
The authors have not declared any conflict of interests.
ACKNOWLEDGMENTS
The authors thank the anonymous reviewers for their valuable comments and suggestions to improve the quality of this paper. They are greatly indebted to the Cameroon Government for funding the research through the Ministry of higher education program “Modernisation de la Recherche dans l’Enseignement Supérieur”.
REFERENCES
|
Alvaro H, Urena J, Mazo M, Garcia JJ, Jemenez A, Alvarez FJ (2007). Reduction of blind zone in ultrasonic transmitter/receiver transducer. Sensors and Actuators A 133:96-103. |
|
|
Alejos AV, Dawood M, Habeeb Ur RM, Sanchez MG, Jedlicka RP, Cuinas I (2008). Low Sidelobe Level Radar Techniques Using Golay Based coded Sequences. IEEE 978-1:4244-2042. |
|
|
Aouzale N, Chitnalah A, Jakjoud H (2010). Utilisation d'une technique ultrasonore pour le contrôle de la qualité des huiles alimentaires, 10ème Congrès Français d'acoustique,<hal-00554461>. |
|
|
Awad TS, Moharram HA, Shaltout OE, Asker D, Youssef MM (2012). Applications of ultrasound in analysis, processing and quality control of food: A review. Food Research International 48:410-427. |
|
|
Berger G, Laugier P (1992). Intérêt et méthodologie de l'échographie quantitative. Journal de Physique IV 2:27-40. |
|
|
Berson M, Feuillard G, Diridollou S, Letiecq M, Pourcelot L (1994). Imagerie ultrasonore haute résolution. Journal de Physique IV. C5:1285-1288. |
|
|
Cereser CV, Laux D (2010a). Moisture content in honey determination with a shear ultrasonic reflectometer. Journal of Food Engineering 96:93-96. |
|
|
Cereser CV, Laux D (2010b). High frequency shear ultrasonic properties of water/sorbitol solutions. Ultrasonics 50:6-8. |
|
|
Chandrapala J (2015). Low intensity ultrasound application on food systems. International Food Research Journal 22(3):888-895. |
|
|
Clair B, Despaux G, Chanson B, Thibaut B (2000). Utilisation de la microscopie acoustique pour l'étude des propriétés locales du bois: Etude préliminaire de paramètres expérimentaux. Annals of Forest Science 57:335-343. |
|
|
Daffala MM, Babiker Awad A (2018). Adaptive coding, modulation and filtering of Radar signals. IntechOpen, Topic in Radar signal Processing pp. 213-241. |
|
|
Duclos A, Ollivier S, Blanc-Benon PH, Mardsen O, Gilles B, Lafon C, Bera JC (2009). Modélisation de la propagation d'ultrasons non focalisés dans des gels de protéines, 10ème Congrès Français d'acoustique , <hal-00546817>. |
|
|
Duclos A, Ollivier S, Lafon C, Bera JC, Gilles B, Blanc-Benon PH (2010). Propagation ultrasonore dans des gels modélisant les tissus biologiques, 19ème Congrès Français de Mécanique. |
|
|
Dahdouh S (2011). Filtering, Segmentation and follow-up of echographics images: clinical applications. Ph.D. Thesis, university of Paris sud XI. Original paper in French. |
|
|
Edgar JB, Juluis OS (2008). Transfer Function Measurement Toolbox. |
|
|
Ferrus C (2012). Qualité des produits de la ruche. International workshop on the consequences of the ECJ judgment on GM pollen in honey for GM crop releases and cultivation in Germany and the EU, ITSAP, 12p. |
|
|
Jin C, Chen SP, Qin ZD, Wang TF (2010). A new scheme of code ultrasound using Golay codes. Journal of Zhejiang University, Science C (Computers and Electronics) 11(6):476-480. |
|
|
Kabakchiev A, Kyovtorov V, Barislov B, Kabakchiev C, Lazarov A (2010). Numerical Analysis of different Communication Signals Used in Passive Radad Systems. Cybernetics and Information Technologies 10(4):75-90. |
|
|
Kulmyrzaev A, McClements DJ (2000). High frequency dynamic shear rheology of honey. Journal of Food Engineering 45:219-244. |
|
|
Laux D, Cereser Camara V, Rosenkrantz E (2011). α-relaxation in honey study versus moisture content: high frequency ultrasonic investigation, around room temperature. Journal of Food Engineering 103:165-169. |
|
|
McClements DJ, Fairley P (1991). Ultrasonic Pulse Echo Reflectometer. Ultrasonics 29:58-62. |
|
|
McClements DJ, Fairley P., (1992). Frequency Scanning Ultrasonic Pulse Echo Reflectometer. Ultrasonics 30(6):403-405. |
|
|
McClements DJ, Sundaram G (1997). Ultrasonic Characterization of Foods and Drinks: Principlces, Methods, and Application. Critical Reviews of Food Science and Nutrition 37(1):1-46. |
|
|
Mehryar L, Esmaiili M, Hassanzadeh A (2013). Evaluation of some physicochemical and rheological properties of Iranian honeys and the effect of temperature on its viscosity. American-Eurasian Journal of Agriculture and Environmental Science 86(2):981-994. |
|
|
Misaridis XT, Morten HP, Jongen AJ (2000). Clinical use and Evaluation of Coded Excitation in B-mode Images. Ultrasonics Symposium pp. 1689-1693. |
|
|
Misaridis XT, Jongen AJ (2005). Use of Modulated Excitation Signals in Medical Ultrasound. Part I: Basic concepts and Expected benefits. Transactions on Ultrasonics ferroelectrics and Frequency Control 52(2):171-191. |
|
|
Nowicki A, Litniewski J, Secomski W, Lewin PA, Trots I (2003). Estimation of Ultrasonic attenuation in a bone using coded Excitation. Ultrasonics 41:615-621. |
|
|
Nowicki A, Trots I, Lewin PA, Secomski W, Tymkiewicz R (2007). Influence of the ultrasound transducer bandwidth on selection of the complementary Golay bit code length. Ultrasonics 47:64-73. |
|
|
Sethi S (2013). Optimal Selection of Binary codes for Pulse Compression in Surveillance Radar. International Journal of Engineering Research and Applications 3(2):216-223. |
|
|
Shin OS, Kung HT, Tarokh V (2008). Construction of block orthogonal Golay sequences and application to channel estimation of MIMO-OFDM systems. Transactions on Communications 56 (1):27-31. |
|
|
Sosnoskie LM, Webster TM, Dales D, Rains GC, Grey TL, Culpepper AS (2009). Pollen grain size, density and settling velocity for Palmer Amaranth « Amaranthus palmeri ». Weed Science Society of America 57(6):404-409. |
|
|
Szabo TL (2014). Diagnostic Ultrasound Imaging: Inside Out. Academic Press 801 p. |
|
|
Trots I, Nowicki A, Lewandowski M, Secomski W, Litniewski J (2008). Double Pulse Transmission-Signal to Noise Ratio Improvement in Ultrasound Imaging. Archives of Acoustics 33(4):593-601. |
|
|
Trots I, Tasinkevych Y, Nowicki A, Lewandowski M (2011). Golay Coded Sequences in Synthetic Aperture Imaging Systems. Archives of Acoustics 36(4):913-926. |
|
|
Vijay RK (2011). Side lobe Suppression Techniques for Polyphase codes in Radar. Master Thesis, National Institute of Technology, Roukela, India, P. 94. |
|
Copyright © 2024 Author(s) retain the copyright of this article.
This article is published under the terms of the Creative Commons Attribution License 4.0


