Full Length Research Paper

ABSTRACT
This study focuses on the quantitative interpretation of aeromagnetic data to estimate the thickness of sediments over part of Bida Basin so as to identify possible areas of hydrocarbon potential. The study area covers an area of 24,200 km2 located between latitude 8° 30ꞌN and 9° 30ꞌN and longitudes 5° 00ꞌE and 7° 00ꞌE. Aeromagnetic data in grid format containing eight sheets were analysed and interpreted. Polynomial fitting was used in regional/residual separation and this result to the residual field data that corresponds to the target source for further processing. Three depth estimating methods were employed in this study; Euler deconvolution, source parameter imaging and spectral depth analysis. Euler depth determination method reveals a maximum depth of 3.56 km around Mokwa and Batati areas. Shallow sources also exist around Pategi, Paiko, Izom and Lapai areas with an average depth ranging from 107.74 m to about 514.82 m. Source parameter imaging shows a deeper sedimentary thickness of 4.2 km in the same area with Euler deconvolution. Spectral depth analysis also showed a maximum sedimentary thickness of 3.50 km. It was found in the study that the maximum depths obtained might probably be sufficient enough for hydrocarbon maturation and gas accumulation. Further research using seismic reflection might be carried out in the areas where maximum depth was obtained.
Key words: Aeromagnetic data, polynomial fitting, spectral analysis, euler deconvolution source parameter imaging.
INTRODUCTION
Magnetic airborne survey has been a useful tool in mapping geological feature, in exploration of mineral and for other geological purposes. This method investigates the subsurface geology on the basis of the magnetic disturbances measured in the magnetic field of the earth subsequent from the magnetic properties of the causal rocks. The shape dimensions, and amplitude of an induced magnetic signature is a function of the orientation, geometry, size, depth, and magnetic susceptibility of the body as well as the intensity and inclination of the earth's magnetic field in the survey area (Biswas, 2018, 2016; Biswas and Acharya, 2016).
The present work focuses on the analysis of a total-field aeromagnetic data over parts of Bida Basin to estimated depth to magnetic basement rock for hydrocarbon maturation. The outcome of this analysis will provide more information on the geophysical and other linear features of the area and add to the geophysical history of the area. The new high resolution aeromagnetic data obtained in the year 2009 were used for this analysis which reveal more structural features that could not be captured using the old data, and so this study throw more light on this peculiarity and further provide base-line information for further studies and correlation.
This study is relevant to the national need because it will further provide information (geophysical) through the processed total field aeromagnetic data on the structural styles of the area.
Recently, the Nigerian National Petroleum Corporation disclosed the intention of Indonesia a South East Asian country, indicating their interest to buy more crude oil from Nigeria above the current 18% they use to buy. As a result of this demand which is a welcome development to the country economy, it is of necessity to explore other sedimentary basins in Nigeria presume to be rich in hydrocarbon, as this will boast the economy of the nation and pave way for business opportunities in the country.
Euler deconvolution, SPI and spectral depth analysis were employed in this study to determine the sedimentary thickness of the area for hydrocarbon potential.
Location and the geology of the study area
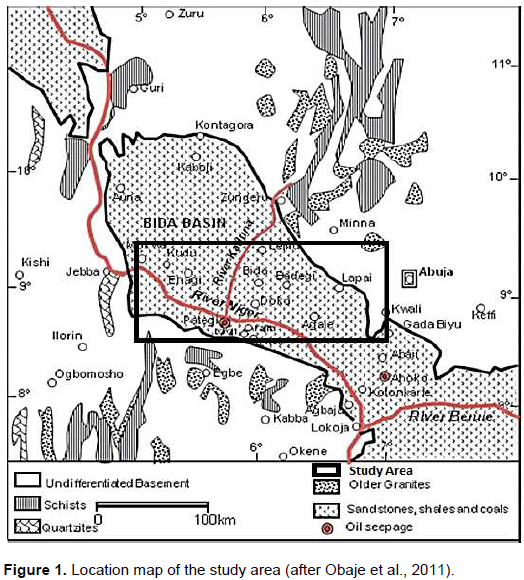
The area of study (Bida Basin) is located between latitude 8° 30ꞌN to 9° 30ꞌN and longitudes 5° 00ꞌE to 7° 00ꞌE covering an area of 24,200 km2 (Figure 1). The Bida Basin is a NW–SE trending intracratonic sedimentary basin extending from Kontagora in Niger State of Nigeria to areas slightly beyond Lokoja in the south (Figure 2). It is delimited in the northeast and southwest by the basement complex while it merges with Anambra and Sokoto basins in sedimentary fill comprising post orogenic molasse facies and a few thin unfolded marine sediments (Obaje, 2009). The entire basin is bounded by latitude 8° 00ꞌN to 10° 30ꞌN and longitudes 4° 30ꞌE to 7° 30ꞌE with an estimated area of about 90,760 km2. The basin is a gentle down-warped shallow trough filled with Campanian-Maastrichtian marine to fluviatle strata believed to be more than 300 m thick (Bemsen et al., 2013) The Basin might be regarded as north-western extension of Anambra basin, which is found in the southeast, both of which were major depocenters during the second major sedimentary cycle of southern Nigeria in the Upper Cretaceous time (Obaje, 2009). Although the hydrocarbon potential of the basin has not been fully tested with seismic data and the basin remains undrilled, both ground and aeromagnetic studies by several workers have outlined the basin's configuration (Udensi et al., 2004). Often, experts working in the area have divided the basin geographically into northern and southern Bida basins probably due to rapid facies changes across the basins. The northern and southern Bida basins comprise of about 3 km thick Campanian to Maastrichtian continental to shallow marine sediments. The southern Bida Basin comprises of the basal Campanian Lokoja formation (mainly conglomerate and sandstone), Maastrichtian Patti formation (shale, claystone and sandstone) and the youngest Agbaja formation (Ironstone). Their lateral stratigraphic equivalents in the northern Bida Basin consist of the basal Bida formation (conglomerate, sandstone), Enagi formation (siltstone, claystone and sandstone) and Batati formation (Ironstone) (Ojo et al., 2011).

MATERIALS AND METHODS
The high resolution aeromagnetic data used for the analysis of this study were part of the data collected from the aero-magnetic survey carried out in the year 2009 Fugro. The collections of the data were sponsored by Nigerian Geological Survey Agency. Below are the technical details of the survey/ flight parameters:
Flight line spacing: 500 m
Terrain clearance: 100 m (Ogun state), 80 m (Phases I and II)
Flight direction: NW - SE
Tie lines spacing: 2 km
Tie lines direction: NE - SW
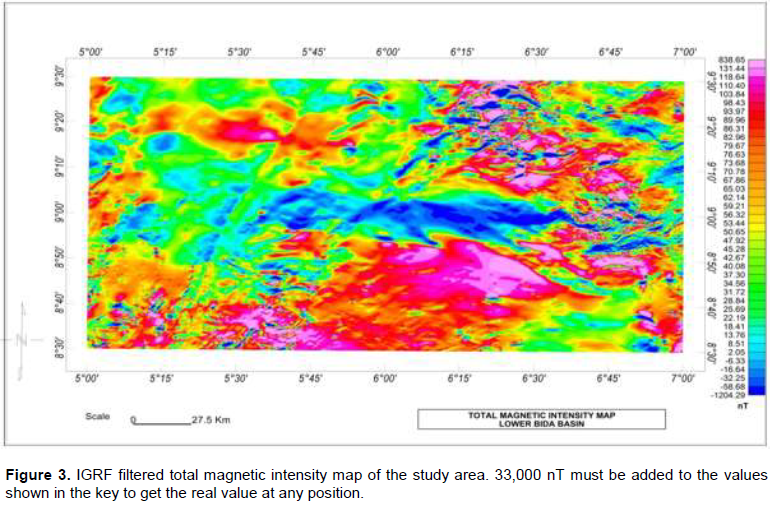
The data were knitted and re-gridded to produce the total magnetic field map (TMI) of the area of investigation (Figure 3).
Theory of method
Euler depth determination method
A formulation of the method given by Reid et al. (1990) shows that:

where (xo,yo and zo) are the positions of the magnetic source whose total magnetic intensity field T is detected at (x,y,z). The total field has a regional value of B. N is a structural index which is equal to three for a point dipole and two for a vertical pipe. More complicated bodies, which are, in effect, assemblages of dipoles, have indices ranging from zero to three. An index of one appears to work for dykes and contacts approximated by lines of poles. Reid et al. (1990) automated the solution of this linear equation for gridded data to produce solutions for the positions and depths of magnetic sources. By using field and computed derivative values at more points than necessary, they obtained an over-determined set of equations and were able to use least square inversion techniques to solve for the unknowns. The solutions are typically displayed as a series of circles, with the centre of the circle indicating the position of the source and the diameter of the circle indicating the source depth. The method has proved useful for identifying source positions and boundaries and for giving generalised indications of source depth part of the problem in obtaining accurate depths using the Euler method may relate to the difficulty of computing accurate derivatives on which to base the depth estimates.
Source parameter imaging: This method is one of the depths estimating method developed by Thurston and Smith (1997). It differentiates and characterise regions of sedimentary thickening from those of uplifted or shallow basement and also to estimate the depths to the magnetic sources. It uses a procedure for automatic calculation of source depths from gridded magnetic data. The results could be used to ascertain areas with hydrocarbon potential and mineral deposits concentration.
SPI assumes a step-type source model. For a step, the following formula holds:

where Kmax is the peak value of the local wavenumber K over the step source.
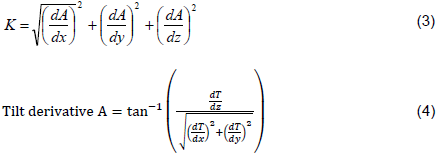
T = the total magnetic field anomaly grid
Spectral depth analysis
The Fourier transform of the potential field as result of prismatic body has a wide spectrum whose upper location is a function of the depth to the up and down surfaces and whose maximum displacement is calculated by its density or magnetization (Salako and Udensi, 2013).
The peak wave number (É·) can be related to the geometry of the body according to the following expression.
where  is the peak wave number in radian / ground – unit,
  the depth to the top
  and is the depth to the bottom.

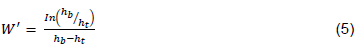
Where, É· = angular wave number in radians/ground-unit; h = depth to the top of the prism. For a prism with up and down surface, the spectrum is:

where and are the depths to top and bottom surface respectively.
The log spectrum of this data can be used to determine the depth to the top of a statistical ensemble of sources using the relationship.

where, h= depth in ground – units, and K = wavenumber in cycles / ground – unit.
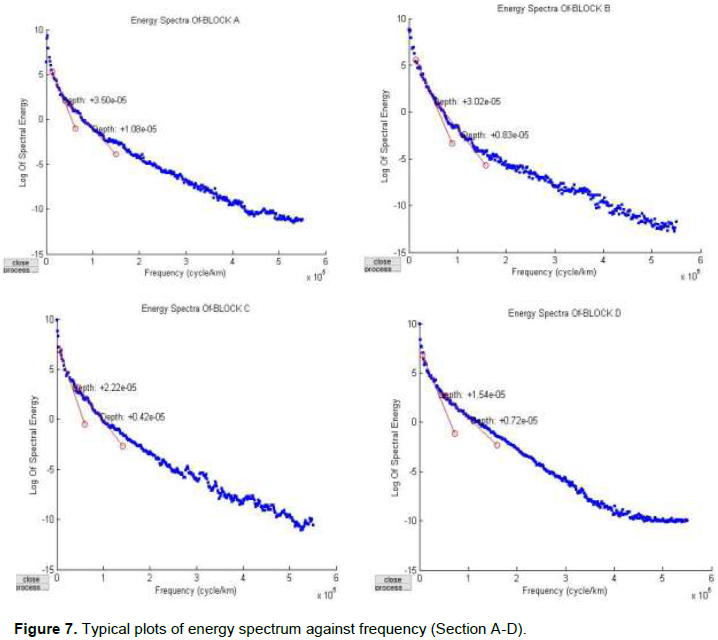
Dividing the slope of the energy (power) spectrum by 2 gives the depth of an‘ensemble’; a deep source depth; a shallow source depth and a noise component. A Matlab program was used to obtain the graph of energy against frequency in cycle/km of the sixteen blocks (A-P).
RESULTS AND DISCUSSION
The TMI map (Figure 3) is produced in different colours, with pink to red colour depicting high anomalies while green to blue depicts low anomalies. The total magnetic intensity map of the study area exhibits both high and low anomalies ranging from 31,796 to 33,839 nT. The lower part of the area is predominantly of high anomaly while the middle portion is dominated by low magnetic anomalies. The North-eastern corner down to the eastern flank is dominated by short wavelength anomalies which are high in frequency of occurrence. Major structures observed on the map trend E-W.
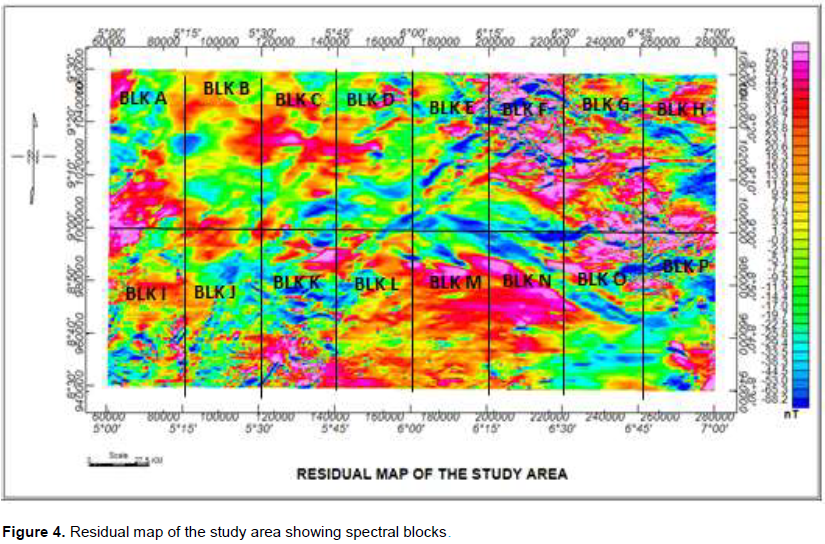
The regional/residual separation was carried out using polynomial fitting with order one which results to the residual field data that corresponds to the target source for further processing. The residual map (Figure 4) shows high and low magnetic field values and which ranges from -1204.29 to 838.65
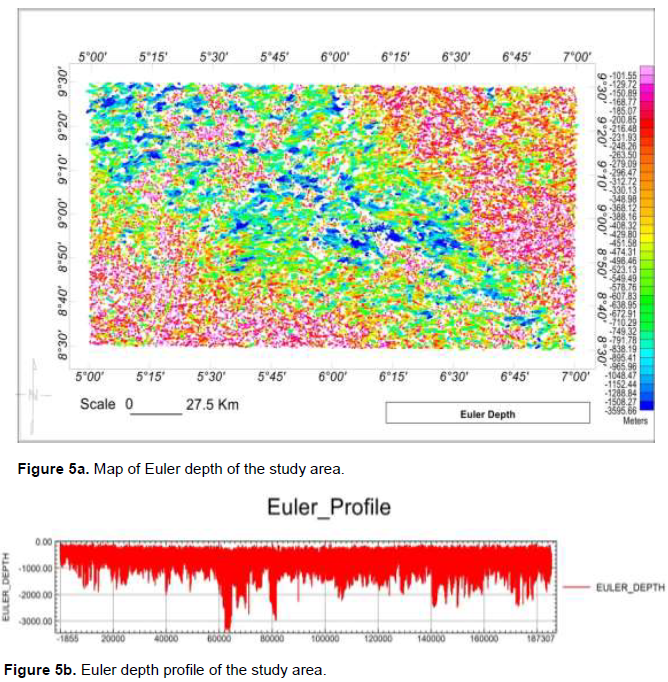
The Euler deconvolution method of depth determination is an automatic technique used for locating source of potential field based on amplitudes and gradients; it windows the area and locates structures and evaluate the depth to which those structures exist by writing equations for the structures. Its degree of accuracy depends on the structures having a perfect shape and that the structure or anomaly falls on the center of the window. Figures 5a and b represent the maps for the Euler depth and the profile respectively. The Euler Depth map shows that the depth to magnetic sources (anomalies) ranges from 101.55 to 3595.66 m, while the Euler profile estimates the maximum depth of the located anomalies to be about 3.5 km around Mokwa and Batati areas and this result is sufficient enough for hydrocarbon maturation or accommodation. The shallow sources also exist around Pategi, Paiko, Izom and Lapai areas with an average depth ranging from 107.74 m to about 514.82 m.
The source parameter imaging (SPI) is one of the depth estimating techniques that gives a better depth to top of magnetic rocks within the area of investigation. Result from SPI (Figure 6a) shows that the depth to magnetic body ranges from 107.74 to 4972.94 m. The map (Figure 6a) shows that the Pategi, Paiko, Izom and Lapai areas have the shallowest range of depths to the top of magnetic sources which ranges from 107.74 m to about 514.82 m. Batati and Mokwa areas have the maximum estimated depths to magnetic sources and become shallower towards Kutigi and Kutuwanji. The SPI profile (Figures 6b) estimates the maximum depth of the sedimentary units to be about 4200 m (4.2 km) because the isolated values beyond this depth cannot be correlated and this depth occurs around Mokwa and Batati areas.
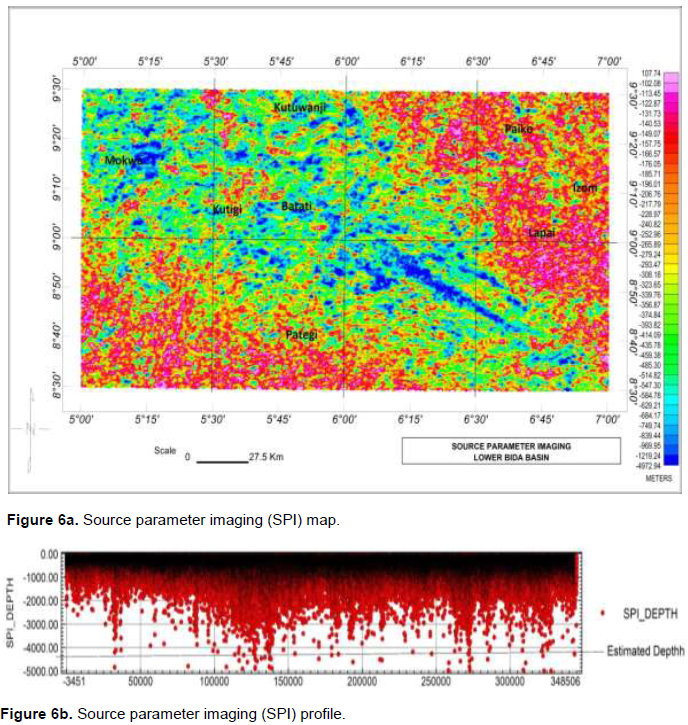
Figure 4 (residual map) was divided into sixteen (16) overlapping magnetic sections (A-P) using an algorithm in Oasis Montaj. Energy spectrum of each section was plotted against frequency wave number) with a Matlab program designed to estimate the deep and shallow magnetic source depth using the following equation:

where m1 and m2 are gradients of the first and second segment of the plot, and Z1 and Z2 are first and second depths respectively (Table 1).
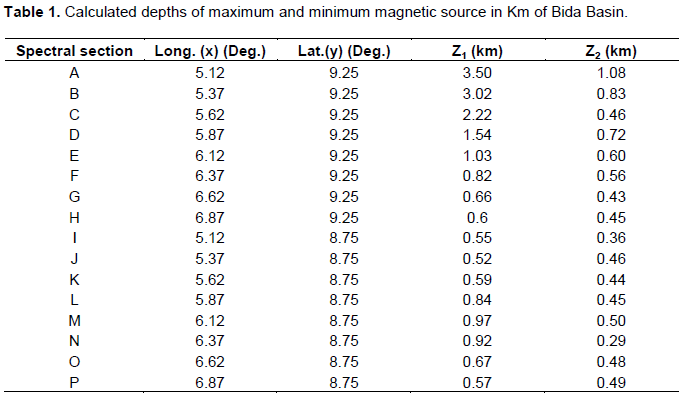
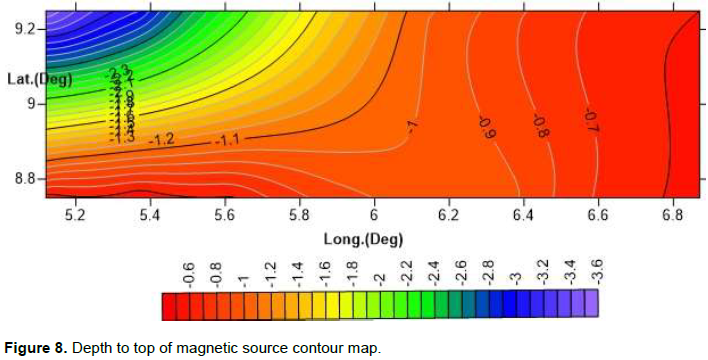
From Figure 7a, maximum depth of 3.50 km was obtained which agrees with the result of Euler deconvolution depth with minimum depth of 1.08 km. Likewise from Figure 7b to d, maximum depth of 3.0, 2.22 and 1.54 km were also obtained with minimum depth of0.83, 0.42 and 0.7 km respectively. Figure 8 is the contour map of first depth to magnetic source. Deeper depths of 3.5 km and 3.0 km are more noticeable at the extreme Northwestern part of the study area and this relate to Mokwa and Batati town respectively. The Shallow sources also exist around Pategi, Paiko, Izom and Lapai areas with an average depth ranging from 107.74 m to about 514.82 m.
Aeromagnetic data (HR) of Bida Basin had been interpreted with the aim of estimating the thickness of sediments for hydrocarbon potential. Three depth estimating methods were employed; Euler deconvolution, SPI and spectral analysis to estimate the thickness of sediments in the area of investigation for hydrocarbon potential. The result from Euler deconvolution and spectral analysis reveal maximum sedimentary thickness of 3.56 and 3.50 km respectively while the result of the SPI shows a maximum sedimentary thickness of 4.20 km. Previous research works on sedimentary thickness for hydrocarbon maturation showed that the sufficient sedimentary thickness for hydrocarbon maturation is about 3 km and above (Bemsen et al., 2013; Salako and Udensi, 2013; Adewumi et al., 2017; Lawal and Nwankwo, 2014). The result from this study is ample enough to accommodate oil and gas accumulation.
CONFLICT OF INTERESTS
The authors have not declared any conflict of interests.
REFERENCES
|
Biswas A (2018). Inversion of source parameters from magnetic anomalies for mineral /ore deposits exploration using global optimization technique and analysis of uncertainty. Natural Resources Research 27(1):77-107. |
|
|
Biswas A (2016). Interpretation of gravity and magnetic anomaly over thin sheet-type structure using very fast simulated annealing global optimization technique. Modeling Earth Systems and Environment 2(1):30. |
|
|
Biswas A, Acharya T (2016). A Very Fast Simulated Annealing method for inversion of magnetic anomaly over semi-infinite vertical rod-type structure. Modeling Earth Systems and Environment 2(4):198. |
|
|
Biswas A, Mandal,A, Sharma SP, Mohanty WK (2014). Integrating apparent conductance in resistivity sounding to constrain 2D Gravity modeling for subsurface structure associated with uranium mineralization across South Purulia Shear Zone. International Journal of Geophysics, 2014, Article ID 691521, 1–8. |
|
|
Obaje NG, Moumouni A, Goki NG, Chaanda MS (2011). Stratigraphy, Paleogeography and Hydrocarbon Resource Potentials of the Bida Basin in North-Central Nigeria. Journal of Mining and Geology 47:97-114. |
|
|
Obaje NG (2009). Geology and mineral resources of Nigeria. Dordrecht Heidelberg London New York: Springer-Verlag. |
|
|
Bemsen IE, Onwuemesi AG, Anakwuba EK, Chinwuko AI, Usman AO, Okonkwo CC (2013). Spectral Analysis of Aeromagnetic Data over Part of the Southern Bida basin, West-Central Nigeria. International Journal of Fundamental Physical Sciences 3:27-31. |
|
|
Udensi EE, Osazuwa IB (2004). Spectral determination of depths to magnetic rocks under the Nupe Basin, Nigeria. Nigerian Association of Petroleum Explorationists Bulletin 17:22-27. |
|
|
Reid AB, Allsop JM, Granser H, Millet AJ, Somerton IW (1990). Magnetic interpretation in three dimensions using Euler deconvolution. Geophysics 55:80-91. |
|
|
Salako KA, Udensi EE (2013). Spectral Depth Analysis of part of upper Benue Trough and Bornu Basin, Northeast Nigeria, using Aeromagnetic data. International Journal of Science and Research 2(8). |
|
|
Adewumi T, Salako KA, Salami MK, Mohammed MA, Udensi EE (2017). Sedimentary Thickness using Spectral analysis of Aermagnetic data over part of Bornu Basin, Northeast, Nigeria. Asian Journal of Physical and Chemical Science 2(1):1-8. |
|
|
Lawal TO, Nwankwo LI (2014). Wavelet analysis of high resolution aeromagnetic data over part of Chad Basin, Nigeria. Ilorin Journal of Science 1:110-120. |
|
|
Thurston JB, Smith RS (1997). Automatic conversion of magnetic data to depth dip, and susceptibility contrast using the SPITM method. Geophysics 62:807-813. |
|
Copyright © 2024 Author(s) retain the copyright of this article.
This article is published under the terms of the Creative Commons Attribution License 4.0


