Full Length Research Paper

ABSTRACT
The near-surface anisotropic properties within the South-Western Niger Delta were investigated to determine their impacts on geotechnical constructions. Uphole data analyses reveal a weathered layer that is thickest in the NW, E and SE with an average of 4.2 m and thinnest in the North-Central with a value of 3.8 m; a sub-weathered layer that is thickest in the NW and SW with an average of 32.1 m and thinnest in the SE with a value of 19.0 m and an underlying consolidated layer with great thickness. Vp/Vs values of 1.16265, 1.16279 and 1.16278 were computed for the layers, respectively. Similarly, Poisson’s ratio of -0.9214, -0.9201 and -0.9202 were obtained for the layers respectively. Shear modulus has an average of 4.01 × 10⁸ Nm-2 in the weathered layer, 26.0 × 10⁸ Nm-2 in the sub-weathered layer, and 49.98 × 10⁸ Nm-2 in the consolidated layer. Young’s modulus has an average of 0.63 × 10⁸, 4.11 × 10⁸ and 7.98 × 10⁸ Nm-2 in the layers, respectively. Bulk modulus has an average of 0.74 × 10⁸ Nm-2, 4.62 × 10⁸ Nm-2 and 0.94 × 10⁸ Nm-2 in the layers, respectively. The ultimate bearing capacity, qf has an average of 804.9, 2241.0 and 3349.8 kNm-2 in the layers, respectively. The allowable bearing pressure, qa of the soil has an average of 201.2, 560.2 and 837.4 kNm-2 in the layers, respectively. Core samples collected to a depth of 66 m from 12 wells revealed an admixture of sand, sandy-clay, clayey-sand and dominant clay units. These quantitative results correlate with the standard geotechnical values for clay. The large deposit of about 30 m of clay delineated in this research may act as expansive soils which portends danger for foundations of buildings located in this area and must be avoided.
Key words: Anisotropy, uphole, near-surface, clay, geotechnical, Niger Delta.
INTRODUCTION
The near-surface refers to the uppermost 50 to 100 m of the earth’s subsurface (Sheriff, 2002). It is made up of weathered low velocity materials that are usually fluid-saturated and unconsolidated. Physical properties such as thickness, lithology, density, seismic signal traveltime, velocity and attenuation effects among others within this zone may rapidly change laterally and/or vertically. This variation in the physical properties of a medium depending on the direction in which they are measured is known as anisotropy (Sheriff, 2002; Allaby, 2008). A good knowledge of the near-surface with its anisotropic properties is essential in view of the spurious effects exerted on seismic data and geological structures within this layer. Alaminiokuma and Amonieah (2012) observed that the base of the near-surface has large velocity contrast which sharply bends raypaths causing seismic waves to travel almost vertically through this medium and high impedance contrast making it an excellent reflector of multiples; highly absorbs seismic energy resulting in poor quality of records from shots; disproportionately changes travel-times of seismic waves due to the rapid change in velocity of the medium; shifts reflection events on adjacent traces out of their normal paths due to time delays of rays caused by abnormally low velocity and that the variation in the thickness of this medium may lead to false indications of significant structural relief features.
Several studies on the near-surface properties have been conducted in different parts of the Niger Delta, East-Central (Uko et al., 1992), South-Central (Eze et al., 2003), Western (Akpabio and Onwusiri, 2004), North-Central (Alaminiokuma and Amonieah, 2012) among others.
This research employs the uphole seismic survey and well logging techniques to investigate the near-surface and its anisotropic properties in South-Western Niger Delta with particular focus on the suitability of soil in this zone for geotechnical constructions.
Location of the study area
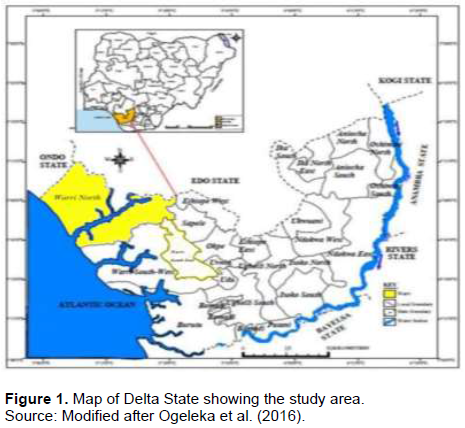
The study area is a 3-D seismic prospect which lies in the South-Western part of the Niger Delta, Nigeria (Figure 1). It is situated between latitude 06° 11' 08" and 05° 57' 20" North of equator and between Longitude 04° 58' 40" and 05° 09' 20" East of Greenwich Meridian. The prospect covers about 126.40 km2 in subsurface area. It is mainly in Warri North Local Government Area of Delta State. It is characterized by mud flats, river tributaries, creeks and tropical rain forests. Some of the major communities in the prospect are Onubaka, Uyabebekorigha, Itagbene, Awamba, Tigbagbene, Erewojere, Okuregbene, Kurukurugbene, Aribighia, and Atilabor.
METHODOLOGY
Uphole locations grid
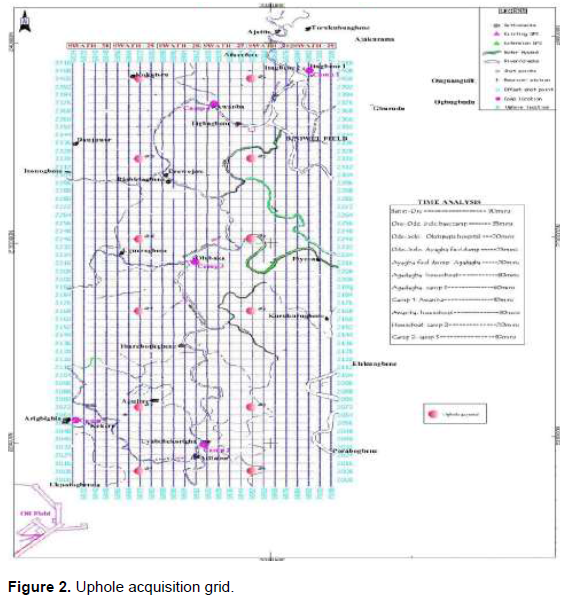
Twelve upholes in a grid specification of 4.0 × 4.0 km2 were drilled in the survey area (Figure 2). The uphole locations were drilled at intersection points between the source and receiver lines of a 3-D seismic survey. Uphole locations UH 4, UH 5, UH 8, UH 9, UH 10 and UH 11 were moved to new interception points (IP) as their original shot points fell on mud flat or directly inside creeks with high water levels.
Uphole drilling and core sampling
The upholes were drilled to 66 m using rotary method and flushed continuously to enhance stability for smooth and effective loading of the uphole tool. Core samples were collected at every 3 m-depth interval. Immediately after drilling, the holes were aligned to True Vertical Depth (TVD) with PVC casing to maintain formation strength.
Uphole geometry and data acquisition
The uphole tool consists of a harness made up of a marine rope with a hydrophone attached to its base. The harness is weighted on its lower end by a heavy metal and connected to a Mc Seis-SX 24 XP Seismograph on the ground surface. The marine rope was pre-calibrated at each depth point and logged up to 60 m for twelve channels as shown in Figure 3. The Seismograph is set up at a safe distance of 25 m from a 2.0 m shot hole and the drilled hole is loaded with the graduated harness down to depth. The following calibrated depths: 60, 50, 40, 30, 25, 20, 15, 10, 5, 3, 1, and 0 m were logged (Figure 3).
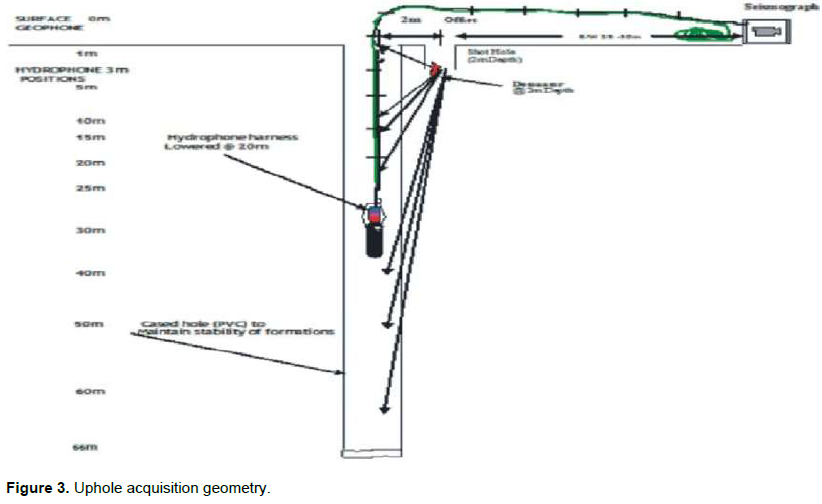
Charges (caps) are loaded into the shot hole and detonated at each graduated point starting with the 60 m mark and varied to the 0 m mark at the top. Shots are taken by sending firing commands from the Blaster Unit which provides the voltage discharge needed to trigger the detonators. The Blaster normally produces a field time signal simultaneously with the firing pulse to the caps. This signal is fed back and recorded into the Mc Seis-SX 24 XP Seismograph to produce the arrival time sequence. After every successful shot, the hydrophone harness is raised to the next calibrated depth. This procedure is repeated till the last depth of 0 m at the ground surface is logged.
Data processing/analysis
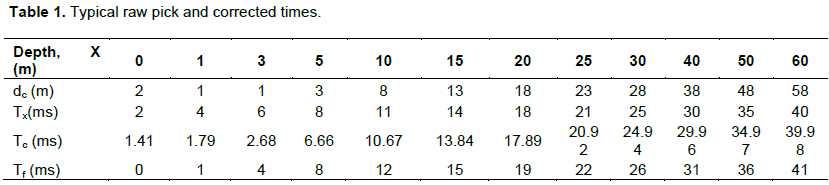
The acquired uphole survey data were processed by auto-picking the first-breaks from the recorded traces. The arrival times (Tx) read from the monitor are corrected for offset and shot depths creating the formula by adapting Pythagoras theorem:
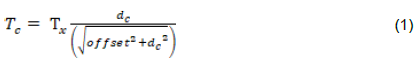
where Tc = Offset-corrected time; Tx = Raw Pick Time
dc (Corrected depth) = Depth (receiver) – Depth (Source) (2)
The time is finally corrected to surface using:
Ts (surface-corrected time) = Tc – Tc (O) (3)
where Tc (O) = Offset-corrected time at the surface.
Table 1 among others shows a typical raw pick time and the corrected time.
Computation of seismic parameters of the near surface
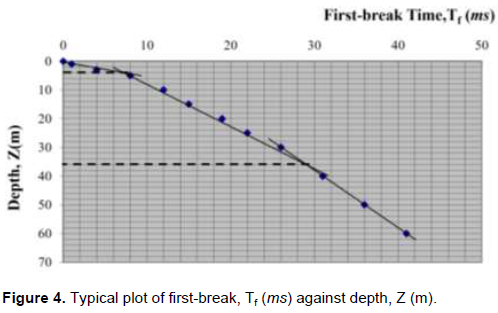
The first-break times, Tf (ms) are plotted against depths, Z (m) (Figure 4) and interpreted using an Excel-based program to deduce the thickness, calculate the p-wave velocities and estimate the s- wave velocities of the weathered, sub-weathered and the consolidated layers of the near surface by the following basic equation of physics for space and time:
(1) P-wave velocities, Vp were computed by:
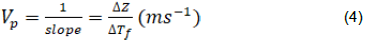
where  = change in first-break time (ms) and
  = change in depth (m).
(2) S-wave velocities, Vs were estimated using Castagna et al. (1985) equation for mudrock (A clastic silicate rock composed primarily of clay- or silt-particles (Blatt et al., 1972):
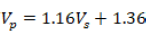
That is:

where Vp and Vs are in kms-1.
(3) Thickness, Z was deduced by extrapolating from the point of intersection of two layers to the depth axis.
Computation of dynamic elastic and foundation properties of the near surface
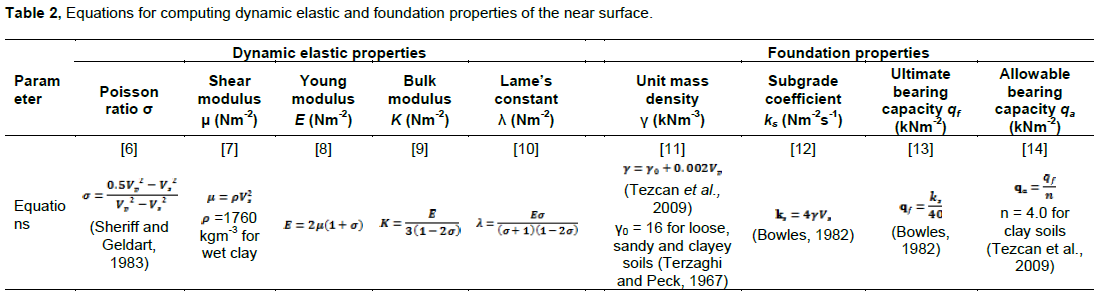
The computations of the dynamic elastic properties using established empirical relations and the foundation properties using standard engineering relations of the near surface are done using Equations 6 to 14 in Table 2.
RESULTS AND DISCUSSION
Lithofacies sequence classification
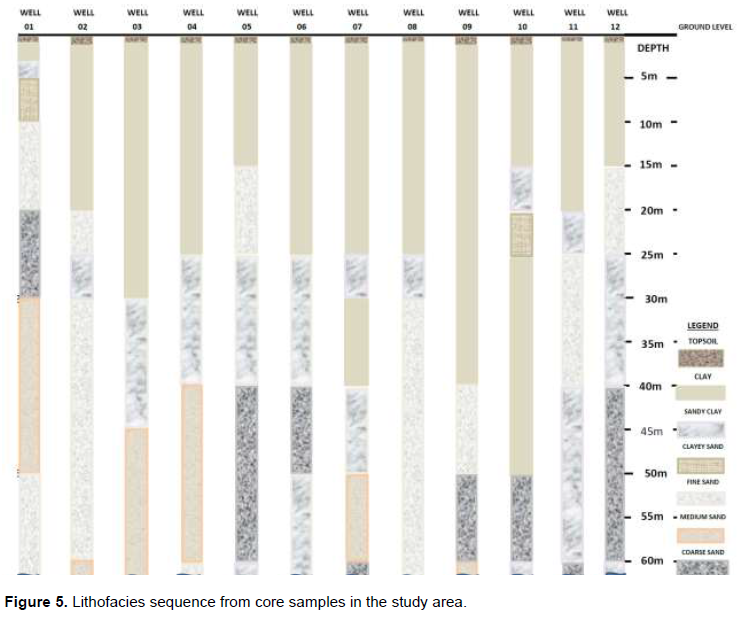
Lithofacies from core samples in the prospect revealed dominantly sand, sandy-clay, and clay units (Figure 5). The sand sequence varied in sizes from fine through medium to coarse. The sand is an admixture of the various sizes but demarcation is based on the size as defined by Wentworth scale of classification. The sequences observation conforms to the typical deltaic depositional environment.
Seismic properties of soil in the near surface
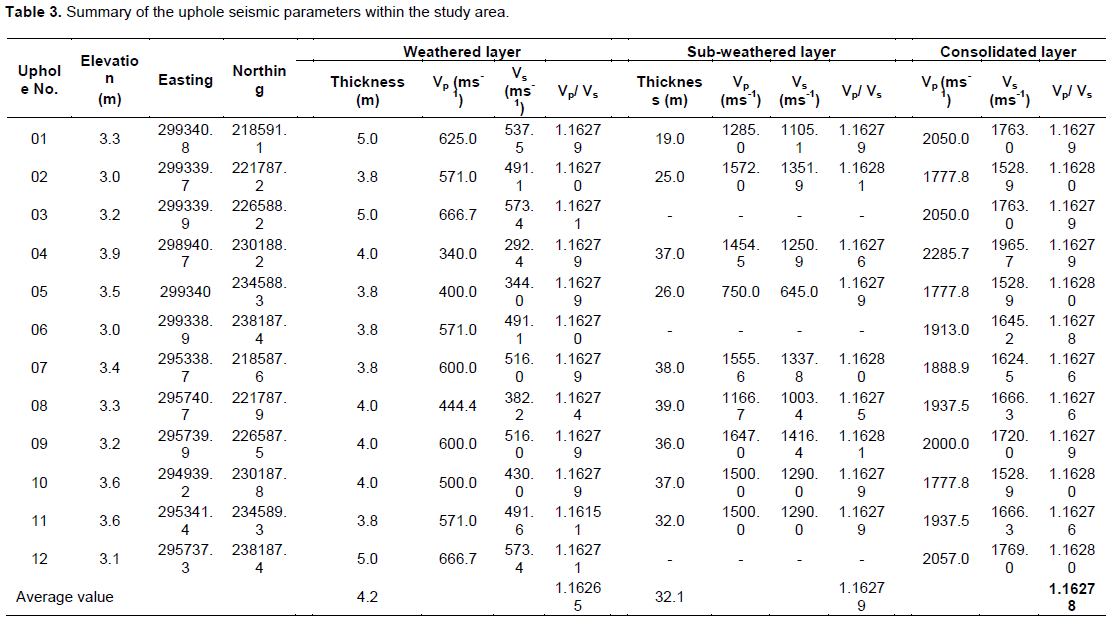
Table 3 is a summary of the results of interpretations of the uphole seismic data obtained for the near-surface within the study area.
Near-surface seismic properties
The results of the analyses of the uphole seismic data reveal the weathered, sub-weathered and consolidated layers in the study area. Figures 6 to 10 are isopachs and isovels showing the variation in thicknesses and velocities of the weathered, sub-weathered and consolidated layers.
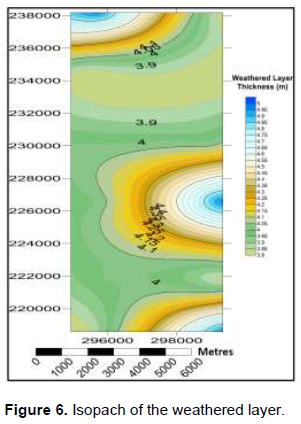
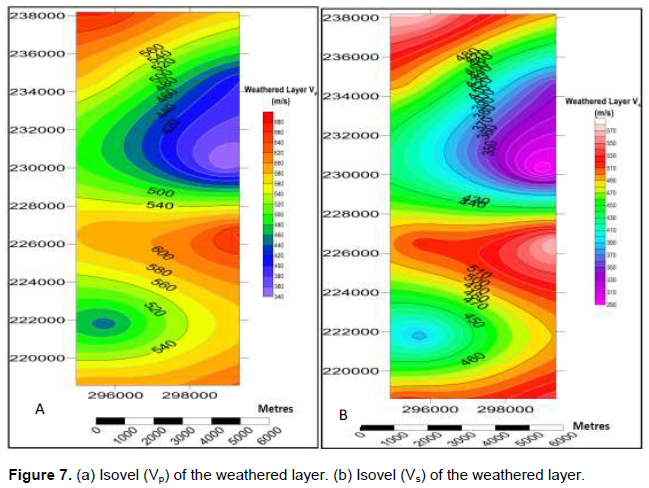
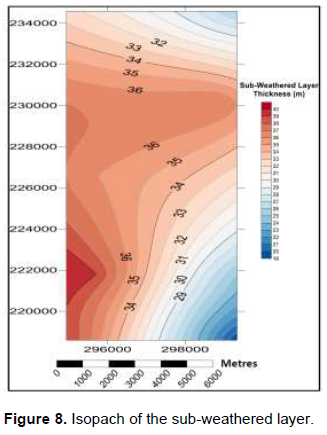
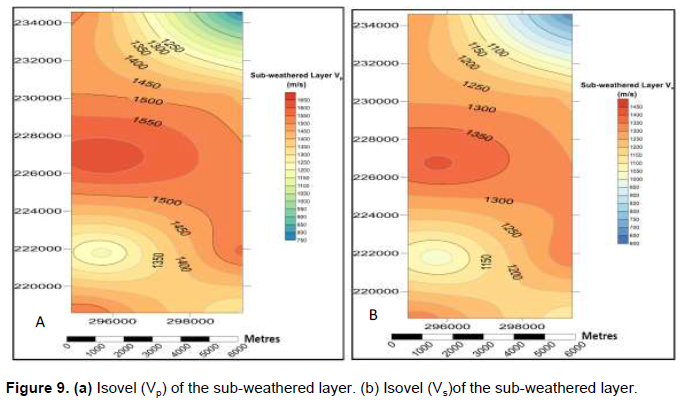
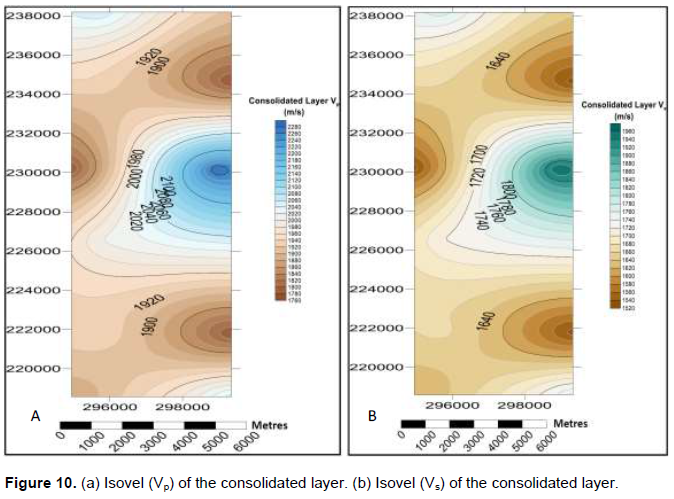
Figure 6 shows the weathered layer to be thickest in the North-Western, Eastern and South-Eastern parts with an average value of 4.2 m and made up predominantly of clay units. The layer is thinnest with a value of 3.8 m in the North-Central part.
Figure 7a and b shows the velocities (Vp and Vs) following similar trend as the thickness: highest in the North-Western, Eastern and South-Eastern parts with average values of 546.3 and 469.9 m/s for Vp and Vs, respectively and lowest in the North-East with values of 340 and 292.40 m/s for Vp and Vs, espectively.
Figure 8 shows the sub-weathered layer which underlies the weathered layer at an average depth of 4.2 m. It is observed to be thickest in the North-Western and South-Western parts of the prospect with an average value of 32.1 m, and thinnest in the South-Eastern part of the prospect with a value of 19.0 m.
The velocities (Vp and Vs) shown in Figure 9a and b are observed to be highest in the Western part with an average of 1381.2 and 1187.8 ms-1 for Vp and Vs, respectively and lowest in the South-East with values of 750 and 645 ms-1 for Vp and Vs, respectively.
The consolidated layer has velocities (Vp and Vs) that are highest in the Eastern part with values of 2285.7 and 1965.7 ms-1, respectively and lowest in the North-Eastern and South-Eastern parts with values of 1777.8 and 1528.9 ms-1 for Vp and Vs, respectively (Figure 10). The average computed consolidated layer velocities for Vp and Vs are 1964.5 and 1689.5 ms-1, respectively.
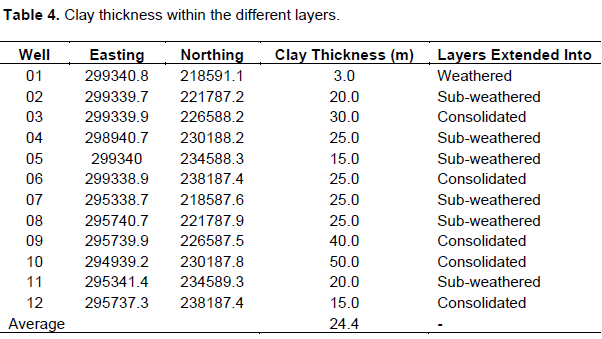
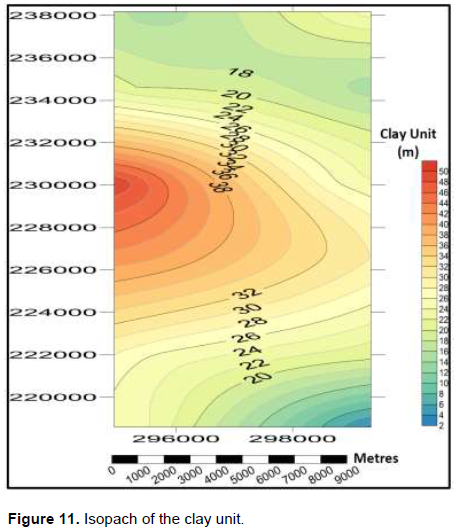
Anomalously thick clay unit in the study area
The most outstanding feature observed from the core samples/lithological sequence (Figure 5) is the anomalously thick clay unit in the study area. It practically extends from ground surface across the different near-surface weathered layers deep into the consolidated layer. Table 4 is a summary of the thickness of the clay unit while Figure 11 is an isopach of thickness of the clay unit in the study area. The clay is thickest in the mid-western section of the study area.
Geotechnical parameters of soil in the near surface of the study area
The results of the computed dynamic elastic properties employing Equations 6 to 10 and the foundation properties employing Equations 11 to 14 of the soil in the study area are shown in Table 5.
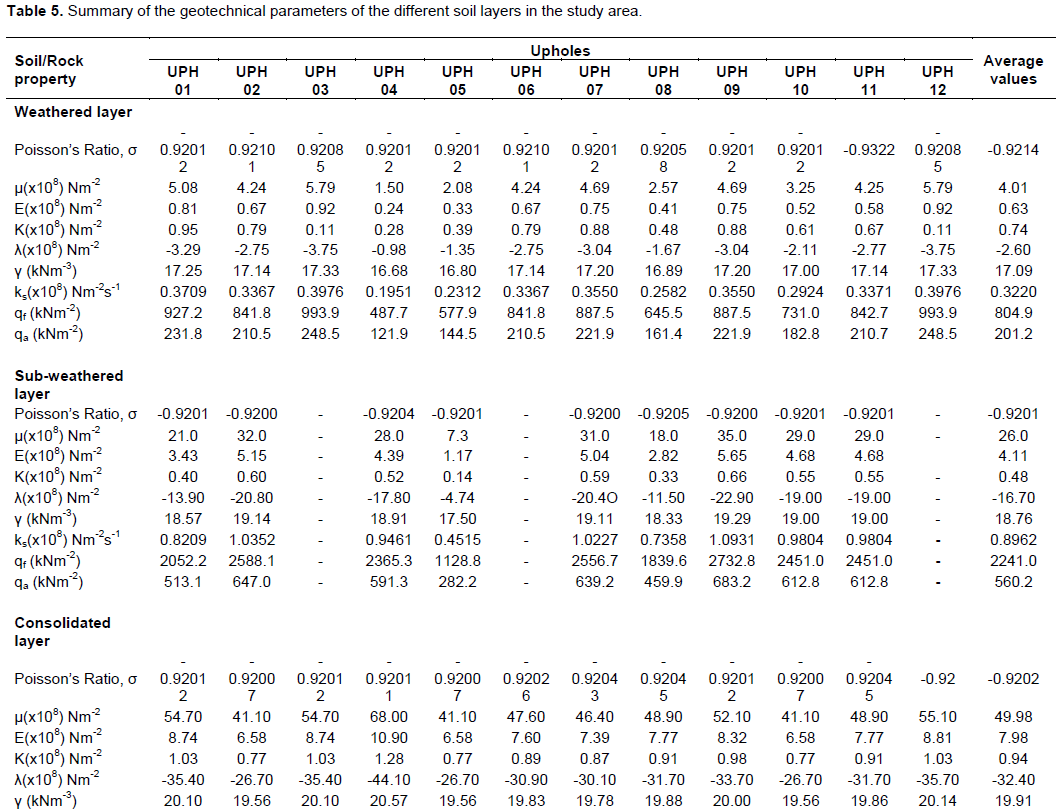

Dynamic elastic properties
Table 3 shows the average Vp/Vs values of 1.16265, 1.16279 and 1.16278 for the weathered, sub-weathered and consolidated layers, respectively. These values are observed to be approximately equal in the different layers. This is indicative of similarity in the type of lithologic material extending from the weathered into the consolidated layer. Table 4 shows the average Poisson’s ratio, σ values of -0.9214, -0.9201 and -0.9202 for the weathered, sub-weathered and consolidated layers, respectively. Poisson’s ratio is similarly observed to be approximately equal with negative values in the different layers. Shear modulus ranges from 1.50 to 5.79 × 10⁸ Nm-2 with an average of 4.01 × 10⁸ Nm-2 in the weathered layer; 7.30 to 35.0 × 10⁸ Nm-2 with an average of 26.0 × 10⁸ Nm-2 in the sub-weathered layer; and 41.1 to 68.00 × 10⁸ Nm-2 with an average of 49.98 × 10⁸ Nm-2 in the consolidated layer. Young’s modulus ranges from 0.24 to 0.92 × 10⁸ Nm-2 with an average of 0.63 × 10⁸ Nm-2 in the weathered layer; 1.17 to 5.65 × 10⁸ Nm-2 with an average of 4.11 × 10⁸ Nm-2 in the sub-weathered layer; and 6.58 to 10.9 × 10⁸ Nm-2 with an average of 7.98 × 10⁸ Nm-2 in the consolidated layer. Bulk modulus ranges from 0.11 to 0.95 × 10⁸ Nm-2 with an average of 0.74 × 10⁸ Nm-2 in the weathered layer; 0.14 to 0.66 ×10⁸ Nm-2 with an average of 4.62 ×10⁸ Nm-2 in the sub-weathered layer; and 0.77 to 1.28 × 10⁸ Nm-2 with an average of 0.94 × 10⁸ Nm-2 in the consolidated layer.
Foundation properties
The results in Table 4 further reveal that the ultimate bearing capacity, qf in the study area ranges from 487.7 to 993.9 kNm-2 with an average of 804.9 kNm-2 in the weathered layer and from 1128.8 to 2732.8 kNm-2 with an average of 2241.0 kNm-2 in the sub-weathered layer. The ultimate bearing capacity for the consolidated layer ranges from 2989.9 to 4043.7 kNm-2 with an average of 3349.8 kNm-2. The allowable bearing pressure, qa that the soil can withstand ranges from 121.9 to 248.5 kNm-2 with an average of 201.2 kNm-2 in the weathered layer and from 282.2 to 683.2 kNm-2 with an average of 560.2 kNm-2 in the sub-weathered layer. The bearing pressure in the consolidated layer ranges from 747.5 to 1010.9 kNm-2 with an average of 837.4 kNm-2.
The ultimate bearing capacity and the allowable bearing pressure are observed to have higher values which increase with increasing depth in the sub-weathered and consolidated layers within the study area.
These values are within the civil engineering standards for geotechnical constructions.
CONCLUSION
The near-surface in the study area is made up of weathered layers with seismic properties such as thickness and velocities varying laterally and vertically. Vp/Vs values are approximately uniform in the weathered, sub-weathered and consolidated layers to depth greater than 30 m in the study area and this indicates that the layers are made up of uniform lithologic material. Core samples obtained to this depth indicates that the lithologic material in this zone is predominantly clay units with varying degrees of water saturation and admixture of lithofacies. The elastic parameters are all uniform with depth through the different layers. The negative values of Poisson’s ratio observed in the different soil layers indicate high fluid-saturations in the layers. This fluid-saturated soil layers imply the presence of rippable swelling clay minerals which do not constitute good foundation materials. They are referred to as expansive soils which when wet, swells and expands but when dry shrinks and leads to cracks and failures in foundations of buildings, roads, bridges, dams and other geotechnical constructions (Jones and Jefferson, 2012).
The Shear modulus, Young’s modulus and Bulk modulus obtained fall within the standard civil engineering limits. But they all lie within the anomalously thick clay unit which is not suitable for foundations due to its expansive nature. The ultimate bearing capacity and allowable bearing pressure show the increasing ability of the layers to withstand more pressure and bear more load with increasing depth in the study area.
RECOMMENDATION
The area is not recommended for setting up structures that are expected to stand the test of time because the foundations of these structures may experience cracks and faults with time due to the expansive nature of the soil. However, for the construction of high-rise buildings/skyscrapers in the study area, a topsoil depth of about 30 m should be reinforced by piling in order to avoid the adverse effects of the large deposit of clay on geotechnical constructions.
Other geological and geotechnical techniques should also be employed preceding any construction works in the study area to properly delineate depths to the bedrocks and determine soil properties that are suitable for siting good foundations. These recommendations are essential to prevent collapse of buildings resulting from cracks and faults in the foundations within this study area.
ACKNOWLEDGMENTS
The authors are grateful to SAHARA ENAGEED under whose auspices this research was conducted. They are particularly thankful to Integrated Data Services Limited (IDSL) for granting them the opportunity to have access to the data used for this study. They also thank the Department of Petroleum Resources (DPR) for the approvals to access the data.
CONFLICT OF INTERESTS
The authors have not declared any conflict of interests.
REFERENCES
|
Akpabio IO, Onwusiri HO (2004). Computation of Low Velocity Layer Correction Parameters in Parts of Western Niger Delta, (OML 62), Global Journal of Geological Sciences 2(1):45-50. |
|
|
Allaby M (2008). Oxford Dictionary of Earth Sciences. Oxford University Press Inc., New York, third Edition P 27. |
|
|
Alaminiokuma GI, Amonieah J (2012). Near-Surface Structural Model for Enhanced Data Acquisition and Processing in the North-Central Niger Delta. American Journal of Industrial and Scientific Research, 3(5):252-262. |
|
|
Blatt H, Middleton GV, Murray RC (1972). Origin of sedimentary Rocks: Prentice-Hall, Inc. |
|
|
Bowles JE (1982). Foundation Analysis and Design, 3rd ed., McGraw-Hill Book Company, New York. |
|
|
Castagna JP, Batzle ML, Eastwood R (1985). Relationship between compressional-wave and shear wave velocities in clastic silicate rocks. Geophysics 50:571-581. |
|
|
Eze CL, Okwueze EE, Uko ED (2003). The velocity - thickness characteristics of the mangrove swamp low velocity layer (LVL) South central Niger Delta, Nigeria. Global Journal of Pure and Applied Sciences 9(3):369-374. |
|
|
Jones LD, Jefferson IF (2012). Chapter C5 - Expansive Soils, Institution of Civil Engineers Manual Series pp. 1-46. |
|
|
Ogeleka DF, Edjere O, Nwudu A, Okieimen FE (2016). Ecological Effects of Oil Spill on Pelagic and Bottom Dwelling Organisms in the Riverine Areas of Odidi and Egwa in Warri, Delta State, Journal of Ecology and The Natural Environment 8(12):201-211. |
|
|
Sheriff RE, Geldart L (1983). Exploration Seismology, Vol. 1. Cambridge University Press, London. |
|
|
Sheriff RE (2002). Encyclopedic Dictionary of Applied Geophysics. Fourth Edition. 13 Geophysical References Series. Society of Exploration Geophysicists (SEG), USA pp. 13-14. |
|
|
Tezcan SS, Ozdemir Z and Keceli A (2009). Seismic Technique to Determine the Allowable Bearing Pressure for Shallow Foundations in Soils and Rocks. Acta Geophysica 57(2):400-412. |
|
|
Terzaghi K, Peck RB (1967). Soil Mechanics in Engineering Practice, 2nd Edition, John Wiley and Sons, London. |
|
|
Uko ED, Ekine AS, Ebeniro JO, Ofoegbu CO (1992). Weathering Structure of the East Central Niger Delta, Nigeria, Geophysics 57(9):1228-1233. |
|
Copyright © 2024 Author(s) retain the copyright of this article.
This article is published under the terms of the Creative Commons Attribution License 4.0


