ABSTRACT
Fifteen vertical electrical sounding (VES) stations were sounded using Schlumberger electrode configuration. The result revealed a total of 3 to 4 geoelectric layers. The first layer with resistivity values range from 2.8 to 149.2 Ωm and has thickness and depth of 0.1 to 6.5 m. The second layer has resistivity which ranges from 245.9 to 7761.2 Ωm, thickness of 1.1 to 10.7 m and depth of 1.2 to 17.2 m. This layer was observed to be more resistive than the overlain layer. The third layer was delineated with the resistivity range of 49.4 to 2161.4 Ωm, thickness of 4.5 m-∞ and depth of 5.7 m- ∞. The fourth layer has resistivity values which range from 203.3 Ωm-∞ within the maximum current electrode separation. The observed curve types are K, Q, KH and QK with K being the dominant curve type. The contour maps generated display the variation of the electrical properties of the subsurface layers. The lithology layer with clay is not suitable for building foundation due to their expansive nature while the laterite which is mechanically stable is suitable for building foundation. The lateritic layer to a depth of 1.2 to 3.0 m is considered suitable for massive engineering structures with strong base for solid foundation.
Key words: Vertical electrical sounding, construction purpose, subsurface lithology, building foundation, Makurdi.
The rate of buildings failure throughout the country have increased in recent times and a number of lives and properties have been lost. There are several cases of collapsed building and cracking of walls as a result of poor foundation during construction and lack of site investigation (Alhassan et al., 2015). This may be attributed to poor soil stability, since some soils are more sensitive to moisture gain or loss (Egwuonwu and Sule, 2012), and also lack of knowledge of structural distributions of the subsurface. Geophysical surveys are often ignored when considering sites for construction purposes. The design of a structure which is safe, durable and has low maintenance costs depends upon adequate understanding of the ground on which such building is located. The necessity for site characterization for construction purposes has therefore become very vital so as to prevent loss of valuable lives and properties that always accompanied such failures. The primary purpose of all site investigations is to obtain the data needed for analysis and design (Oyedele et al., 2012).
Some general reasons why buildings may be susceptible to collapse have been advanced, which include poor quality of building materials, salinity and age of buildings. Less frequently mentioned is subsurface condition of the ground on which the buildings are sited. The geology of an area plays an important role in the construction of buildings. Most buildings are constructed on soil that has inadequate bearing capacity to support the weight of the structure (Ibitoye et al., 2013). Constructions are affected by geological/geophysical features. These geological/geophysical features include fractures, voids, extent of depth to bedrock, depth to the water table, etc. A good knowledge of the underground strata before construction will help in preventing cracks. Seepage precipitated settlement and natural differential settlement arising from the underlying clayey substratum were responsible for the failure of spilling structure (Olorunfemi et al., 1999). Garg (2007) indicates that the geologic discontinuities and structural dislocations of the underground strata are some of the geological causes of differential settlements and buildings.
Electrical resistivity survey is increasingly being used in
environmental, engineering and hydrological investigations as well as geothermal and mineral prospecting, where detailed knowledge of the subsurface is sought. It is based on the fact that the subsurface structures possess varying resistivities and it provides subsurface information regarding subsurface resistivity distribution, thickness and depth of various layers when compared with other methods like gravity and magnetic. The differences in electrical properties are investigated and analyzed to delineate underground structures. Due to high spatial resolution, relatively fast field data acquisition time and low cost, the geoelectric methods have been employed by several researchers in studying the subsurface structures (Griffiths and Barker, 1993; Lapenna et al., 2005; Soupios et al., 2006; Alhassan et al., 2015). This study will help in determining the nature and properties of the subsurface for proper foundation design and solving problems associated with the construction of various civil engineering purposes.
Location and geology of the study area
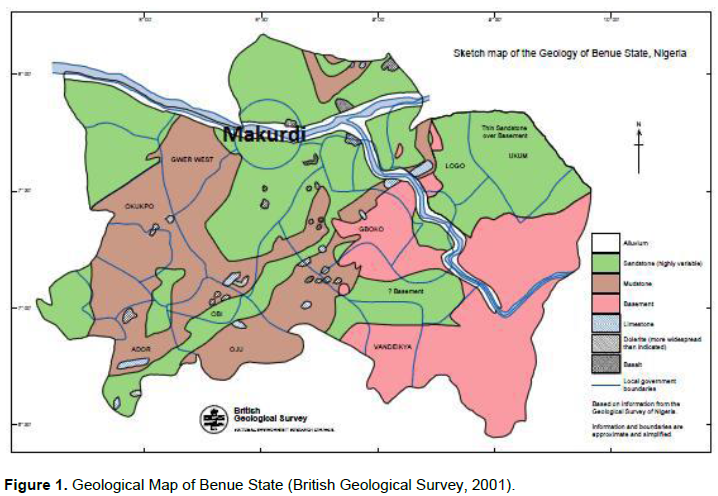
The study area, Makurdi lies between latitudes 7°40'N and 7°50'N of the Equator and between longitude 8°20'E and 8°40'E of the Greenwich Meridian, covering a total area of about 670 km² (Figure 1). Makurdi lies within the Guinea savannah vegetation zone with a few patches of forests. The study area is comprised of three zones; the lower Makurdi sandstone, the upper Makurdi sandstone and the wadata limestone (Nwajide, 1982). The lower Makurdi sandstones, which could be found around Makurdi airport, consist of sandstones and mudrocks. They are micaceous throughout with mudrocks predominating. The upper Makurdi sandstone is similar to the lower sandstones but with mudrocks being relatively less common as found around the North Bank area of Makurdi. In this zone, there are shale units of mainly fissile siltstone, usually brownish-grey in colour and often abundantly micaceous. Wadata limestone also consists of several limestone occurrences; most outcrops are shelly limestone often closely associated with mudrocks which is the most extensive component of the Makurdi Formation. The stones in these zones are generally fine-grained, moderately sorted, micaceous and feldsphatic. In some parts, they are calcareous and shelly. Various types of cement like iron oxides, silica, carbonates and clay are shown to be present in the Makurdi sandstones (Agbede and Smart, 2007). The study area is drained by the River Benue. It is one of the rivers in Nigeria that is not plagued by with waterfalls and rapids. It also records average maximum and minimum daily temperatures of 35 and 16°C in rainy season and 37 and 21°C in dry season, respectively (Agbede and Smart, 2007).
The resistivity survey was carried out in Makurdi, Benue State. Vertical electrical sounding (VES) technique employing Schlumberger electrode configuration was used. The current and potential electrodes are collinearly arranged and have a common midpoint, but the distance between adjacent electrodes varies. The current and potential electrodes are planted with the inter-electrode spacing expanding progressively about the station with increasing sounding points (Lowrie, 1997). The apparent resistivity was calculated using:
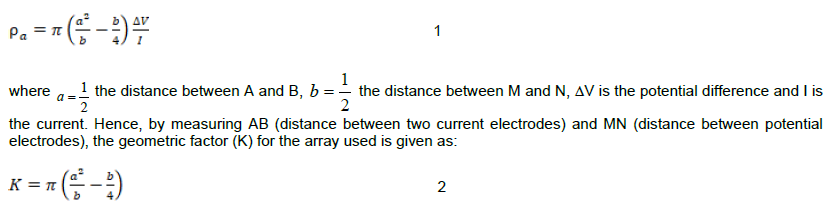
A total of fifteen soundings were taken using SAS 1000 ABEM Terrameter. The data obtained from the electrical resistivity survey was plotted on a log-log graph paper. The qualitative analysis was done to determine the curve types exhibited by each sounding point. Employing the partial curve matching technique, the qualitative analysis was achieved together with their corresponding auxiliary curves (Zohdy, 1974). The actual resistivity and thickness of the subsurface layers were obtained by matching the field curves on the log-log graph with the two layer master curves and the corresponding auxiliary curves. These parameters were then used for the computer iteration technique using the windResist software to give the actual resistivities, depths and thicknesses of the layers.
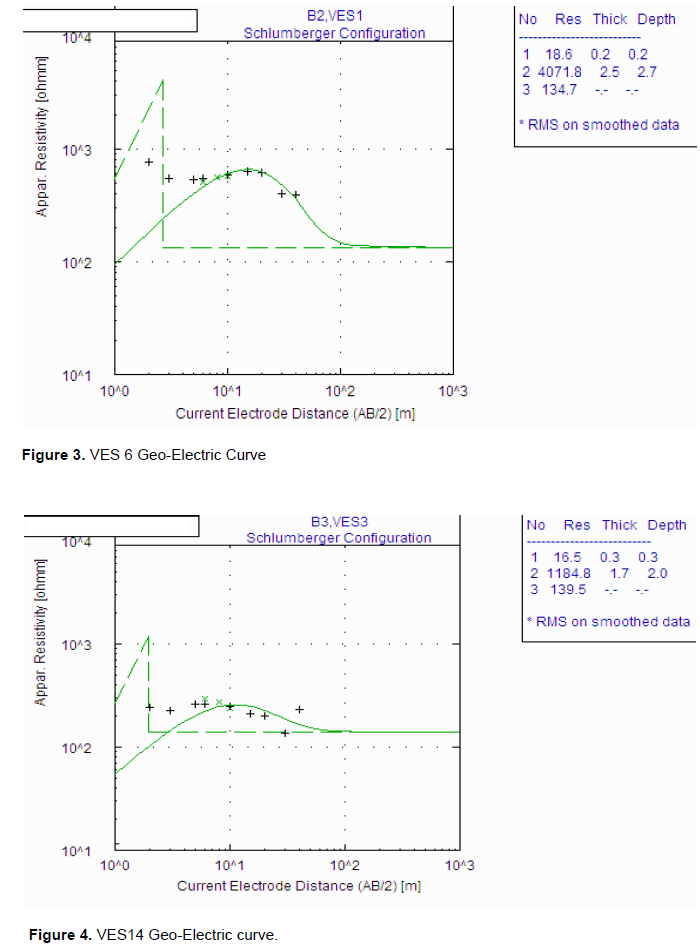
The results of the geophysical study is presented in Table 1 and some of the vertical electrical sounding (VES) curves are as shown in Figures 2, 3 and 4. The electro-stratigraphy of the study area reveals a total of three to four geoelectric layers across the fifteen VES stations. Also the values of resistivity, thickness and depth of the subsurface layers are revealed and vary for the various soundings. K, Q, KH and QK curve types were observed with K been the dominant.
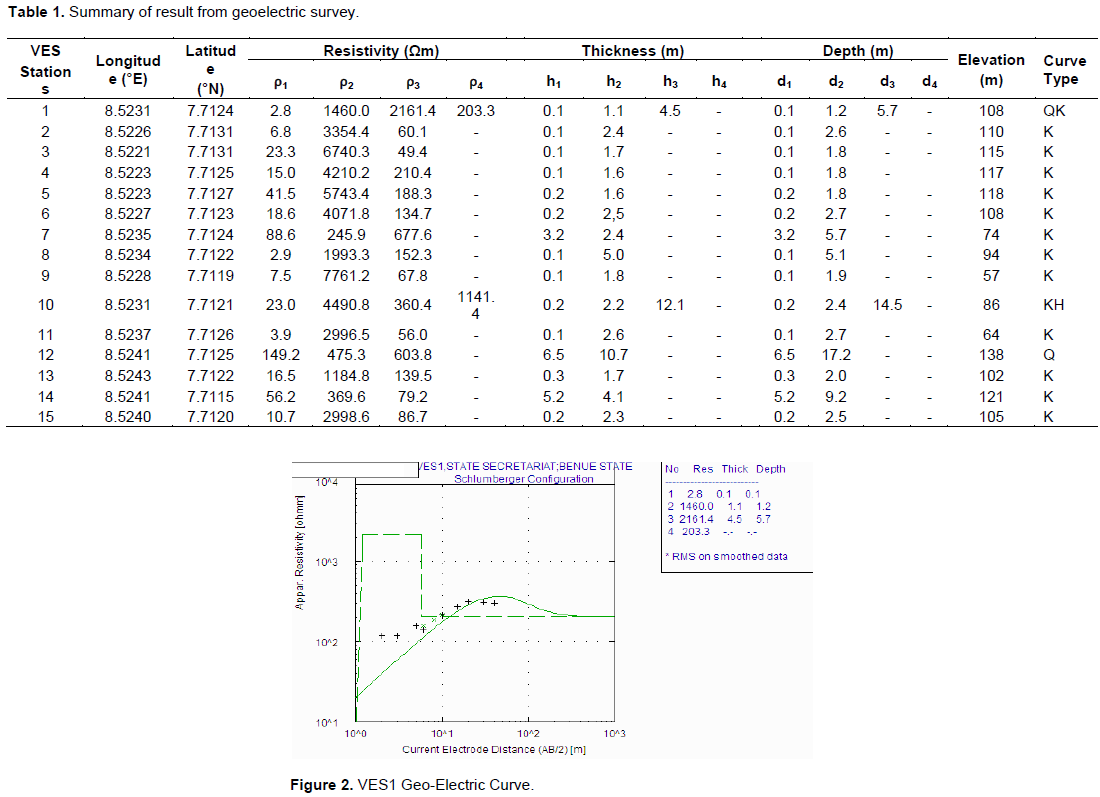
The resistivity of the first layer ranges from 2.8 to 149.2 Ωm, with the 149.2 Ωm obtained in VES12. The thickness and depth of this layer range from 0.1 to 6.5 m and on the average is relatively low. The lithology of this top layer can be said to be made up of clay, sand clay and lateritic soil. The clayey soil comprises silicate, mica, iron and aluminium hydroxide and is expansive in nature. The thickness and depth of the first layer are below 1.0 m except in VES 7, 12 and 14. Generally, the first layer will be harmful to foundation of engineering structures within the study area, unless escavated and refilled with sand, gravel and laterite. The contour map (Figure 5) shows the variation of resistivity in the first layer with high resistivity observed in the northeastern part of the study area. This uneven distribution of resistivity can result in an uneven distribution of stress. The thickness of the top layer is high in the northeastern and southeastern parts of the study area (Figure 6). This corresponds to the spread of resistivity in the study area and depicts the heterogeneous nature of the subsurface. The high resistivity zones may indicate the presence of a highly weathered geomaterials.
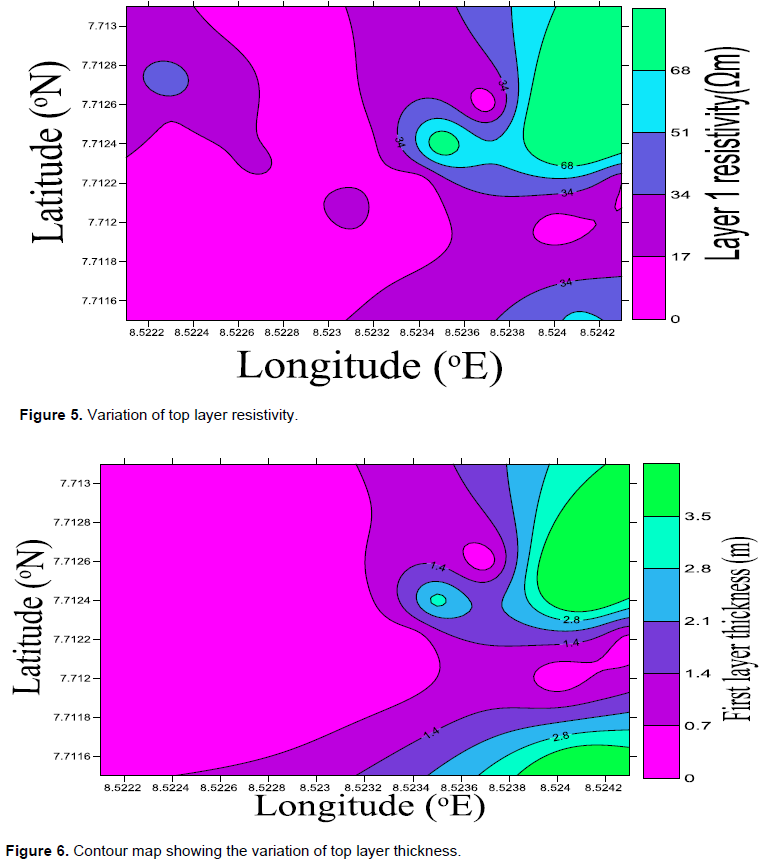
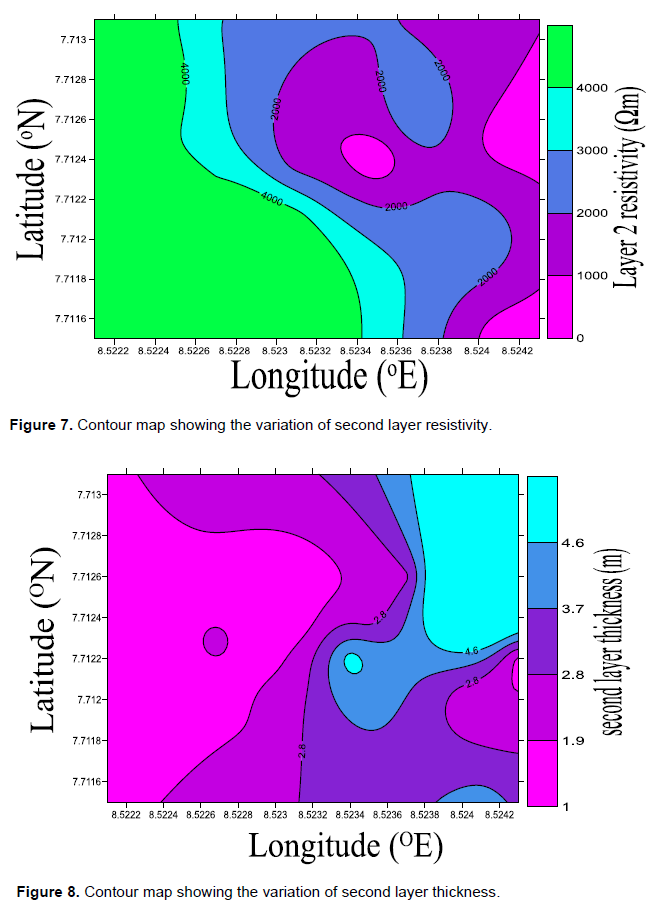
The second layer has remarkable high resistivity range of 245.9 to 7761.2 Ωm which is evident of laterites and sandstones. The relative thickness and depth of this layer range from 1.1 to 10.7 m and 1.2 to 17.2 m, respectively. The laterites are soil types rich in iron and aluminium and are firm and physically resistant (Hill et al., 2000). Sandstones are sedimentary rocks composed mainly of sand-sized minerals and rock grains. The variation of electrical resistivity across the second layer is as shown in Figure 7. The high resistivity is observed to spread across the northwest-southwest. This is a reverse of what is observed in the first layer. The second layer thickness (Figure 8) is high in the western part of the study area that has high resistivity while high thickness is observed in the northeastern part of the study area. It may be inferred that this layer is suitable for engineering structures. The second layer which is highly resistive with high lateritic thickness can be delineated as the most reliable layer for building foundation. It will be convenient to dig a foundation to any point within 1.2-3.0 m.
Formations that are primarily composed of sandstones usually allow percolation of water and other fluids and porous enough to store large quantities, making them valuable aquifers; the aquifer in the area can be said to be confined. They are resistant to weathering, yet easy to work on.
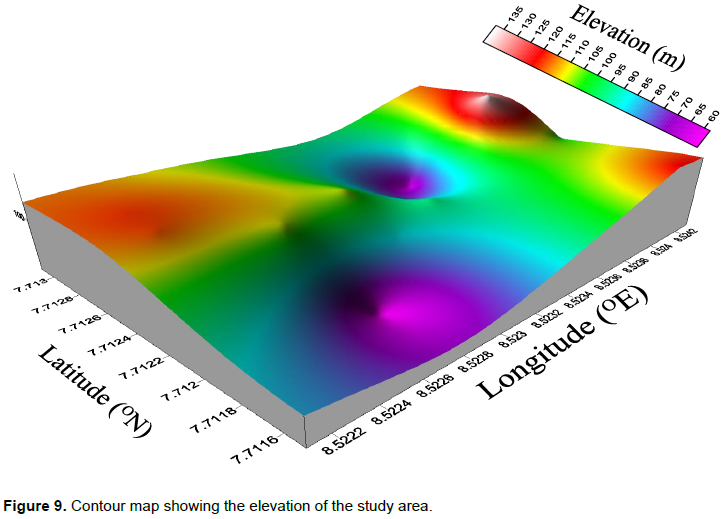
The resistivity of the third layer ranges from 49.4 to 2161.4 Ωm, which is relatively lower than the second layer resistivity values. The thickness and depth of this layer is undefined within the maximum current separation except in VES 1 and VES 10 which have the fourth layer. The geology of the area reveals the presence of sandstones which comprises of iron oxides, silica, carbonates and clay (Nwajide, 1982). The 3-D contour map (Figure 9) shows high elevation in northeast, northwest and southeast and correspond to zones having high thickness. The eastern part of the study area is delineated as the suitable site for siting heavy structures.
This work confirms the applicability of electrical resistivity survey in geotechnical studies for site characterization. The result of the study shows the variation of resistivity with depth and thickness of the geo-electric layers. This observation is due to effect of anisotropy of resistivity in some strata. The variation of lithology in the study area shows the curve types as K, Q, KH and QK, consisting of clay, sand clay, laterite and sandstone. The existence of sand and clay at specific depths is capable of being inimical to buildings in the study area. This is because these layers are mechanically unstable and are not suitable for foundation of buildings. Laterite and sandstone are suitable formations for building projects due to their strength and lateritic layer is highly recommended for proposed structures. Hence, intended structures should be safely founded in the course and mechanically stable lateritic layer to about 1.2 to 3.0 m deep.
The authors have not declared any conflict of interests.
REFERENCES
|
Alhassan UD, Obiora DN, Okeke FN (2015). The assessement of aquifer potentials and aquifer vulnerability of southern Paiko, north central Nigeria, using geoelectric method. Glob. J. Pure Appl. Sci. 21:51-70.
|
|
|
|
British geological survey (2001). Sketch map of the geology of Benue State; Report on visit to a Water Aid project, Nigeria, to carry out workshops and assess geology of Benue State. Keyworth Nottingham.
|
|
|
|
|
Egwuonwu GN, Sule O (2012). Geophysical Investigation of foundation failure of a leaning superstructure in Zaria Area, Northern Nigeria. Res. J. Eng. Appl. Sci. 1(2):110-116.
|
|
|
|
|
Garg SK (2007). Physical and Engineering Geology. Khanna Publisher, Delhi, India.
|
|
|
|
|
Griffiths DH, Barker RD (1993). Two Dimensional Resistivity Imaging and Modeling in areas of Complex Geology. J. Appl. Geophys. 29(3):211-226.
Crossref
|
|
|
|
|
Ibitoye FP, Ipinmoroti FV, Salami M, Akinluwade KJ, Taiwo AT, Adetunji AR (2013). Application of geophysical methods to building foundation studies. Int. J. Geosci. 4:1256-1266.
Crossref
|
|
|
|
|
Hill IG, Worden RH, Meighan IG (2000). Geochemical evolution of palaeolaterite: the interbasaltic formation, Northern Ireland. J. Chem. Geol. 166:65-84.
Crossref
|
|
|
|
|
Lapenna V, Lorenzo P, Perrone A, Piscitelli S, Rizzo E, Sdao F (2005). 2D electrical resistivity imaging of some complex landslides in Lucanian Apennine chain, southern Italy. Geophy. 70(3):B11-B18.
Crossref
|
|
|
|
|
Lowrie W (1997). Fundamentals of Geophysics. Cambridge University Press, New York.
|
|
|
|
|
Nwajide CS (1982). Petrology and Paleography of the Makurdi formation. Unpublished PhD Thesis, Department of Geology, University of Nigeria, Nsukka.
|
|
|
|
|
Olorunfemi MO, Ojo JS, Akintunde MO (1999). Hydrogeophysical evaluation of groundwater potentials of Akure metropolis, Southwestern Nigeria. J. Mining and Geol. 35(2):207-228.
|
|
|
|
|
Oyedele KF, Oladele S, Adeyemi O (2012). Applications of geophysical and geotechnical methods to site characterization for construction purpose at Ikoyi, Lagos, Nigeria. J. Earth Sci. Geotech. Eng. 1(1):87-100.
|
|
|
|
|
Soupios P, Papazachos CB, Vargemezis G, Savvaidis A (2006). In situ geophysical investigation to evaluate dynamic soil properties at theIlarionas Dam, Northern Greece. Proc. 2nd Int. Conf. Advances in Mineral Resources Management and Environmental Geotechnology (Hania, Crete, Greece, 25-27) (Heliotopos Conferences): pp. 149-156.
|
|
|
|
|
Zohdy AA (1974). Automatic Interpretation of Schlumberger Sounding Curves. Geological urvey Bulletin, 1313-E US Government Printing Office, Washington, 71 p.
|
|