ABSTRACT
Wellness depends on health and that, in turn, depends on the absence of disease. Analogous models based on physical laws have long been utilized by researchers to understand epidemic expansion in urban communities. Perhaps the most significant of this class is the gravity model in which population size is equated with planetary mass and distance between cities to that separating planets. While the model assumes homogeneity among different bodies, cities or planets, in epidemiology the likelihood of disease spread may depend on other heterogeneous, non-constant factors. The study used a public dataset of H1N1 Influenza in 2009 as the focus. A natural log regression was applied in an attempt to sort the relative importance of gravity model variables as predictors of influenza occurrence and diffusion. It was found that while the model population size serves as a general predictor of disease expansion that distance failed as an indicator of disease dynamics. Furthermore, findings from the study show that disease progression was irregular and not, as one might expect from the gravity model, consistent in space or over time. The study concludes that the gravity model may serve only as a coarse predictor of disease expansion over time. By extension, this raises similar questions about other models in which homogeneity between populations or network of populations is assumed.
Key words: Gravity model, H1N1influenza, regression, spatial epidemiology.
In February, 2020, the Wellcome Trust (2020) called for a program of universal data sharing as COVID-19 expanded from a local to a regional epidemic and then became a global pandemic. In response, a series of publicly available, continuously updated “dashboards” providing real-time, continuously updated data on viral incidence were developed. These included both global surveillance programs like the Johns Hopkins University dashboard (https://coronavirus.jhu.edu/map.html) as well as more dedicated, national or provincial data sites, (for example, https://resources-covid19canada.hub.arcgis. com/). Whatever the scale or resolution all included maps of viral incidence as well as the underlying data used in their construction. The result has been an avalanche of data requiring analysis. To that end, various mathematical models have been available to researchers (Kraemer et al., 2019a). Some are based on analogies to physical laws including, in a partial list, the gravity model, another based on radiation diffusion (Simini et al., 2012), and, more recently, a third based on Ohm's 1827 law of electricity (Sallah et al., 2017). Others employ network analytics similar to those used in transportation studies. Finally, some analogize epidemic and pandemic dynamics through reference to natural phenomena like like ocean waves (Cliff and Haggett, 2006) and forest fires (Koch, 2016).
Irrespective of the precise methods of analysis, most are “share models” in which a specific product (a bacterium or virus) is shared between places (cities, counties, states, etc.) across a commuting or transportation network. All assume, as a class, a general pattern of transfer, constant and regular, that can be mathematically described based on one or another measure of population size and a system of interchange. Different models emphasize the networks (air, rail, or road) connecting population nodes which serve as data points joined at one or another scale (Kraemer et al., 2019b). What has become increasingly clear, during the current pandemic, is the failure of contemporary models to predict disease spread in a way that will permit regional health planners to anticipate an epidemic outbreak. Thus in the spring of 2020 most assumed Covid-19’s Alpha variant would expand from Michigan and Minnesota, where outbreaks were severe, and then progress across the mid-west. Instead, the disease barely spread to nearby Iowa or Ohio, dying out despite clear transportation and commuter ties. Similar discontinuities were observed in previous epidemics of, for example West Nile Virus (Koch and Denike, 2007) and 2009 H1N1 Influenza (Koch, 2021).
As Cota et al. recently noted, the unprecedented volume of digital data now available requires we “revisit epidemic models, in particular those studying the geographical spread of pathogens leveraging the mobility of hosts” (Cota et al., 2021). Here we take up that challenge through a focus on the Gravity Model in part because its two variables, population or mass and distance between two bodies, are central to many later models. The hope is that the result will both explain the strengths or limits of the approach and, by extension our knowledge of disease modeling. The goal in all this is the ability to plan for epidemic events in specific health jurisdictions. Our approach is two-fold. First, the history of the model and the manner in which it remains widely used in epidemiology and other fields is reviewed. The ubiquity of its basic principles of mass and distance are then noted as characteristics in all share models. Following this we employ the model to consider the utility of its individual elements in a study of the first months of the 2009 Type-A influenza pandemic in the United States. This approach was limited to assure a useful and clear understanding of the merits of the individual components of the model. Alternately, variations of the model, or of different models, might have been applied to the same dataset. However, the question here is not whether one model may be better than another but rather the general structure of the attributes of most share models in which the implicit assumption is one of a homogeneous stability of disease transfer, spatially and temporally, between different nodes within a system. We end by nothing another fundamental limit to this class of models: Where heterogeneity exists, the transfer process and thus the predictive value of the model may break down (Hanes and Fotheringham, 1990). Increasingly, heterogeneity is seen at the local and regional level where specific congregate locations (assisted living and nursing homes, jails or prisons, manufacturing facilities, schools, etc.) create local ‘hot spots’ affecting the rate and intensity of disease expansion.
Gravity model: a history
Rooted in Newton's law of universal gravity, the gravity model is the oldest and best known of this class of models. Perhaps its best known applications are in economic (Anderson, 2010; Mele and Baistrocchi 2012) and transportation studies (Taaffe and Gauthier, 1973, Chapt. 3). It has also has seen heavy use in modern epidemiology and disease studies (Balcan et al., 2009). For epidemiologists, the focus has been upon disease transfer and subsequent expansion in presumably stable populations and across human travel and cargo networks (Kraemer et al., 2019b). Specific applications have included, in a partial list: the 2009 Type A H1N1 pandemic (Balcan et al., 2009; Viboud et al., 2006); Ebola in 2014 (Dudas et al., 2017), measles (Xia et al., 2004), and Zika virus. Importantly, the model’s use of both population size and relative distance, variously defined, are common elements of most models of disease dynamics. In its earliest formulation, Newton's Law described an attractive force between two bodies of different mass based on the distance separating them. Attraction was greatest between larger bodies closer to each other. This was, perhaps, the first expression of what Waldo Tobler famously called the First law of Geography: “Everything is related to everything else, but near things are more related than distant things (Tobler, 1970). In the nineteenth century Ravenstein (1885) used Newton’s law to formulate his "laws of migration" substituting the sum of two populations for that of two planetary masses to be divided by the Euclidian distance separating them. Zipf (1946) applied the model to urban population flows. In recent years, the basic algorithm has been used to analyze everything from cargo shipping patterns (Kaluza et al., 2010) to the inter-city volume of telephone traffic (Krings et al., 2009).
Over the years, a series of modifying additions have been required to fit the algorithm ex post facto to specific problems. Since Ziff, for example, a constant typically has been included as a multiplier. In transport analysis, a friction measure may be employed to reflect relative ease of travel in the divisor: Friction (and thus travel time) is greater between places joined by country roads than a highway, for example. In other applications, a population numerator may be modified to reflect general welfare or attractiveness; in retail analysis a numerator might reflect relative income levels to further distinguish populations.
Gravity model: limits
Various researchers have described a range of practical and theoretical model limits to the model's use. First, it lacks a firm theoretical rationale beyond the analogy to Newton's classical planetary formulation (Taaffe and Gauthier, 1973, 97-98). If it works, therefore, the question becomes how, and why. Second, as a deterministic algorithm it does not easily handle a range of observed variations at different scales of address over time. Third, its application may require a series of deterrence functions for it to be fitted successfully to this or that problem dataset (Simini et al., 2012). Fourth, neither its basic population product numerator nor a simple distance denominator are necessarily adequate, easily defined descriptors (Taaffe et al., 1996, 229). Finally, the model assumes homogeneity between population bodies of various sizes.
In disease studies, the analog typically substitutes population size for planetary mass. But while the latter is a precisely quantifiable constant, urban populations are dynamic in nature. On any day commuter traffic may double the population of a large city, reducing that of smaller communities by an equal amount (Badger 2013). As importantly, urban boundaries by which populations are defined are elastic and often defined using different standards (Duncan et al., 1961). For example, the 2010 U.S. Census recorded the population of Santa Clara, CA, as 945,942 persons while its metropolitan population was reported as 1,781,642 persons. Disease incidence reported in the two different jurisdictions were 28 and 337 persons respectively in the first months of the 2009 H1N1 epidemic (Healthmap.org). Finally, as the center of a census-designated Combined Statistical Area (CSA) Santa Clara's population was over 8 million. The latter reflects, albeit loosely, what some describe as the appropriate analytic scale of a modern "megapopulation" defined by expansive, interurban exchange patterns (Nelson and Rae, 2016). Unfortunately, there is no agreement as to which urban definition is best suited to disease studies. Worse, it is typically unclear in disease-incidence datasets the urban definition (city, urban, metro, or regional) in which disease incidence is reported. Some appear indiscriminately to mix city, urban or metropolitan data in their reportage of an outbreak. For this study metropolitan census data was employed for the sake of consistency.
Finally, simple measures of Euclidian distance between urban places, however they are defined, may be insufficient as measures of interaction between population bodies. Distance also may be defined by density of air travel, cargo ship routes, or local commuter pathways in multi-scale urban networks (Balcan and Vespignani 2012). Various researchers have employed cell phone traffic (Exper et al., 2011) or currency circulation as measures of connectivity and distance between places.
Influenza 2009
In our consideration of the utility of the gravity model we employ a dataset describing the H1N1 Type-A influenza pandemic beginning in 2009 in Mexico City. While data on the current pandemic is extensive it is, unlike that of the earlier pandemic, constantly evolving. Furthermore, different regions have different systems of reportage and employ different standards of testing. This makes comparisons difficult. An avalanche of primary research papers using available data, over 17,559 articles published between January and June 20, 2020, has resulted in an unprecedented number of journal retractions of published articles (Yeo-Teh and Tang, 2020).
Data on the 2009 global pandemic, however, has been firmly established (CDC, 2009; Fraser et al., 2009). A novel Type-A (H1N1) influenza virus originating near Mexico City, data on its expansion was broadly reported by both formal (CDC, WHO, PAHO, etc.) and informal (news reports) sources (Brownstein et al. 2010). Despite early reports of high mortality, the case fatality ratio was approximately 0.4 percent (range: 0.3-1.8 percent). The reproduction number (Ro), the number of additional cases one case generates over the course of its infectious period, was 1.46, only slightly higher than that for seasonal flu, for the first wave of the pandemic ending in August, and 1.48 for the second wave (Biggerstaff et al. 2014). Finally, the incubation rate for this virus was between 2 and 10 days with a mean of six days with the infectious period for those affected determined as being between 4 and 7 days.
Data
A Harvard University-based research group, Healthmap.org, provides an automated capture network for formal (World Health Organization, the U.S. Centers for Disease Control, for example) and informal data on various infectious diseases (healthmap.org, 2018). The later, typically news stories, usually report the findings of the official organizations. In this syndromic capture system, each row entry includes a location (city, county, and/or country), its location (latitude and longitude) and a data source (typically a URL). For each the number of cases reported or suspected, is then included. Of healthmap.org’s multi-year, influenza dataset (2008-2012), 28,866 entries referred to the first wave of the H1N1 global pandemic occurring between April 1 and August 31, 2009 in the United States. To streamline the database locations reporting only one or two "wild" cases" that did not trigger greater epidemic activity were excluded. Similarly excluded, to prevent double counting, were outbreaks reported in prisons, summer camps or schools located in cities or counties that also reported H1N1 influenza outbreaks. The result of this winnowing and consolidation was a set of 87 U.S. locations each with more than 10 confirmed cases in populations—city or county—over 250,000 persons in the first phase of the epidemic.
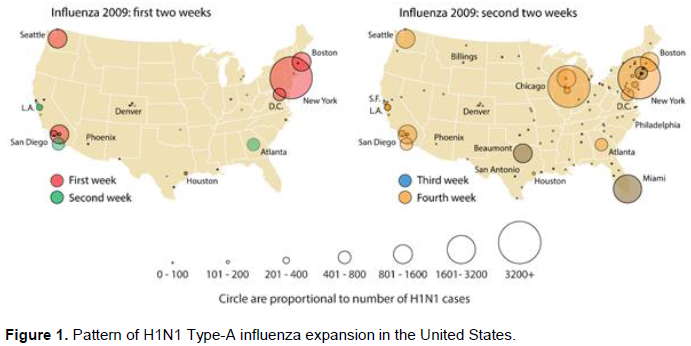
Based on this dataset, Figure 1 describes the general, spatial expansion of the pandemic in its first weeks. In the first six days of May, 2009, significant epidemic events began in Boston, New York, and Washington in the eastern U.S.; Los Angeles and adjacent San Bernardino County in Southern California; Sacramento in Northern California; Houston in Texas, and Seattle in the northwest. Of these sites only New York City reported confirmed cases in the last week of April, 2009 as the first wave of infection peaked in Mexico City.

Figure 1 Maps the May 2009 pattern of H1N1 Type-A influenza expansion in the continental United States during the first month of what became a national epidemic. All these mapped locations shared US Census-reported populations of greater than 3.8 million persons and a residential density of at least 1,150 persons per square kilometer (https://www.census.gov/quickfacts/). All were directly or indirectly connected to Mexico City by between two and 12 direct and at least sixty, one-stop indirect flights. Data on connections was observed for May 4, 2018 from the website Expedia.com. Because historical flight data was unavailable, the assumption was made that flight schedules between Mexico City and continental U.S. cities in 2018 reflected similar travel patterns during the earlier epidemic period.
In the second week new outbreaks were reported in San Diego, CA; Atlanta, GA; Detroit, MI; and Arapahoe County near Denver, CO. In addition, outbreaks in the Northern and Southern California areas expanded to nearby cities. In the third week, further outbreaks appeared in Miami, FL, Dallas, TX, New Orleans, LA, and along the northeast corridor. By the end of the fourth week, major outbreaks were reported in Chicago, IL, and Milwaukee, WI. In addition, smaller outbreaks were reported in an increasing number of smaller communities elsewhere across the United States. As the epidemic continued an every larger number of communities reported influenza cases; in larger cities a second wave of infection after August 29.
Analysis
Others have used two different distant measures in gravity-based simulation models of the 2009 influenza epidemic (Balcan et al., 2009). The first was a long-distance transfer function based on airline traffic data, the second used local or regional commuter flows. To these were added in both cases a power law function modifying distance parameters as well as proportionality constants for populations joined in a multiscale network. An attempt at redefining distance at two scales and with two travel modes in a stochastic model suffered from several limits.
First, a focus on airline network travel data to major cities made difficult any clear understanding of semi-independent or independent transfer processes between primary centers (Boston, NYC, Washington, for example) and secondary locations (from New York City to Buffalo, NY, for example). Second, there was no acknowledgment of the different ways city populations are defined (were these local, metropolitan or regional population figures?). Third, there was no consideration of the potential for disease transfer by land travel across borders, especially in those states boarding Mexico where volumes of commuter and commercial exchange were likely to have been a source of viral transfer. To consider the utility of the gravity model we created a database of target city populations and their distance from Mexico City. As a first step, we then assessed a determination of fit by transforming the gravity model to a linear form and then calibrated its variables (population and distance) through a multivariate linear regression applying a natural logarithmic transformation.
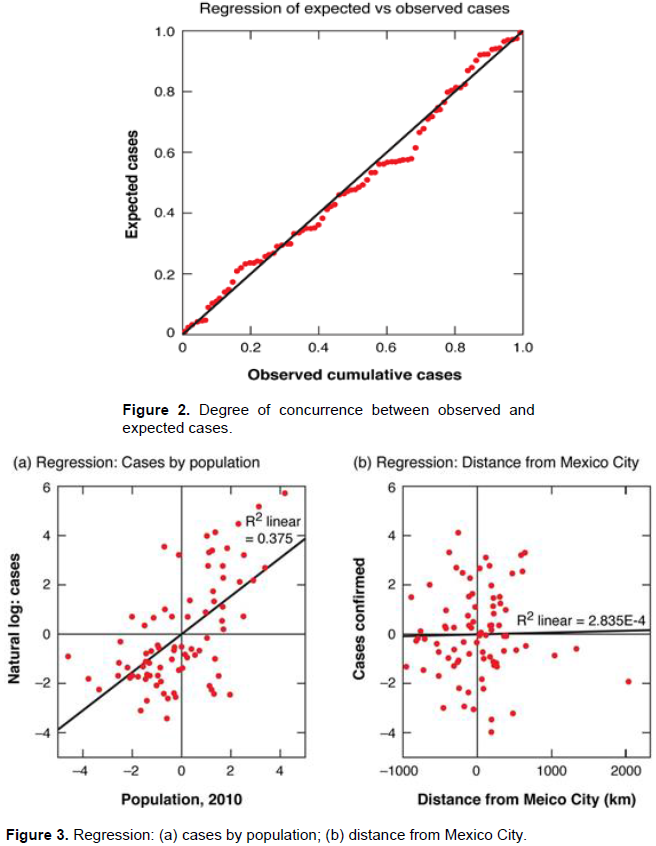
To test the applicability of a multifactorial regression in this program we applied a Durbin-Watson test resulting in a very robust 1.985 result, admirably close to the accepted benchmark for larger data sets. This indicated that autocorrelation (also called serial correlation), often a confounding issue in spatial analysis, was not a concern. The resulting normal distribution of residuals returned an Analysis of Variance very significant at the .000 level. Finally, Model R (.612) and the adjusted R Square of .375 were better than reasonable first approximations of viral transmission.
Figure 2 shows the high degree of concurrence between observed and expected cases resulting from a log natural linear regression based on the components of the gravity model. Cases were those reported by helathmap.org in the early weeks of the American epidemic. We then sought to test the effect of each independent variable on the pattern of disease transmission by fitting a linear regression line to a partial regression plot for each. If the model was to be useful, we reasoned, the variables would individually serve as at least partial explicators of disease transmission. The partial regression plots for the dependent variables revealed, however, that only metropolitan population was relevant independent. Distance from Mexico City was surprisingly irrelevant as a single explanatory element in the epidemic's progression. This can be seen in Figures 3a and 3b where regression lines were fitted to each of these variables. In the first, a R2 linear fit of 0.375 indicated population size was a generally robust predictor of disease incidence. In contrast the slope of R2 linear slope of 2.835 in Figure 3b suggests distance from Mexico City was a largely inconsequential and thus confounding variable. That was critical if one assumes distance reflects a measure by which transfer occurs through population exchange. In Figure 3a high degree of concurrence is shown between population size and a natural log of cases while, in Figure 3a, no such relationship exists for distance of target cities from the origin spot of the epidemic.
Heterogeneity
Since Euclidian distance was an unreliable divisor we considered substituting air travel links between the origin site, Mexico City, and U.S. population centers. Others have reported major international cities receiving more than 1400 passengers from Mexico City during the earliest stages of the epidemic were at markedly increased risk of H1N1 transfer (Khan et al., 2009). Given an average Boeing 767 airplane at full capacity of 240 international passengers this would be six planes a day. Passenger volumes did not, however, serve as a simple distance substitute. In the first week in the US the number of direct flights from Mexico included: Boston, MA (2 Flights), Houston (11 flights), Los Angeles, (16 flights), New York City (12 flights), San Francisco/San Bernardino (11 flights), Seattle, WA (7 flights), and Washington, DC (3 flights). Significant but smaller cities with six or more direct flights daily first reported viral activity in the second week: Chicago, IL (6 flights), Atlanta, GA, (10 flights), and Dallas, TX (11 flights). And yet, Miami FL, (2010 pop. 5.56 million persons) did not report an early outbreak despite both relative geographic proximity and the frequency of direct flights from Mexico City (14). As the epidemic expanded, it included cities and towns with increasingly tenuous air connections either to Mexico City or principal U.S. foci (NYC, LA, etc.). Similarly, while urban population was a useful general predictor it was in itself insufficient to explain fully the pattern of disease expansion. For example, Boston, MA and Atlanta, GA are comparably sized, metropolitan cities. US Census data reported Boston’s 2010 population as 692,600 persons and Atlanta’s as 420,003 persons. Metropolitan populations reported were far higher, of course with 4,628,910 persons reported resident in metropolitan Boston and 6,020,964 in Atlanta. And yet, the outbreak began earlier in the former than the latter despite its far greater distance from Mexico City (3,670 miles vs. 1,792 miles).
Here the problem of heterogeneity among locations became critical. It is possible that the introduction of influenza to Boston resulted less from an influx of infected travelers from Mexico than commuting and travel volumes between it and New York City. Similarly, commuter travel volumes between New York City/Boston and Washington, DC. (Pop. 5.6 million in 2010), may better describe the latter's early epidemic onset than either travel volume from Mexico or metropolitan size alone. The early introduction of H1N1 influenza to Seattle, WA, with a city population in 2010 of 608,660 persons, is not easily explained with reference either to population size or the limited number of direct daily flights from Mexico. Airline intercourse with Los Angeles and San Francisco may have been a factor, however. But of greater importance may have been that May is the month in which many of Washington State's estimated 185,000 seasonal workers, primarily Mexican and Central American, arrive through Seattle to work in the state's agriculture industry. This would have increased the inflow of potentially infected if still asymptomatic persons who, working and living in a high density environment, likely would have accelerated viral activity.
In the same vein, the delay until the third week for a major outbreak in Miami, FL, seemed problematic. The frequency of daily flights from Mexico City, Miami's relative proximity to Mexico, and the presence of a large Latino population would have argued for an earlier and more virulent epidemic expansion. While its 2010 population was only 399,457 persons, that of Miami-Dade County was far higher (2,498,018 persons). However, South Florida's Spanish-speaking population is largely Puerto Rican and Cuban, not Mexican or Central American. It is therefore probable that direct flight passengers from Mexico used Miami not as a destination but a brief, first stop in travel to other locations.
What appears to have emerged was a kind of nested hierarchy (Balcan and Vespignani, 2012); in which H1N1 expansion began in a small set of international cities hosting frequent air travel from Mexico City. These cities became independent or semi-independent foci for epidemic expansion to secondary and then tertiary cities with few if any links to the origin site. This expansion occurred across secondary exchange networks among relatively proximate, and later, more distant metropolitan centers in the US. Population size appeared to be an at best coarse descriptor of attraction. The result was not one of a consistent attraction but one resulting, at least in part, from local characteristics and circumstances. These include, for example, the dynamic effect of commuting traffic on the size of a city population. For example, New York City’s resident population doubles in size on a normal workday as suburban workers enter the city (Badger, 2013). The populations of commuters’ home cities decreased by a similar amount. Population itself thus becomes a dynamic variable, not a constant. In addition, within each city the likelihood of viral expansion was dependent not only on size, and transmission by commuters or travelers, but the presence or absence of congregate locations (jails, manufacturing plants, schools, summer camps, military bases, etc.) in which once introduced a respiratory virus might spread. This was evident in a study of the 2009 H1N1-Type Influenza database employed in this study (Koch, 2020, 8) and, again, in the expansion of Covid-19 in 2020-2021. Thus, the national expansion of H1N1 influenza resulted from not one gravitational process but a series of distinct if related dynamics, including population and exchange patterns, involving a broad set of heterogeneous places. Perhaps the best analogy is hydrologic in which waterways are ordered in z hierarchical design frame in which data independence for each place is not assumed. Refining that observation and applying a hydrologic perspective to disease expansion will be the subject of a future report.
This is not to argue the gravity model should be abandoned. "Attraction" remains a powerful and useful concept. Care must be taken, however, in defining the populations of related urban populations employed in its calculations. Further, the nature of cargo, commuting, and other travel networks linking populations of different sizes and at different distances provides a complex mix of interactive volumes any (or all) of which may affect the date and rate of bacterial or viral introduction and potential expansion. One simply cannot assume that homogeneity exists among various populations at all scales, or that all places within a network are equal. Nor will a single measure of distance or connectivity (work flow, for example) necessarily serve as a simple measure. It is thus unlikely that a single algorithm will fully describe or predict disease expansion within a nation or at a different scale its individual regions. There is therefore an obvious need for further research both based on heterogeneity and the specifics of resident populations and the means by which this or other models, with different variables, might better serve to predict patterns of disease expansion. The next stage in this study for us will be to examine the manner in which this virus was transferred over time between primary foci, NYC, Boston, Los Angeles, and heterogeneous secondary exurban and suburban populations. The goal will be to more precisely define the appropriate scale of analysis as either urban, metropolitan or region, and to consider the extent to which local differences affected the rate of disease expansion and the severity of an epidemic event.
The authors have not declared any conflict of interests.
REFERENCES
|
Anderson JE (2010). The gravity model: NBER Working Paper No. 16576. Cambridge, MA: National Bureau of Economic Research.
Crossref
|
|
|
|
Badger E (2013). The most important population statistic that hardly ever gets talked about. The Atlantic, CityLab.
|
|
|
|
|
Balcan D, Colizza V, Gonçalves B, Hu H, Ramasco JJ, Vespignani A (2009). Multiscale mobility networks and the spatial spreading of infectious diseases. Proceedings of the National Academy of Sciences 106(51):21484-21489.
Crossref
|
|
|
|
|
Balcan D, Vespignani A (2012). Invasion threshold in structured populations with recurrent mobility patterns. Journal of Theoretical Biology 293:87-100.
Crossref
|
|
|
|
|
Biggerstaff M, Cauchemez S, Reed C, Gambrhir E, Finelli L (2014). Estimates of the reproduction number for seasonal, pandemic, and zoonotic influenza: a systematic review of the literature. BMC Infectious Diseases 14(1):1-20.
Crossref
|
|
|
|
|
Brownstein JS, Freifeld CC, Chan EH, Keller M, Sonricker AL, Mekaru SR, Buckeridge DL (2010). Information Technology and Global Surveillance of Cases of 2009 H1N1 Influenza. New England Journal of Medicine 362(18):1731-1735.
Crossref
|
|
|
|
|
CDC (2009). Update: novel influenza A (H1N1) virus infection-Mexico, March-May, 2009. MMWR Morbidity Mortality Weekly 58(21):585-589.
|
|
|
|
|
Cliff AD, Haggett P (2006). A swash-backwash model of the single epidemic wave. Journal of Geographical Systems 8(3):227-252.
Crossref
|
|
|
|
|
Cota W, Soriano D, Arenas A, Ferreira S, Gomez-Gardenes J (2021). Infectious disease dynamics in metapopulations with heterogeneous transmission and recurrent mobility. New Journal of Physics.
Crossref
|
|
|
|
|
Dudas G, Carvalho LM, Bedford T, Tatem AJ, Baele G, Faria NR, Park DJ, Ladner JT, Arias A, Asogun D, Bielejec F (2017). Virus genomes reveal factors that spread and sustained the Ebola epidemic. Nature 544(7650):309-315.
|
|
|
|
|
Duncan OD, Ray PC, Beverly D (1961). Statistical geography: Problems in analyzing areal data. Statistical geography: Problems in analyzing areal data.
|
|
|
|
|
Exper P, Evans T, Blondel V, Lambiotte R (2011). Uncovering space independent communities in spatial networks. Proceedings of the National Academy of Sciences 108(19):7663-7668.
Crossref
|
|
|
|
|
Fraser C, Donnelly CA, Cauchemez S, Hanage WP, Van Kerkhove MD, Hollingsworth TD, Griffin J, Baggaley RF, Jenkins HE, Lyons EJ, Jombart T (2009). Pandemic potential of a strain of influenza A (H1N1): early findings. Science 324(5934):1557-1561.
Crossref
|
|
|
|
|
Hanes KE, Fotheringham A (1990). The Impact of space on the application of discrete choice models. Review of Regional Studies 20(2):39-49.
Crossref
|
|
|
|
|
Kaluza P, Kölzsch A, Gastner MT, Blasius B (2010). The complex network of global cargo ship movements. Journal of the Royal Society Interface 7(48):1093-1103.
Crossref
|
|
|
|
|
Khan K, Arino J, Hu W, Raposo P, Sears J, Calderon F, Heidebrecht C, Macdonald M, Liauw J, Chan A, Gardam M (2009). Spread of a Novel Influenza A (H1N1) Virus via Global Airline Transportation. New England Journal of Medicine 361(2):212-214.
Crossref
|
|
|
|
|
Koch T (2016). Fighting disease, like fighting fires: The lessons Ebola teaches. The Canadian Geographer 60(3):288-299.
Crossref
|
|
|
|
|
Koch T (2018). Populations, Megapopulations, and the Areal Unit Problem. Health and Place 54:79-84.
Crossref
|
|
|
|
|
Koch T (2020). Reviewing the Quality of "Big Data" in automatic data systems: An Example. Medical Research Archives. 8:9.
Crossref
|
|
|
|
|
Koch T (2021). Viral geographies: Megaregions as extra?urban disease catchments. The Canadian Geographer/Le Géographe canadien.
Crossref
|
|
|
|
|
Koch T, Denike K (2007). Certainty, uncertainty, and the spatiality of Disease: A West Nile Virus example. Stochastic Environment Research and Risk Assessment 21:523-531.
Crossref
|
|
|
|
|
Kraemer MU, Cummings DA, Funk S, Reiner RC, Faria NR, Pybus OG, Cauchemez S (2019a). Reconstruction and prediction of viral disease epidemics. Epidemiology and Infection 147:e34:1-7.
Crossref
|
|
|
|
|
Kraemer MU, Golding N, Bisanzio D, Bhatt S, Pigott DM, Ray SE, Brady OJ, Brownstein JS, Faria NR, Cummings DA, Pybus OG (2019b). Utilizing general human movement models to predict the spread of emerging infectious diseases in resource poor settings. Scientific Reports 9(1):1-11.
Crossref
|
|
|
|
|
Krings G, Calabrese F, Ratti C, Blondel VD (2009). Urban gravity: a model for inter-city telecommunication flows. Journal of Statistical Mechanics: Theory and Experiment 7:L07003.
Crossref
|
|
|
|
|
Yeo-Teh NSL, Tang BL (2021). An alarming retraction rate for scientific publications on Coronavirus Disease 2019 (COVID-19). Accountability in Research 28(1):47-53.
Crossref
|
|
|
|
|
Mele M, Baistrocchi PA (2012). A critique of the gravitational model in estimating the determinants of trade flows. International Journal of Business and Commerce 2(1):13-23.
|
|
|
|
|
Nelson GD, Rae A (2016). An Economic Geography of the United States: From Commutes to Megaregions. PLOS One 11(11):e0166083.
Crossref
|
|
|
|
|
Ravenstein EG (1885). The laws of migration. Journal of the Statistical Society of London 48(2):167-235.
Crossref
|
|
|
|
|
Sallah K, Giorgi R, Bengtsson L, Lu X, Wetter E, Adrien P, Rebaudet S, Piarroux R, Gaudart J (2017). Mathematical models for predicting human mobility in the context of infectious disease spread: introducing the impedance model. International Journal of Health Geographics 16(1):1-11.
Crossref
|
|
|
|
|
Simini F, Gonzalez MC, Maritan A, Barabasi LA (2012). A universal model for mobility and migration patterns. Nature 484(7392):96-100.
Crossref
|
|
|
|
|
Taaffe EJ, Gauthier HL (1973). Geography of Transportation. Englewood Cliffs, N.J.: Prentice Hall, 1973. Available at:
View
|
|
|
|
|
Taaffe EJ, Gauthier HL, O'Kelly ME (1996). Geography of Transportation.
|
|
|
|
|
Tobler WR (1970). A computer movie simulating urban growth in the Detroit region. Economic Geography 46(sup1):234-240.
Crossref
|
|
|
|
|
Viboud C, Bjørnstad ON, Smith DL, Simonsen L, Miller MA, Grenfell BT (2006). Synchrony, waves, and spatial hierarchies in the spread of influenza. Science 312(5772):447-451.
Crossref
|
|
|
|
|
Wellcome Trust (2020). Sharing research data and findings relevant to the novel coronavirus (COVID-19) outbreak. Available Available at:
View
|
|
|
|
|
Xia Y, Bjørnstad ON, Grenfell BT (2004). Measles metapopulation dynamics: a gravity model for epidemiological coupling and dynamics. The American Naturalist 164(2):267-281.
Crossref
|
|
|
|
|
Zipf GK (1946). The P 1 P 2/D hypothesis: on the intercity movement of persons. American Sociological Review 11(6):677-686.
Crossref
|
|