The prevalence of private car for commuting in the Federal Capital Territory (FCT), Abuja is of concern to transport policy makers and planners because of its negative consequences on both physical and socio-economic environments. This study therefore investigates commuters’ access to public transport using four key indicators (public transport fare, service frequency, walking distance to access points and waiting time at public transport terminals/bus stops). Relevant data were collected from the public transport operators and commuters using a combination of interview, questionnaire and GPS (Garmin 62x), the data collected were analysed and manipulated on Geographic Information System (GIS) Arc-GIS 9.3 environment to show areas with equal mean values of waiting time, transport fare, bus service frequency and distance to public transport access points. The results showed that Gwagwalada and Zuba axis with 58 mean bus frequency per day, average 109 metres to public transport access points, about 20 min mean waiting time in the park and N158 mean transport fare per tip has the best access to public transport in FCT but still fell short of best practices. The study recommended a redesign of public transport routes, bus stops and terminals across the FCT that will reflect its current physical development pattern, while stakeholders should stepped-up efforts to provide enough and affordable public transport services.
Transport needs of major cities in Nigeria now present significant challenges for policy makers as the unpredictable shift in population dynamics in response to the need for employment, housing and sustenance continues. The expansion of cities in Nigeria coupled with increasing urban population result in greater demand for transport provision. This demand however, has not always been met and effort to provide adequate transport infrastructural facilities are ad-hoc, uncoordinated and poor (Aderamo, 2010). Access to public transport has the potential of extending transport services to greater proportion of urban residents who do not have private cars and cannot afford exorbitant taxi fares (Andeleeb et al., 2007). It has the potential of being used as a policy tool to reduce the number of cars on urban roads and by implication reduce traffic congestion in the city.
The basic function of urban transport is to link residents and employment as well as producer and users of goods and services. The demand for public transport in most Nigerian cities is very high. This is due in part to the fact that a large proportion of urban residents are low-income earners who cannot afford personal vehicles. On the other hand, available means of public transport are very few and limited especially when compared with what obtains in developed countries of Europe and America where trains are used for intra and inter urban movement as part of an integrated urban transport system (Sumaila, 2012). A good and efficient public transport system is the one which enables commuters to travel where they want, when they want and at the price they can afford. Achieving this can be done through the development of a multi-modal transport system which provides a variety of public transport services to suit a wide range of individual needs.
Public transport service access level is defined as the overall measured or perceived performance of the public transport system from the commuters’ point of view (Hay, 1977). It is used to denote the ease of getting to and quality of service derived from the operational characteristics of transportation facilities (Papacostas and Prevedouros, 2008). Public transport service accessibility indicators which include but not limited to bus service frequency, distance to access points public transport fare, transport time, bus service reliability and comfort reflect two important aspects of transport service: first, the degree to which transport service is available to a given location and secondly, the comfort and convenience of the service provided to commuters (Papacostas and Prevedouros, 2008). For any public transport service to be accessible within the framework of a viable public transport planning system, the indices mentioned earlier must be considered. These indices differ from both traditional highway service quality measures which are more vehicle-oriented than person-oriented. For any meaningful transportation planning, these indices within the framework of the geographical context must be integrated in the transportation planning system. This study therefore, examines the pattern of public transport access level in the Federal Capital Territory (FCT), Abuja-Nigeria.
Cities across the world are in a state of rapid transition, the inability and sustainability of these cities are intrinsically interwoven with not only the degree of efficiency and effectiveness with which existing transport capacity is managed but also how well intermediate and future transportation plans and programme are articulated, laid out and implemented in order to meet the needs of the people (Adesanya, 2011).
The spatial structure of cities especially in developing countries is highly varied and complex, some areas are adequately provided with services and facilities which in other area are grossly inadequate. The variation in the spatial structure results in different socio-economic characteristics of urban dwellers with strong challenges of getting equal and efficient urban service for the disadvantaged. The quality of life in most cities is poor and closely related to accessibility to alternative employment, education and medical facilities, essential public services and nature of recreational open spaces (Vasconcellos, 2011).
Generally, car ownership in Nigeria is low in the cities; there is an average of 4 cars per 100 populations which translates to about 0.04 car owned per person (Adesanya, 2011). With such relatively low level of car ownership the cities experience so much congestion with public transport. However, the situation is different in some countries; the levels of car ownership are 0.831
% in Brazil, 0.8
% in Argentina, 0.825
% in South Africa and 0.683
% in India. If vehicle growth will be twice the growth of income there will be a greater necessity for protective measures for traffic management in Nigerian cities (
Ogwude, 2011).
A comparison of government and private operation of public transport operations in Nigeria shows that the state, and local government public transport is more organized while private sector operators are largely unorganized. Private sector operators rely mainly on revenue and financial support from informal sector such as friends, relative. Government – owned public transport have better trained staff and maintenance facilities than most of the private sector operators; their service are often provided on fixed routes and are relatively cheaper that those provided by private sector operators. Government owned public transport operator also have service schedules, but in practice are rarely followed because of the inadequacies of vehicle, declining fleet utilization rates, growing competition with private and para-transit operators, poor traffic management, congestion especially during peak travel periods and other problems associated with the operating environment (Umar 2003). Estimate of transport demands in metropolitan Lagos in the 1990 range from 7 to 10 million passenger trips daily out of which over 95% are undertaken by road, primarily by car bus and taxi (Mabogunje, 2008).
In a study of public transport in Nigeria, the World Bank (2001) and Adetunji (2000) reported that taxis and private vehicles carrying fare paying passengers represent 53% of the public transport trips, while 30% made use of motorcycles. In many cities in developing countries, motorcycles account for about 90% of feeders’ trips to taxis and mini bus terminals. Similarly, in a study of the supply of transport infrastructures in Lagos metropolis, Ogunsanya et al. (2004) found that most urban road networks are not only poorly developed with feeder streets, they are grossly inadequate and their inadequacies more often than not forced vehicles to concentrate on the primary roads with serious implications on commuters modal choice and mobility pattern especially along the same urban transport corridors. The World Bank (1997) and Adesanya et al. (2002) affirmed that urban poor in Nigeria pay very high proportion of their income for transport services and spend long period of trekking time, travelling time and waiting for infrequent and unreliable bus service.
The study area
The FCT was created in 1976 in pursuance of the Federal Government’s decision to relocate the Federal Capital of Nigeria from Lagos. Within the
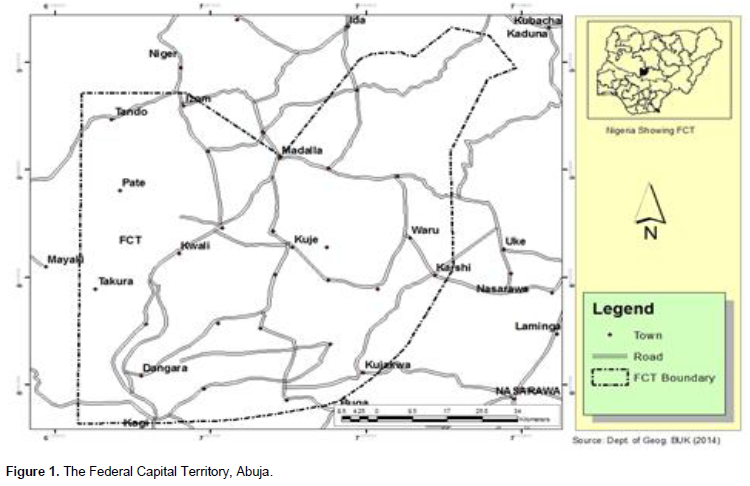
Territory a site was selected, where an entirely new modern city was and is being developed as the new Capital City. With an area of 8,000 square kilometres the territory can be compared in terms of land mass with the states of Rivers, Enugu, Ondo and Osun. While the states of Anambra, Ekiti, Lagos, Imo, Akwa Ibom, Ebonyi and Abia are much smaller in size. As the extensive Territory is not intended to become one of the states of the Federation, it has been conceptualized and operationalized as the administrative Territory of the Country. The FCT- Abuja is centrally located within Nigeria’s geographical space, which makes it equally accessible to all parts of the country.
The population projections and estimates by Doxiadis (
1977) put FCT at 124,678 people in 1977, and rising to about 132,816 at the onset of physical developments in 1980. By 1991, the population of FCT has increased to 378,671 thousand. The Federal Capital Development Authority (FCDA) was established in 1976 to provide platform fo
r administration and the development of transport infrastructure in the city. Today, the FCDA has developed massive transport infrastructure to meet the transport demand of the city. One of the main areas of the transport need of the city is mass transit system that will move the ever increasing city population. The current public transport supply is grossly inadequate which compels most commuters to rely heavily on private automobiles with its attendant consequences on traffic and socio-economic environment of the city (Figure 1).
The method of data collection adopted in this research is questionnaire survey and interview with the operators. The questionnaire was designed to cover the key indicators of public transport accessibility namely: commuters waiting time at terminals, walking time to terminals, public transport service frequency on routes and public transport fare. A total of 950
copies of questionnaires were administered on commuters at 17 major public transport terminals operated by government and private sector.
After removing the defective ones only 872
copies of questionnaires were used for analysis. This figure represents about 5% of the FCT’s commuters. The adoption of 5%sample size for the commuters is justified on two grounds. Firstly, Borg and Gall (1971), suggested a minimum of 5% sample size as being adequate for population of 10,000 above and minimum of 10% for population of 5000 and below, especially where the population of studies is homogenous as it is the case with the FCT commuters. Secondly, the need to reduce the likelihood of double sampling of either the commuters or the operators, bearing in mind that they both could make multiple trips between and along a route within and between days of the months which the survey lasted.
A systematic random sampling of one out of every 5 commuters found at each bus terminal was interviewed. The questionnaire survey was carried out
from early morning hours of 7:00 am to 4:00 pm. The survey was done simultaneously at all the 17 major bus terminals with the help of research field assistants who
were recruited for that purpose. The interview was targeted at eliciting information on the operation on the mode of operation and challenges.
Spatial variation of public transport access level
A major source of public transport supply variability which invariably affects its level of access by commuters’ is the frequency of public transport bus service, walking time to bus stops, waiting time at bus stop and public transport fare (Jone
s, 2004). These four key variables were used to delineate the spatial pattern of commuter’s access to public transport in the FCT.
Public transport means service frequency
The regularity of public transport service enhances commuter’s access to it and vice versa. In the context of this work, bus service frequency connotes the number of buses that arrive at the major terminal with the purpose of conveying commuters for movement within FCT. The degree of commuters waiting at terminals is greatly influenced by the regularity and irregularity of public transport arrival at bus stops/ terminals per unit of time.
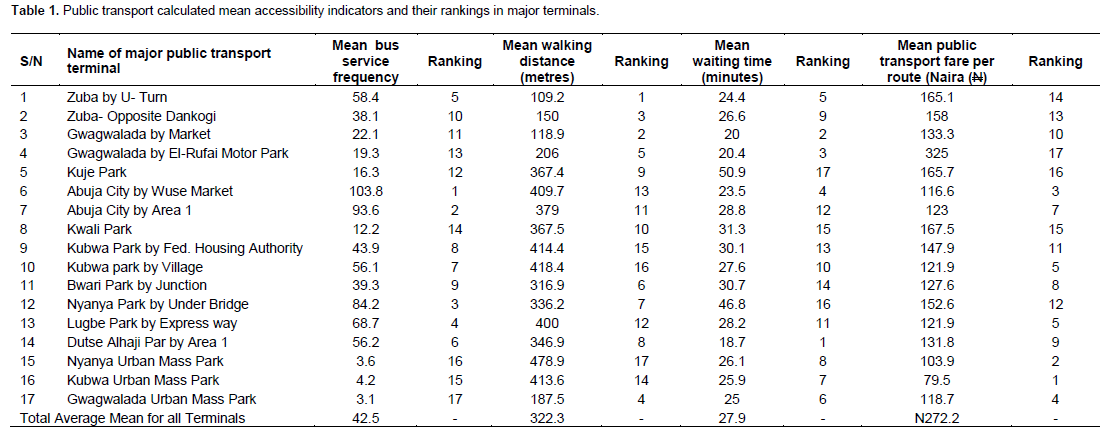
Table 1
present the calculated mean public transport services for the major terminals in the FCT. The mean public transport service frequency calculated for each terminal varied from one terminal to another as depicted in Table 1 and Figure 2. As it can be observed from Figure 2, the bus service frequency
was higher in the city centre and decreases to the city’s periphery. Specifically, Wuse and Garki Area 1 bus terminals
had the highest hourly mean frequency of 103.8 and 93.1 buses respectively (Table 1). This is because, all intra-city public transport coming from the city periphery (that is, Zuba, Gwagwalada, Bwari, Lugbe, Nyanya and Kubwa) empties into them. In terms of real time availability of buses (barring other forms of delay) may infer
better access level to public transport services by commuters.
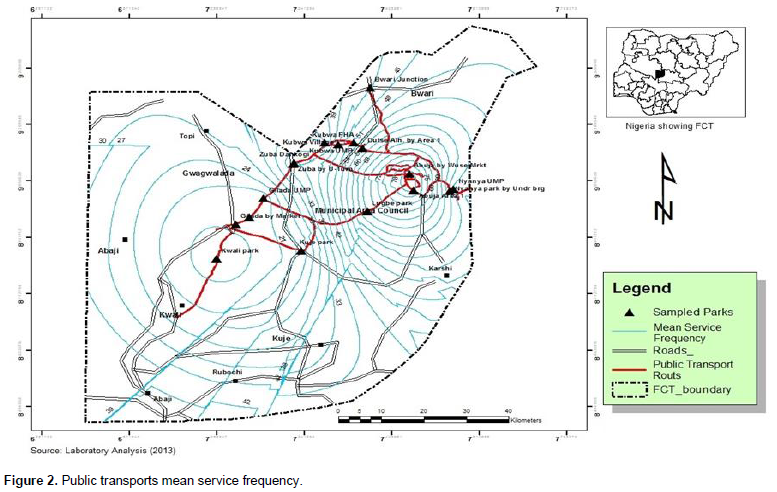
Again, the mean public transport frequency for Nyanya, Lugbe, Zuba and Kubwa with mean hourly frequency of 84.2, 68.7, 58.9 and 56.1 vehicles respectively is relatively high. It is to be noted that these settlements are not only located or served by better road network, they are pockets of densely populated residential zones where large volumes of commuters reside. All things being equal, commuter’s access to public transport here and its adjoining settlements should be moderately high. Kwali, Kuje and Gwagwalada zones have lower mean hourly public transport service frequency, because they are somewhat far from the city centre. Therefore, these areas exhibit low accessibility to public transport buses which the commuters sought for.
Commuters mean walking distance
Commuters walking distance from point of interests at trip origin or destination to service access points at bus stops or terminals remain one of the critical elements that determine commuter’s access to public transport services. Walking distance of a commuter can be defined as the distance a commuter’s walk before reaching the nearest terminal or bus stops from either the trip origin or destination to catch any public transport ride. The extent to which the commuters walk before reaching the nearest terminals depends on the spacing between the adjacent public transport routes and the spacing between the adjacent public transport bus stops/terminals (Jende and Surti, 1976). If the total bus service in a place is spread, commuters walking distance should be short and if the public transport services are concentrated in the route that means long walk by the commuters (Faulk, 1990). The worldwide average commuter’s walking distance recommended by World Bank (2000), ranges from 300-500 metres from dense urban area and 500-100 meters for low dense urban area.
The result of commuters’ average walking distance in all the major terminals of FCT measured in metres is also displayed in Table 1 and Figure 3. It is interesting to note that, the three areas with shorter walking distance to public transport terminals/ bus stops; Zuba-U turn (109.2), Zuba opposite Dankogi (150) and Gwagwalada by market (118.9) lie completely outside the city centre. Wuse market park and Area 1 Garki park (the two major terminals within the city centre have mean walking distance of 409.7 and 379 metres, respectively. The implication of this is that the Wuse market and the Garki Area 1 Park in which the commuters disembarked and embarked in the case of city’s inbound and outbound trips respectively are not the final destination of the commuters, meaning that the commuters later resort to either long trek or other intermediate means of transport to get to their activity location.
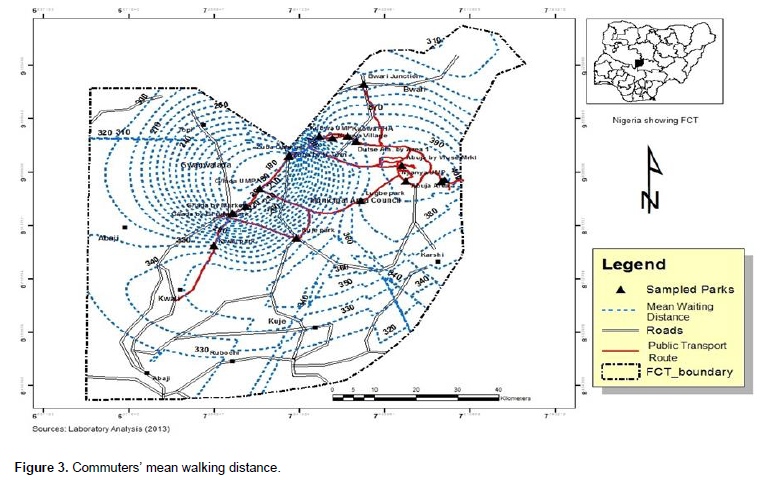
It is important to note that the Central Area and the Three Arm zone in which most government institutions that attract and generate traffic of fixed time work place trip have no major public transport terminals closer. This can then imply that most FCT commuters trek long distance before getting to their nearest bus stops/terminal. One major factor responsible for this, and which was discovered during field survey was the inadequate public transport route traversing the city centre. For instance, Wuse ll, Maitama and Asokoro Districts of the city centre were not adequately covered by the bus route; leaving the commuters around these areas at the mercies of car drops services.
Commuters mean waiting time
Optimum mean waiting time world wide as recommended by the World Bank (2000) otherwise referred to as the bus headway, ranges from 5 to 10 min indicating high quality public transport service access level and the maximum time commuters are expected to wait for the arrival of bus at the terminal/bus stop ranges from11-20 minutes which indicate moderate accessibility. When the commuter waiting time exceeds 20 minutes, it portends poor access level (World
Bank, 2000). Table 1 reveals that within the context of World Bank standard, no single location in FCT has good access level. At best, the Dutse Alhaji, Area 1 and Gwagwalada by market can qualify for moderate access level, because they have mean waiting time of 18.7, 28.8 and 20. 4 min respectively.
The Gwagwalada by El- Rufal (20.4), Zuba by Dankogi (20.6) and Zuba by U- turn with 24.4 min respectively have long waiting time for public transport and by implication poor level of access. Looking at scenarios from Kuje motor park (50.9), Nyanya under bridge (46.8), Kubwa by FHA (28.8 minutes) and Bwari with 30.7 min, it can therefore be concluded that public transport access level and waiting time is poor all through the FCT. This might be one of the disincentives for public transport patronage, and the prevalence of private car use in FCT. Figure 4 further illustrates this finding.
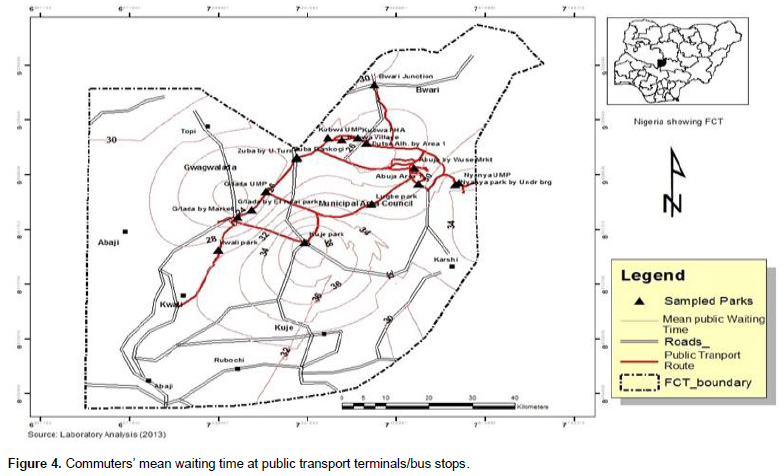
The commuters waiting time at the AUMTCO park at the three principal axis of Nyanya, Kubwa and Gwagwalada is not in any way better as 26.2, 25.2 and 25 min waiting time were recorded against them respectively. Figure 4 presents further graphical illustration. Interviews with the authorities of AUMTCO reveal
ed that though they have a pool of buses that could operate on a standard bus headway of 5 to 10 minutes along all routes, the challenge is the non-availability of commuters to guarantee fully loaded return trip. Thus, it makes no economic sense in running an empty bus service in the name of higher bus frequency to reduce commuters waiting time. It is to be noted that, commuters trip is principally unidirectional- to the city centre in the morning hours and outwards to the periphery during the afternoon and late evening hours. Again, the capacity of road during the rush hours are limited because there is no dedicated lanes for public transport buses, hence
the traffic congestions limit the bus trip frequency.
Mean public transport fare
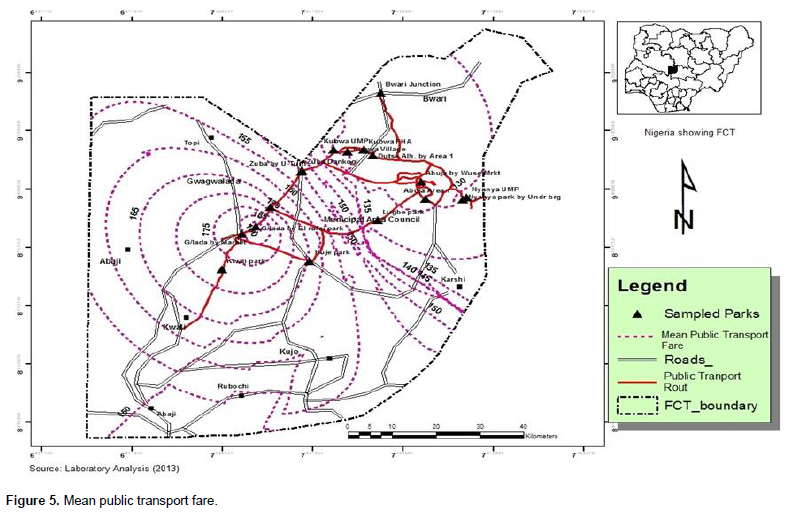
The amount of money a public transport operator charges as fare influenced how commuter’s patronage will be secured. This is because, there is usually a fixed proportion of disposable income that the commuters are willing to attribute to workplace, social and other forms of commuting per unit of time. Odumosu (2004) argued that commuting cost should not be more that 30% of commuters’ disposable income, the lower the public transport fare, the higher the possibility of commuters using the public transport. This argument becomes more rational against the backdrop of the fact that commuting costs on the part of the commuters is the sum total of the monies expended in other (intermediate) means of transport from trip origin to immediate bus stop/terminals (where he/she board the public transport) and from the public transport final bus stop to the commuters final destination. The result of the mean public transport fare in FCT is presented also shown in Table 1.
The result shows that the mean public transport fare in the FCT was at its lowest in AUMTCO parks/ buses; Kubwa (N79.5), Nyanya (N103.9) and Gwagwalada (N118.7). This is because these buses are government owned and are operated by an agency of the Federal Capital Territory Administration called, Abuja Urban Mass transit Company (AUMTCO). They are not solely a profit making outfit, but to provide and efficient transport service to commuters at a subsidized rate. The company enjoys grants and subventions from the Ministry of Federal Capital Territory Administration. With regards to other private public transport operators in FCT, Wuse park within the city centre mean public transport fare is the best with a value of N116.6, this is followed by Kubwa village and Lugbe park which tallied at (N121.9), Abuja city by Area 1 has a mean value of N123 and Bwari park has N127.6 in that order. Mean public transport fare in the FCT has the highest value in Gwagwalada by El-Rufal Motor Park with a mean vale of N325.
Observation at the park during the survey shows that this motor park (Gwagwalada by El-Rufai Motor Park) is operated by a private company outfit, which operates small capacity, green painted air conditioned buses between Gwagwalada and the city centre. Kuje and Zuba by U-turn Motor Park are within the mean value of 165.7 and 165.1 respectively. The public transport fare structure adopted by most operators in FCT is the flat rate structure, indicating same fare from origin to destination payment irrespective of how close or how far the commuters will go before disembarking relative to the bus final terminal or bus stop. Despite this, the public transport operators pick passengers along the way, not minding the fact that the commuters who alighted had paid for the seat till the end of the trip. These practices adopted by the operators contribute to the number of illegal stopping along the trip. The practice also prolong bus trip time, impair commuters comfort and safety- as the buses may likely engage in over loading during rush hour, reduce bus service frequency thereby contributing to public transport supply- demand gap.
The mean public transport fare displayed here also reflect the fact that the distances of each location from the city centre to the suburb has influence on the mean public transport fare, hence Gwagwalada, Kuje and Zuba have higher mean public transport fare values. This therefore implied that physical distance of trip is a major factor considered by operators to arrive at the public transport fare along the route.
This is so, because some vehicle consumables like fuel and maintenance costs, vary directly with the distance covered by the public transport vehicle. The spatial pattern of commuters; mean public transport fare is presented in Figure 5.
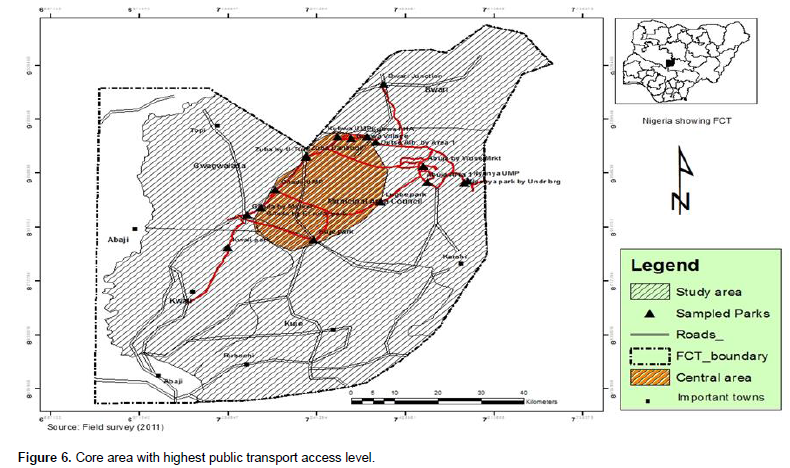
The core area
The essence of overlaying (Figures 1 to 4 as shown in
Figure 5) is to determine whether or not there will be any core area(s) within FCT where shortest waiting time for public transport, shortest walking distance to the nearest bus stop, cheapest public transport fare and highest bus service frequency can be found. As observed, there is no clear cut core area, but what can be termed as multi-nuclei core areas lie in pockets of locations, principally around the city centre where public transport commuters enjoy the highest degree of bus frequency, while the Gwagwalada area have the least walking distance and waiting time at bus stops/terminals. This result is at variance with the work of Ali (2010) in his assessment of the quality of intra urban bus services in the city of Enugu, which identifies a single central core area around the CBD for the city of Enugu-Nigeria.
The two core areas in
Figure 6 appear to be the two major economic nerve centre of FCT, where most of the administrative, educational, business and commercial activities were located. They are characterized by the greatest concentration of business offices, massive high-rise buildings, for both public and private establishments. Specifically, these buildings include; government Ministries,
Departments and Agencies (MDA’s), foreign embassies, wholesale and retail commercial outlets, banks, university, construction companies, churches, mosques and staff quarters just to mention a few. These core areas have the highest densities of roads in the FCT. Because of the high concentration of economic and social activities in the areas, they therefore become the originating and terminating points of large numbers of bus commuter trips to and from the rest of FCT most part of the day.
The study shows that Abuja city at the Wuse and Garki Area 1 terminal has the highest hourly bus mean frequency. This is because, most public transport coming from the city periphery (Zuba, Gwagwalada, Bwari, Lugbe and Kubwa) empties into them. In terms of real time availability of buses, this may infer better accessibility to public transport services. This is followed by Nyanya, Lugbe, Zuba and Kubwa terminals, because these settlements are not only served by better road network, but also there are pockets of densely populated residential zones around them where large volumes of commuters resides; The three areas with shorter walking distance to public transport terminals/ bus stops, Zuba- U turn, Zuba opposite Dankogi and Gwagwalada by market, lie completely outside the city centre. The Central Area and the Three Arm Zone where most government institutions that serve as attractor and generators of fixed time work place trips have no close public transport terminals. This makes most FCT commuters walk long distance before getting to their nearest bus stops/terminal. Commuters waiting time in FCT terminals is at its best in Dutse Alhaji by Area 1, Gwagwalada by market and El-Rufai Motor Park. However, neither of these locations meets international standard and thus could be one of the disincentives for public transport patronage and the prevalence of private car use in the Territory.
The mean public transport fare in FCT was lowest in AUMTCO parks; Kubwa, Nyanya and Gwagwalada parks, this is because these buses are government owned and are operated by an agency of the Federal Capital Territory Administration called, Abuja Urban Mass transit Company (AUMTCO). The company enjoys grants, subventions and subsidies from the Ministry of Federal Capital Territory. With regard to other private public transport operators, Wuse park within the city centre has the best, followed by Kubwa village and Lugbe parks. There is no clear cut core area where public transport service is at best practice, but a pocket of multi-nuclei core areas lie around the City Centre and Gwagwalada axis. These two areas appear to be the major economic nerve centre of FCT, where most of the administrative, educational, business and commercial activities were located. On the basis of the aforementioned, it is hereby recommended that Both the FCT administration, Area Councils and private sector organizations should collaborate to provide a sound, neat and safe public transport buses for commuters, with a view to increasing service frequency, reduce waiting time and public transport fare, thereby making it more accessible to the commuters with or without private car.
In the light of the foregoing, the study recommended a redesign of the public transport routes, bus stops and terminals across the territory to reflect its current physical development pattern and a further step by the stakeholders to provide adequate, clean and affordable public transport services throughout the length and breadth of the territory. The routing of such transport services should link-up all major activity centres (public institutions, markets, schools etc). This will eliminate frequent need for intermediate transport and the associated costs or long distance walking to the existing public transport bus terminals/stops and ultimately improve the current level of access to public transport service.