Journal of
Geography and Regional Planning

  • Abbreviation: J. Geogr. Reg. Plann.
  • Language: English
  • ISSN: 2070-1845
  • DOI: 10.5897/JGRP
  • Start Year: 2008
  • Published Articles: 395

Full Length Research Paper

Population move on Rajasthan: Regional analysis

Manoj Debnath
  • Manoj Debnath
  • Department of Geography, North-Eastern Hill University, Shillong, Meghalaya, India.
  • Google Scholar
Sheuli Ray
  • Sheuli Ray
  • Department of Geography, North-Eastern Hill University, Shillong, Meghalaya, India.
  • Google Scholar


  •  Received: 08 July 2017
  •  Accepted: 18 August 2017
  •  Published: 31 July 2019

 ABSTRACT

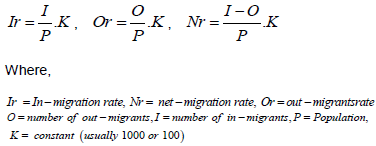
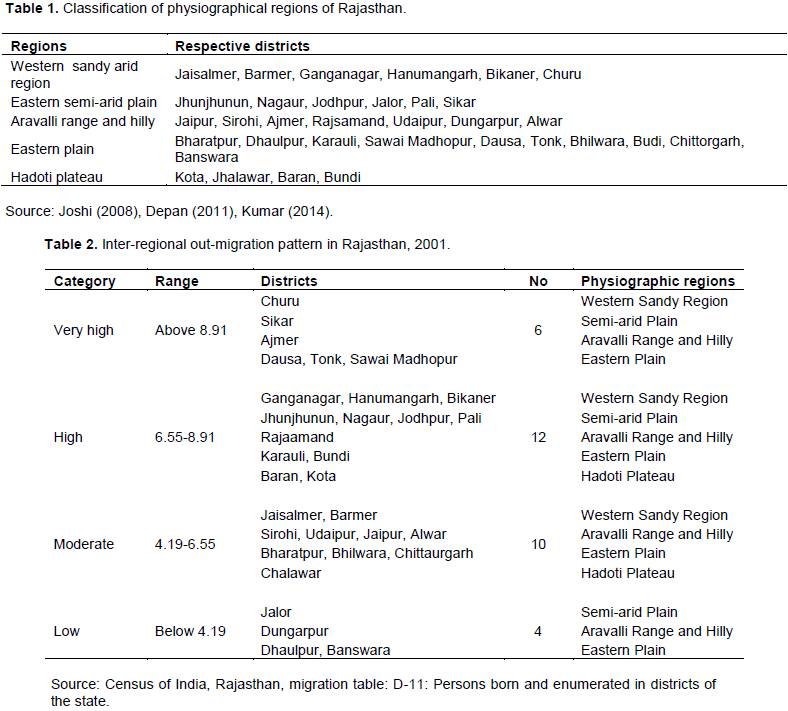
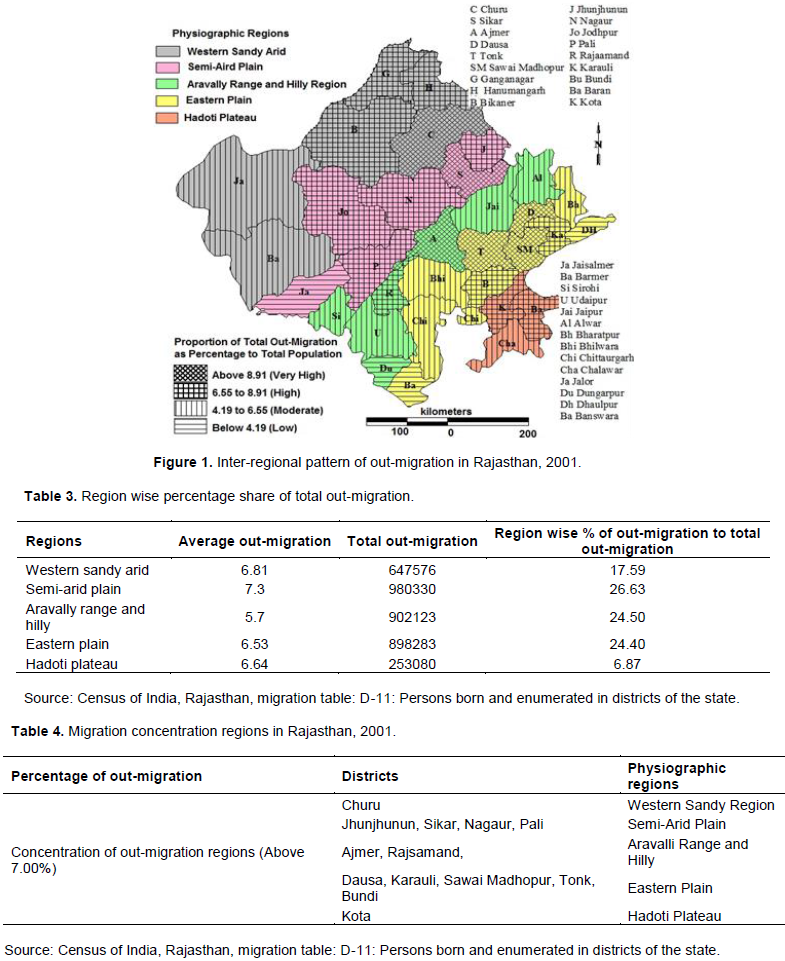
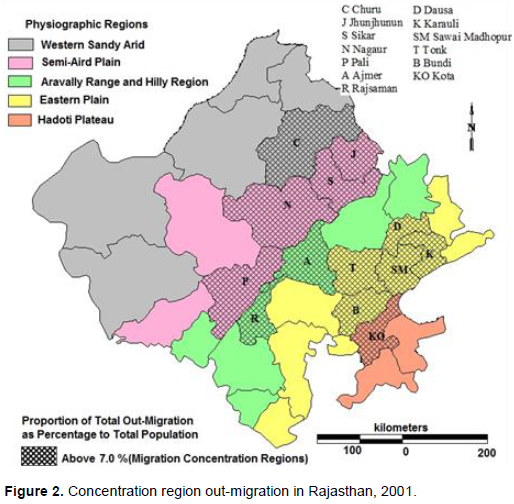
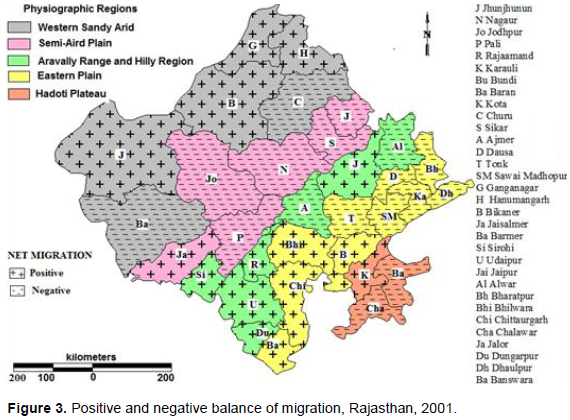
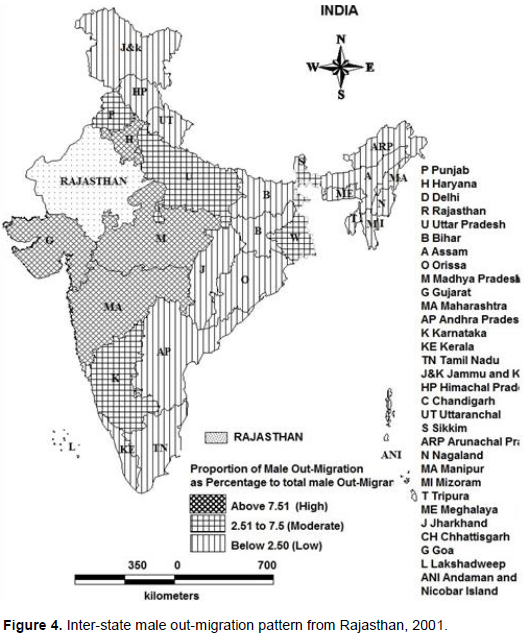
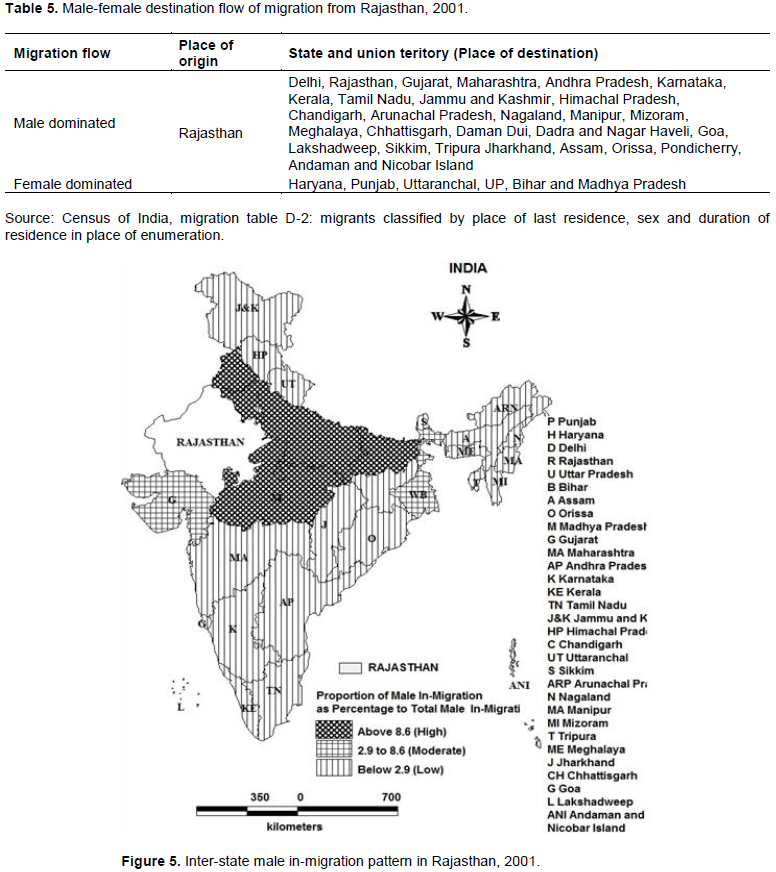
The physiography of Rajasthan is not suitable for agricultural activity. Most parts of Rajasthan are sandy regions and Aravalli Mountain, which is a barrier for agriculture. Eastern part of Rajasthan is covered with plain soil but this region is also not suitable for agriculture. This is the reason why Rajasthan experienced a large proportion of out-migration from its different physiographic regions. The present research aims to investigate in details, the identification of out migration regions and regional flow of male migration with a geographical perspective. Analysis of inter-regional out-migration flow in Rajasthan was based on secondary data. The migration rates has been calculated for out-migration, in-migration, and net migration, as well as specific population subgroups using Clark method. The Eastern sandy arid region and Eastern plain region have experienced higher rate of inter-regional out-migration.


Key words: Male migration, source region, Rajasthan, physiographic region.


 INTRODUCTION

Most parts of Rajasthan are covered with western sandy region (The Thor Desert) and Aravalli Mountain, which is a big barrier for agricultural activities. The Eastern part of Rajasthan is covered with plain sandy soil but this region is also not suitable for agriculture. This is the reason why this state experienced a large proportion of out-migration in different physiographic regions in Rajasthan.
 
Some scholars also studied the nature and trend of out-migration from Rajasthan. Some parts of Rajasthan which is located in central India have a long history of human migration (Hutton, 1986). Rural people of Rajasthan migrated to Maharashtra especially Mumbai (Carroll, 2010). The temporary migration is found higher than national average in Rajasthan (Saha and Kumar, 2008). Rajasthan and Gujarat have also experienced very high rate of out-migration, not only non-tribal areas but also tribal areas  in  Madhya  Pradesh  (MP),  (Mosse
et al., 2002).
 
Out-migration is a strategy that received landless agricultural labours and poor rural people (Keshri and Bhagat, 2012; Haberfeld et al., 1991). Good condition of transport, communication system and high employment opportunity are the basic factors for rural urban out-migration in any area (Battacharya, 1998; Gupta, 1993; Andrienko and Guriev, 2004).
 
The following objectives have been undertaken for this study that is to identify inter-regional source of out-migration in Rajasthan, and to analyse regional flow of male migration in different physiographic regions.


 METHODOLOGY

Inter-regional out-migration flow in Rajasthan is based on secondary data. Secondary data were collected from migration table (D series, 2001). The census of India provided enough data to analyse inter-regional migration flow and pattern of out-migration in Rajasthan.
 
The study was essentially based on 2001 migration data. Unfortunately, migration data for the 2011 census was yet to be released for Rajasthan. Migration rates can be calculated for out-migration, in-migration and net migration, as well as specific subgroups of population by Clark (1986) method:
 
 
Inter-regional out-migration analysis has been done by classifying all the districts of the state into physiographic region. In physiographic point of view, the state is divided into five broad regions that is, sandy arid plain, semi-arid plain/Bangur Region, Aravalli Range and Hilly Region, eastern plain and Hadoti Plateau regions for showing the out migration patterns. The districts have been taken as the basic unit of the study. As at 2001, there were 32 districts in Rajasthan. 
 
Simple method was used for the analysis of net-migration or gain and loss migration. The sum of in-migrants and out-migrants represents the gross migrants; whereas net migration is calculated from in-migrants-out-migrants to total population (Census Atlas, 1971).
 
The study focus on the two streams of migration, total migration, and male out-migration. All the migrants will also be classified on the basis of distance: short (intra-district), medium (inter-district), and long (inter-state).
 
Inter-regional male outmigration will be analysed, using mean and standard deviation method. The inter-regional variation in out-migration at the district level used different statistical techniques like average mean of out-migration, standard deviation and co-efficient of variation.


 RESULT AND DISCUSSION

Rajasthan is the largest state in India and is located at the western part of the country. It lies between 23°3’ N to 30°12’N and 69°30’E to 78°18’E. Rajasthan is bounded by Pakistan in the west and north-west, Punjab in the north, Haryana in the north-east, Uttar Pradesh in the east, Madhya Pradesh in the south-east, and Gujarat in the south-west India.
 
Due to the position of Araballi Hill in the middle portion of the state, Rajasthan is divided mainly into two parts, Eastern Rajasthan and Western Rajasthan. In physiographic point of view, there are five major regions (Joshi, 2008; Depan, 2011; Kumar, 2014) which are:
 
1. Western Sandy Arid Region (6 districts)
2. Semi-Arid Region (6 districts)
3. Araballi Range and Hilly Region (7 districts)
4. Eastern Plain (11 districts) and
5. Hadoti Plateau Region (3 districts).
 
Physiographic region does not follow any administrative boundary but for the purpose of analysis districts are classified under different regions (Table 1).
 
Inter-regional variation of out-migration
 
The entire study has been analysed on the basis of physiographic region. For the purpose of this study, a broad physiographic region again has been divided into sub-regions and region wise division has been done at district level.
 
Physiographic region does not follow any administrative boundary but for the purpose of analysis districts are classified under different regions. In recent decades, Rajasthan has faced a great proportion of out-migration from different regions. Inter-regional or inter-district outmigration rate is defined as the proportion of total out-migrants from the given region or district to total population of that region or district during the specific period of time (Nangia and Kumar, 2007).
 
The range of out-migration has been classified by using mean and standard deviation method. The rate of total outmigration varies significantly across the districts within and across physiographic regions (Table 2).
 
Figure 1 delineates the inter-regional distribution of total out-migration in Rajasthan. From the figure, it is clear that this state observed diverse nature of out-migration. Very high rate (above 8.91 %) of out-migration was observed in six districts among the thirty two districts in Rajasthan. Churu from Western Sandy Region; Sikar from Semi-arid Plain; Ajmer from Aravalli Range; Hilly, Dausa, Tonk and Sawai Madhopur districts from Eastern Plain regions experienced very high rate of out-migration. High rate (6.55 to 8.91%) of out-migration is found in northern part of Western Sandy Region, covering almost the entire region in Semi-arid Plain and parts of Hadoti Plateau and Eastern Plain regions.
 
From the aforementioned analysis it is clear that more than half of the districts that is, 18 in Rajasthan has observed high and very high rate of inter-regional or inter-district out-migration due to absence of job opportunity, agricultural suitability, accessibility, social and economic underdevelopment, etc (Figure 1).
 
The districts including the category of moderate rate (4.19 to 6.55%) of out-migration are mainly found in south-western part of Western Sandy Region, northern and southern part of Aravalli Range and Hilly, and southern part of Eastern Plain regions. From Table 2 it is clear that only four districts out of thirty two districts experienced low rate of inter-district out-migration in Rajasthan. Form  this  point  of  view,  it  can be imagined
 
that most of the districts in Rajasthan are faced with high risk of out-migration.
 
From the physiographic point of view, except Aravally Range and Hilly Region, all other regions also experience similar average rate of out-migration in Rajasthan. Among the five physiographic regions, the Semi-Arid region has experienced high average proportion of out-migration (7.3%); whereas Aravally Range and Hilly Region experienced low average rate (5.7%). Table 3 depicts that among the total out-migrants semi-arid plain (26.63%), Aravally Range and Hilly Region (24.50 %), and Eastern Plain (24.40%) regions were observed to have one third of out-migration.
 
In terms of mobility, every country, state or region has its own individuality of migration units (Tiwari, 1992). The concept of population regions  is  developed  by  different geographers from different views. Dube (1974), Smith (1928), and Chandna (1969) have given a brief description about the population regions. Tiwari (1992) used the population potential model and the composite scores method for the analysis of mobility regions (Table 4). 
 
Mobility concentration regions or migration predominance regions are those regions which have experienced more than 7% out-migration to total population in Rajasthan (Figure 2). In Rajasthan, central and eastern districts have experienced high and very high rate of outmigration. Churu from Western Sandy Region; Sikar, Nagaur, Pali, Jhunjhunun from Semi-arid Plain; Ajmer, Rajaamand from Aravalli Range; Hilly, Dausa, Tonk, Sawai Madhopur, Karauli, Bundi districts from Eastern Plain; and Kota from Hadoti Plateau regions experienced very high rate of out-migration that  is,  more  than 7% out-migration to total population in the respective districts.


Balance of migration
 
Net migration means the difference between in-migration and out-migrants of an area in a specific period of time. Positive value means less out-migrant and more in-migrants; whereas negative value represents more out-migrants and less in-migrant.
 
Figure 3 shows net migration in different regions and districts in Rajasthan. Most of the parts of western sandy arid region, southern part and Jaipur from Aravally and hilly region and southern part of Eastern plain regions experienced positive migration balance.
 
The entire semi-arid plain and north-eastern part of eastern plain regions highlighted negative proportion of net-migration, meaning more out-migrants and less in-migration for absence of work opportunity for migrants.
 
Figure 3 shows an important pattern of net migration in Rajasthan. Western part and south-eastern part of Rajasthan observed positive rate of out-migration; whereas   the   entire  middle  portion  of  Rajasthan  has
observed negative rate of out-migration.
 
Inter-state male migration flow in Rajasthan
 
The people of Rajasthan have not only crossed district boundary but have gone beyond crossing the state too. Neighbouring states and UTs like Maharashtra (24.15%), Gujarat (21.46%), Delhi (12.52 %), Haryana (9.40 %), and Madhya Pradesh (7.90 %) received around 75.42% of all out-migrants from Rajasthan.
 
Figure 4 shows that the intensity and consistency of out-migrants is higher in the neighbouring states of Rajasthan compared to those states which are located far away. Maharashtra, Gujarat, Delhi, Haryana, and Madhya Pradesh are the neighbouring states of Rajasthan and these states have received 75.42% of the out-migrants who crossed the state boundary.
 
Among the total out-migration pattern from Rajasthan to the other states of India, high rate (above 7.51%) of out-migration was recorded in Maharashtra, Gujarat, Madhya Pradesh, Haryana and Delhi. Moderate rate (2.51 to 7.51 %) of inter-state of out-migration was found in Uttar Pradesh, Punjab, West Bengal and Tamil Nadu whereas the rest of the states and UTs received below 2.51% of all the out-migrants.


Premi (1980) suggested that in the case of short distance, females migrate more in rural areas whereas in long distance most of them migrate to the urban areas in search of work. Similarly, Piotrowski et al. (2013) said that short distance movements are likely to be marriage related while long-distance movements are probably work related.
 
In terms of inter-state outmigration, females dominate in short distance migration whereas males dominated in the long distance. Table 5 shows that Haryana, Punjab, Uttaranchal, UP, Bihar and Madhya Pradesh received greater volume of female migration. The rest of the states and union territories received large proportion of male migration from Rajasthan. Males generally migrate for work and employment purposes, and they moved to destinations that are economically and industrially developed offering greater employment opportunities.
 
Rajasthan also experienced a significant volume of in-migration from neighbouring state. Figure 5 depicts that neighbouring states and UTs like Uttar Pradesh (25.48%), Madhya Pradesh (15.09%), Punjab (13.03%), Haryana (11.26%) and Bihar (10.00%) received greater proportion of in-migrants into Rajasthan.
 
Figure 5 shows that the intensity and consistency of in-migrants is higher in the neighbouring states of Rajasthan compared to those states which are located far away. Uttar Pradesh, Madhya Pradesh,  Punjab,  Haryana,  and Bihar are the neighbouring states of Rajasthan and these states received 75.01% of the in-migrants who crossed the state boundary.


 CONCLUSION

After the analytical study, it is clear that different physiographic regions have experienced diverse nature of out-migration. Except in the western part, the entire arid physiographic region and north-eastern part of eastern plain regions observed high propensity of out-migration.
 
In Rajasthan, central and eastern districts have experienced high and very high rate of out-migration. Churu from Western Sandy Region; Sikar, Nagaur, Pali, Jhunjhunun from Semi-arid Plain; Ajmer and Rajaamand from Aravalli Range; Hilly, Dausa, Tonk, Sawai Madhopur, Karauli and  Bundi districts from Eastern Plain; and Kota from Hadoti Plateau regions experienced very high rate of out-migration to total population in the respective districts.
 
In terms of net-migration in Rajasthan, the Western part and South-eastern part of Rajasthan observed positive rate of out-migration whereas the entire middle portion of Rajasthan observed negative rate of out-migration.
 
Inter-state migration flow  clearly  proves  that, distance creates little hurdle to migration; if the destination places are  economically   and    industrially    developed   then distance does not matter. Maharashtra, Delhi, Gujarat, Punjab   and    Haryana  are   states   that   attract   large proportion of migrants from Rajasthan.


 CONFLICT OF INTERESTS

The authors have not declared any conflict of interests.


 REFERENCES

Allcott H Greenstone M (2012). Is there an energy efficiency gap?. Journal of Economic Perspectives 26(1):3-28. Available at:

View
Crossref


Amu NJ (2005). The role of women in Ghana's economy. Friedrich Ebert Foundation. Available at: 

View


Ang BW, Xu XY (2013). Tracking industrial energy efficiency trends using index decomposition analysis. Energy Economics 40:1014-1021.
Crossref


Apeaning RW, Thollander P (2013). Barriers to and driving forces for industrial energy efficiency improvements in African industries-a case study of Ghana's largest industrial area. Journal of Cleaner Production 53:204-213.
Crossref


Bose BK (1992). Modern Power Electronics Evolution, Technology and Applications. IEEE Press, New York, ISBN 0-87942-282-3.


Brummelhuis T, Lieke L, Bakker AB (2012). A resource perspective on the work-home Interface: The work-home resources model. American Psychologist 67(7):545.
Crossref


Cagno E, Trianni A, Spallina G, Marchesani F (2013). Drivers for industrial energy efficiency: pieces of evidence from Italian manufacturing enterprises. In ICAE - International Conference on Applied Energy pp. 1-10.
Crossref


Cagno E, Trianni A, Worrell E, Miggiano F (2014). Barriers and drivers for energy efficiency: different perspectives from an exploratory study in the Netherlands. Energy Procedia 61:1256-1260.
Crossref


De Groot H, Verhoef E, Nijkamp P (2001). Energy saving by firms: Decision-making, barriers and policies. Energy Economics 23(6):717-740.
Crossref


DeCanio SJ (1998). The efficiency paradox: bureaucratic and organizational barriers to profitable energy-saving investments. Energy Policy 26(5):441-454.
Crossref


Energy Commission (2017). 2017 Energy (Supply and Demand) Outlook for Ghana. Accra: Energy Commission.


Gellings CW (2009). The smart grid: enabling energy efficiency and demand response. The Fairmont Press, Inc.


Gifford R, Nilsson A (2014). Personal and social factors that influence pro‐environmental concern and behaviour: A review. International Journal of Psychology 49(3):141-157.
Crossref


Gyamfi S, Diawuo FA, Kumi EN, Sika F, Modjinou M (2017). The energy efficiency situation in Ghana. Renewable and Sustainable Energy Reviews (School of engineering, University of Energy and Natural Resources).
Crossref


Gyamfi S, Diawuo FA, Kumi EN, Sika F, Modjinou M (2018). The energy efficiency situation in Ghana. Renewable and Sustainable Energy Reviews 82:1415-1423.
Crossref


Gyamfi S, Modjinou M, Djordjevic S (2015). Improving electricity supply security in Ghana-The potential of renewable energy. Renewable and Sustainable Energy Reviews 43:1035-1045.
Crossref


Hackl R, Harvey S (2013). Framework methodology for increased energy efficiency and renewable feedstock integration in industrial clusters. Applied Energy 112:1500-1509.
Crossref


Heintz J (2005). Employment, poverty, and gender in Ghana. Available at: 

View


Hong T, Lin HW (2013). Occupant behavior: impact on energy use of private offices (No. LBNL-6128E). Lawrence Berkeley National Lab.(LBNL), Berkeley, CA (United States).


Ibrik IH, Mahmoud MM (2005). Energy efficiency improvement procedures and audit results of electrical, thermal and solar applications in Palestine. Energy Policy 33(5):651-658.
Crossref


International Energy Agency (2017). 'Market Report Series: Energy Efficiency 2017'. P 135 

View.


Kambule N (2014). A survey on the state of energy efficiency adoption and related challenges amongst selected manufacturing SMMEs in the Booysens area of Johannesburg (Doctoral dissertation, University of Johannesburg).


Kemausuor F, Obeng GY, Brew-Hammond A, Duker A (2011). A review of trends, policies and plans for increasing energy access in Ghana. Renewable and Sustainable Energy Reviews 15(9):5143-5154.
Crossref


Koizumi S (2007). Energy Efficiency of air conditioners in developing countries and the role of CDM. Paris: International Energy Agency.


Kollmuss A, Agyeman J (2002). Mind the gap: why do people act environmentally and what are the barriers to pro-environmental behavior?. Environmental Education Research 8(3):239-260.
Crossref


Kumi EN (2017). The Electricity Situation in Ghana: Challenges and Opportunities. Center for Global Development.


Mahmoud M, Ibrik I (2002). Power losses reduction in low voltagedistribution networks by improving the power factor in residential sector. Pakistan Journal of Applied Sciences 2(7):727-732.
Crossref


Malama A, Makashini L, Abanda H, Ng'ombe A, Mudenda PA (2015). A Comparative Analysis of Energy Usage and Energy Efficiency Behavior in Low-and High-Income Households: The Case of Kitwe, Zambia. Resources 4(4):871-902.
Crossref


Owusu A (2010). Towards a reliable and sustainable source of electricity for micro and small scale light industries in the Kumasi Metropolis (Doctoral dissertation).


Patterson MG (1996). What is energy efficiency?: Concepts, indicators and methodological issues. Energy Policy 24(5):377-390.
Crossref


Peprah JA (2011). Women, livelihood and oil and gas discovery in Ghana: An exploratory study of Cape Three Points and surrounding communities. Journal of Sustainable Development 4(3):185.
Crossref


Schleich J (2009). Barriers to energy efficiency: A comparison across the German commercial and services sector. Ecological Economics 68(7):2150-2159.
Crossref


Spallina G, Marchesani F (2012). Drivers for industrial energy efficiency: an innovative framework (Anno Accademico 2011-2012). Available at: 

View


Tindall DB, Davies S, Mauboules C (2003). Activism and conservation behavior in an environmental movement: The contradictory effects of gender. Society and Natural Resources 16(10):909-932.
Crossref


Trianni A, Cagno E, Worrell E (2013). Innovation and adoption of energy efficient technologies: An exploratory analysis of Italian primary metal manufacturing SMEs. Energy Policy 61:430-440.
Crossref


Twumasi E, Frimpong EA, Kemausuor F, Appiah DO, Okyere PY (2017). Energy efficiency awareness and preparedness among students. In Power Africa, 2017 IEEE PES. pp. 456-461.
Crossref


          */?>