Full Length Research Paper
ABSTRACT
The proper use of plants and their extracts, whether for medicine or as a food additive, requires the use of extraction and characterization methods that allow the identification and quantification of the active principles in each extract, associating them with the effect produced. With this objective, the present work was developed to study the ultrasonic extracts of mangabeira (Hancornia speciosa Gomes), obtained from bark, leaves, and fruits of mangabeira in search of compounds with phytotherapeutic potential, particularly, anti-inflammatory activity. This plant is native to Brazil, belonging to the Apocinaceae family and is used in folk medicine to treat various diseases. The extracts were analyzed by gas chromatography and liquid chromatography, to test their antioxidant activity without toxicity. It was found that the extracts did not present toxicity as they have great antioxidant power. Identification of the compounds by GC/MS indicated the presence of Lupeol and Lupeol acetate as major compounds. The general characterization of extracts showed high contents of total phenolic compounds, flavonoids and flavonol in leaves and tannins (ï€9 mg g-1) in the fruits. Some compounds such as Chlorogenic acid (ï€ 35 mg g-1 in leaves and fruits), Catechin (ï€ 35 mg g-1 in leaves, peels and fruits), Rutin (ï€ 35 mg g-1 in leaves, peels and fruits) and Isoquercetin (35 mg g-1 only in the leaves) were also identified and quantified by HPLC/UV-DAD.
Key words: Hancornia speciosa Gomes; medicinal plants; Gas chromatography; Lupeol; Antioxidants; flavonoids.
INTRODUCTION
Although the use of medicinal plants is common, the lack of knowledge about their chemical composition and toxic effects may be harmful to human health. When prospecting new plants that have some biological activity, it is necessary to detail their composition (Veiga Jr. and Pinto, 2005; Zhang, 2011), besides emphasizing the studies on the biological activities of plants and their extracts. A great part of these studies focus on the determination of flavonoids and antioxidants (Maciel et al., 2002), due to their great applicability. However, a research on the toxicity of these plants is also necessary. The determination of the chemical composition of the extracts and the isolation of the main compounds allow their use in phytoteraphic applications or functional foods, focusing not only in their individual effects but also, and probably more significantly on their synergic effects. Mangabeira (Hancornia speciosa Gomes - HSG) is a plant, whose fruits are rich in ascorbic acid and other vitamins; it belongs to the family Apocynaceae, and is a native of Brazil, but that can also be found in other countries such as Paraguay, Bolivia and Peru (Silva et al., 2017; Costa et al., 2017). Many studies indicate the potential use of HSG extracts as antidiabetic (Pereira et al., 2015), anti-inflammatory (Marinho et al., 2011; Rego et al., 2016) antihypertensive (Silva et al., 2016). Among the compounds found in mangabeira one can highlight the pentacyclic triterpene Lupeol, which is efficient in the treatment of microbial infections, inflammatory diseases and related to oxidative stress, such as arthritis, hepatotoxicity, kidney disorders, and tumors, in addition to metabolic changes such as cardiovascular diseases, diabetes and dyslipidemia (Tsai et al., 2016).
The success of a phytochemical research depends on the analytical technique used both for extraction and for the analysis and isolation of the active ingredients (Huie, 2002; Azmir et al., 2013). To save time and solvent, ultrasonic-assisted extraction (UAE) has been widely used; it has similar performance with traditional techniques such as maceration and soxhlet (Chemat et al., 2017). Its advantages include high extraction efficiency, high reproducibility, high yield, low solvent consumption, low energy requirement and easy operation (Tao and Sun, 2013; Patil and Akamanchi, 2017). The main effects of ultrasound on plant extraction are the increase in permeability of cell walls due to the cavitation and the increase in mechanical stress of the cells, which is also called friction interfacial (Mason et al., 1996; Roohinejad et al., 2016; Bindes et al., 2019).
The use of the sonication in our research group has been shown to be suitable for the extraction of bioactive compounds from plants and comparable to traditional techniques such as maceration and Soxhlet, with the great advantage of reducing the total extraction time (Melecchi et al., 2006; Peres et al., 2006; Jacques et al., 2006). From these results, we decide to use sonication in the extraction of compounds from leaves, barks and fruits of HSG.
On the other hand, the best techniques used to analyze, identify and quantify plant extracts are chromatography (gas or liquid) (Khoddami et al., 2013). Gas chromatography coupled to mass spectrometry (GC/MS) is a widely used technique for the analysis of volatile compounds from plant extracts, mainly because it allows their separation and provides a mass spectrum for each peak, favoring its molecular identification. Liquid chromatography provides the separation and identification of non-volatile, thermolabile or polar compounds. The use of both techniques allows a more complete characterization of the extracts. In this work, the extracts of the bark, leaf and fruits of H. speciosa Gomes, obtained by ultrasonic assisted extraction were evaluated, using GC/MS and HPLC/DAD to determine their phytotherapeutic potential, particularly, anti-inflammatory activity.
EXPERIMENTAL
Samples
A Mangaba (H. speciosa Gomes - HSG) tree bush was randomly selected from a Mangabeiras plantation in a farm in Sergipe (Brazilian Northeast) and from this same tree all samples (fruits, bark and leaves) used in this work were taken. The geographic coordinates were: Latitude -10.996193 and Longitude 37.094002. Dr. Marcelo Brito, from Tiradentes University (UNIT) Department of Botany, Aracaju (SE), identified the species and deposited it in the Tiradentes Herbarium – AJU with 841 number. The bark and leaves of HSG were dried in an air circulation oven with controlled temperature at 40°C for 72 h. The fruits were lyophilized using a freeze drier Liobras, Liotop L101, Brazil.
Materials
Solvents at p.a grade (ethanol, methanol, acetonitrile and dichloromethane), acids (acetic and hydrochloridric acid) and inorganic salts (sodium carbonate, aluminum chloride and sodium acetate) were purchased from Merck. Helium (White Martins, Aracaju, SE) was used as carrier gas in GC/MS analyses. The n-alkanes standard mixture (from C6 to C36) and standard were purchased from Sigma Aldrich. Other standards were also purchased from Sigma Aldrich: Lupeol, Gallic acid, ethyl eicosanoate, caffeic acid, p-coumaric acid, ferric acid, rutin, chlorogenic acid, catechin, isoquercetin, quercetin, luteolin, BHT (butylated hydroxy toluene), 2,2-diphenyl-1-picrylhydrazyl (DPPH), 2,2'-azino-bis(3-ethylbenzothiazoline-6-sulphonic acid) (ABTS) and vanillin.
Extraction method: Sonication
Three Erlenmeyers (150 ml) connected to condensers were used to avoid losses by volatilization, in an ultrasonic bath (Ultrasound Model USC-1400A, with a frequency 40 kHz and a power of 135 W). After a previous optimization of the method (see in Supplementary Electronic Material), two main conditions were tested: (condition 1) 3 g of the sample, 20 ml ethanol, 60 ml dichloromethane and 30 min of extraction; and (condition 2) 3 g of the sample, 20 ml ethanol, 60 ml dichloromethane, and 90 min of extraction. The temperature of the bath was 30°C, maintained through bath water replenishment and thermometer control. The extract was filtered through a qualitative filter paper with a diameter of 12.5 cm, and porosity of 3 µm (Nalgon); and the solvent was evaporated at room temperature, under a gentle flux of nitrogen (N2, 99.999%, White Martins, Sergipe, Brazil).
Chromatographic analysis
GC/MS analyses
The extracts were analyzed by GC/qMS using a GC/qMS-QP 2010 Ultra (Shimadzu, Japan) with an auto-sampler AOC 20i (Shimadzu, Japan) and a DB-5 capillary column (30 m long, 0.25 mm internal diameter and 0.25 μm film thickness) (Agilent Technologies, USA).
The temperatures of the injector, detector and interface were maintained at 300°C. The samples were injected in Split mode (1:10) using a volume of 1 μl. The oven was heated from 70°C (staying 5 min) using two heating rates: 15°C min-1 until 280 and 2°C min-1 until 300°C (waiting 15 min).
The mass spectra analysis used was the scanning of total spectrum for each peak (SCAN) in the range of 45 to 450 Daltons, corresponding to an acquisition frequency of 33 Hz. Helium was used as carrier gas at a flow of 1 ml min-1. The compounds were tentatively identified by comparing the mass spectra obtained experimentally with the mass spectra of NIST 14 library, from the equipment used. The minimum spectral similarity required in this process was 70%. The LPTRI indexes were calculated according to Van Den Dool and Kratz (1963) and they were compared with those from the NIST online library (http://webbook.nist.gov/chemistry/), using a difference smaller than 15 units as condition for identification. For the quantitative analysis, it was constructed an analytical curve for lupeol at different concentrations and using ethyl eicosanoate as internal standard (C22H44O2, MW = 340 g mol-1). The analysis occurred in the SIM (Single Ion Monitoring) mode. The ions used for the analysis were 189, 203 and 218 besides the ion 88 for the internal standard. The concentrations of Lupeol used were 1.2, 0.6, 0.3, 0.15, 0.075 and 0.05 mg with 10 mg of the internal standard, in 1 g of dichloromethane. The analyses of the extracts were done using 100 mg of each extract with 10 mg of the internal standard diluted in 1 mL of dichloromethane.
HPLC-UV-DAD analyses
The HPLC analysis of the extracts was performed on a Liquid Chromatograph (Shimadzu model LC-20) equipped with a Phenomenex Gemini μ-C18 column (15 cm long × 4.6 mm internal diameter × 5 μm stationary phase thickness). The mobile phase was composed of water with 1% of acetic acid (eluent A) and acetonitrile (eluent B), using the following gradient: From 0 to 5 min, 5% of B; from 5 to 35 min, the gradient varied from 5 to 80% of B and in 10 min, it returned to the initial condition. The flow was maintained at 1 ml min-1, the temperature was set at 25°C and the injection volume was 10 μl. Caffeic acid, p-coumaric acid, ferric acid, rutin, chlorogenic acid, catechin, isoquercetin, quercetin, and luteolin (purchased from Sigma, ≥ 97%) standards solutions were prepared at the initial concentration of 100 μg ml-1. The compound concentrations were determined by external calibration after appropriate dilutions in the range of 0.01 to 10 μg ml-1.
Total phenolic compounds
Solutions at 1000 μg ml-1 of each extract in methanol were subjected to the determination of total phenolic compounds. For this analysis, the followings were used: 100 μl of each solution, 1.5 ml of aqueous solution of sodium carbonate at 2%, 5 ml of the Folin-Ciocalteau reagent (Sigma Aldrich) (1:10 v/v), and 1.00 ml of distilled water. The absorbance was measured after 30 min at 760 nm using a spectrophotometer (700S FEMTO) according to the methodology described by Djeridane et al. (2006).
For the calculation of the content of phenolic compounds an analytical curve was prepared using standard solutions of gallic acid in the concentrations of 1; 5; 10; 15; 30; and 40 μg in 1.0 g of solvent. The result was expressed in mg of gallic acid per gram of extract. All tests were performed in triplicate.
Flavonoids and flavonol
For flavonoids determination, 500 μl of each extract at the concentration of 1000 μg ml-1, was mixed with 1.5 ml of methanol, 0.10 ml of aqueous aluminum chloride at 10%, 0.1 ml of sodium acetate 1 mol L-1 and 2.80 ml of distilled water. After being incubated for 40 min, the absorbance was measured, in the same spectrophotometer used for the determination of phenolic compounds, using a wavelength of 415 nm. The concentration of flavonol was determined using a mixture of 2 ml of each extract, 2 ml of AlCl3 (2%), and 3 ml CH3COONa (5%). This was followed by incubation for 2.5 h at 20°C and absorbance readings at 440 nm (Formagio et al., 2014). For the determination of the content of flavonoids and flavonol, an analytical curve was prepared in the concentrations of 0.1; 0.5; 1; 5; 10; and 20 µg of standard quercetin. The result is expressed in mg of quercetin per gram of extract. All tests were performed in triplicate.
Condensed tannins
To determine the condensed tannins, there was a reaction with vanillin, according to the method of Agostini-Costa et al. (1999). Exactly 4 ml of vanillin reagent (4% vanillin and 8% HCl in methanol) recently prepared was heated at 30°C for 30 min in a test tube. After this step, 1 ml of extract (1000 μg L-1) was added to each tube. The reaction was maintained at 30°C for 20 min and the absorbance was read at 500 nm. The quantification was done by calibration curve, using catechin as standard, at concentrations of 2.5; 5; 10; 20; 30; and 40 μg/ml. The results were expressed in mg of catechin per g extract.
Antioxidant activity (ABTS and DPPH)
The potential of eliminating free radicals using the 2,2-diphenyl-1-picrylhydrazyl (DPPH) and the 2,2'-azino-bis(3-ethylbenzothiazoline-6-sulphonic acid) (ABTS) was determined by the spectrophotometric method, using different concentrations of extracts in methanol (from 10 to 1000 μg mL-1). For the DPPH test, at 500 μl of each extract was added 2 ml of a solution of 0.1 mol L-1 of DPPH, which was previously prepared and incubated in the dark for 30 min. The absorbance was registered at 517 nm. In the ABTS assay, 1.98 ml of diluted ABTS solution (0.7 mMolar) was added to 20 μl of the extract and the absorbance was measured at 734 nm, after stirring for 6 min. The assays were performed in triplicate. The percent inhibition is calculated by:
I% = (A0 - Ai/A0) × 100,
Where, A0 is the absorbance of the control and Ai is the absorbance of the extract.
The value of IC50, defined as the required sample concentration for eliminating 50% of the free radicals, was calculated from the graphic plotted as I% versus concentration of the extract, using BHT (Butylated Hydroxy Toluene) as control for both tests.
Toxicity bioassay (Artemia salina)
The toxicity test was performed according to the method described by Lacerda et al. (2011), using the larvae of the microcrustacean A. salina, as biological model. The cysts were incubated for 48 h in saline solution (pH 8) with illumination (60 W) and constant aeration, for the larval development. Concentrations of 10, 50, 100, 250, 500, 750, and 1000 µg/ml were diluted in saline solution (pH 8) and placed in test tubes in triplicate. For the accomplishment of the test, 10 larvae were used in the 2nd stage in 10 ml of the treatment, per replicate, including the negative control containing only the diluent. After 24 h of incubation, the number of dead larvae was counted. To evaluate the results, an analytical curve was constructed for determination of the LD50 employing concentrations and percentages of survival.
RESULTS AND DISCUSSION
Ultrasonic assisted extraction
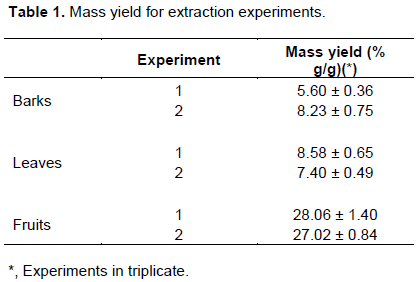
Table 1 shows the mass yield (%) for the extracts according the conditions (1 or 2) and the part of the plant (bark, leaves and fruits) for sonication of HSB. In Table 1, the condition of experiment 1 for leaves and fruits led to better yields, while experiment 2 showed better performance for bark trees. However, the yield between experiments for each part of the plant presented similar values and approximately inside the experimental error. This observation is important because it allows the use of condition 1, with less time of extraction (30 min) and no significant losses.
Gas chromatographic analysis of extracts
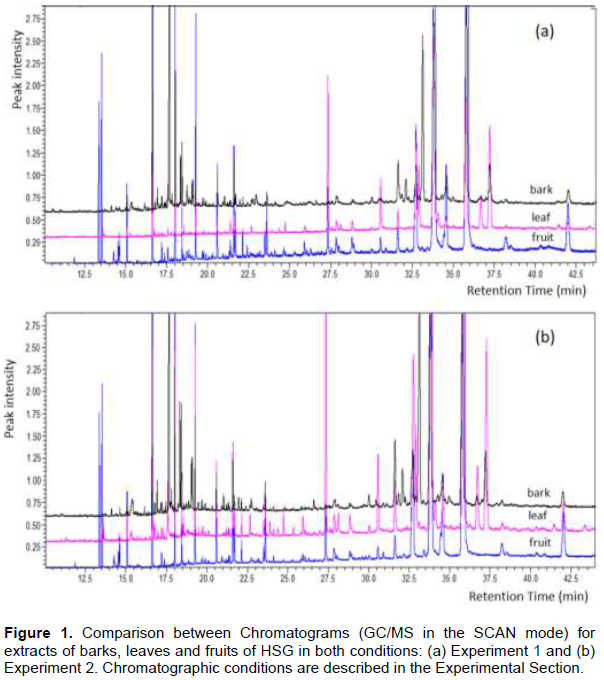
Figure 1 shows the total ion chromatograms (TIC-GC/MS) for the extracts. In Figure 1a is presented the chromatograms for experiments 1 and in Figure 1b, for experiment 2. Observing these figures, it becomes clear that there are more similarities than differences between the chromatograms. The complete identification of the constituents with the calculated retention indices and the difference between them and the indices in the NIST home page (www.nistwebbook.com) can be found in Table 2 in the additional electronic material. This table shows the predominance of oxygenated triterpenes in all samples. Only a few of these could be fully identified, while others were only identified by their general structure and MS spectra, without positioning the side chain in the molecule. Figure 2 presents a summary of this identification, in terms of the classes of compounds identified (Figure 2a) and also with the presentation of the major compounds in each sample (Figure 2b).
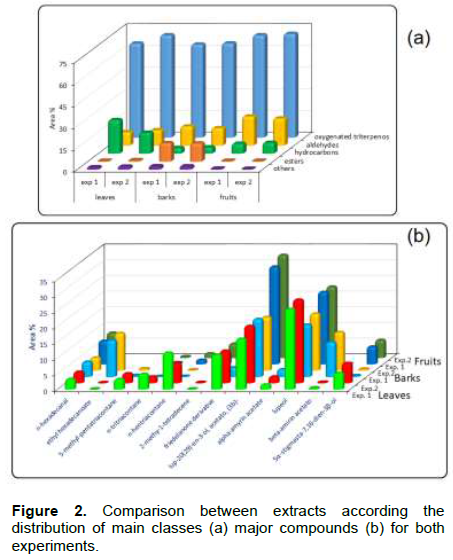
In Figure 2a, it is possible to see the distribution in classes with a wide predominance of triterpenes, with a small, non-significant difference between samples. Regarding hydrocarbons and aldehydes, there is a significant difference between samples with a predominance of aldehydes in fruits and hydrocarbons in leaves. Esters appear almost exclusively in the peels. Lupeol and its derivatives (lupeol acetate, alpha and beta amyrin) stand out as majorities in the three samples (Figure 2b). It must be considered that this is only a rough approximation, taking into account only the relative area of the chromatographic peaks, in the GC / MS system and using the SCAN (from 45 to 450 Daltons) mode. However, it can be used as an indicator for quantitative analysis using standards and the SIM mode (choosing the main ions on the spectra of these compounds). Among the esters, ethyl hexadecanoate was predominant, especially in bark extracts. From these results, the methodology for quantitative determination of triterpenes with a structure similar to lupeol was developed.
Lupeol and Lupeol acetate (oxygenated triterpenes) appear in all extracts and with great peak areas, meaning that they are in major concentrations. Lupeol is a triterpene with pharmacological activities already studied from another plants, mainly medicinal plants (Siddique and Saleem, 2011; Lucetti et al., 2010; Okoye et al., 2014). Lupeol presents pharmacological activity against inflammation, arthritis, diabetes, cardiovascular diseases, renal disorders, hepatic toxicity, microbial infections and cancer (Siddique and Saleem, 2011). In addition, studies suggest that Lupeol has not acute toxicity and does not cause any systemic toxicity in animals at doses ranging from 30 to 2000 mg/kg (Siddique and Saleem, 2011). Lupeol acetate, a compound identified in all samples, and the acetates of a-amyrin and β-amyrin also have reports of anti-inflammatory activity (Lucetti et al., 2010; Okoye et al., 2014). These three compounds and Lupeol have similar structural forms, which allow the accomplishment of a quantitative analysis of these samples, using lupeol as analytical standard. Figure 3 shows the chemical structures of these compounds and their mass spectra.
Observing Figure 3, one can conclude that, using Lupeol as standard (Sigma Aldrich analytical standard) and using GC/MS in SIM (single ion monitoring) mode with three m/z ions (183, 203, and 218 Daltons) it is possible to quantify not only Lupeol but also the other three triterpenes. For this analysis, one can suppose that the response factor is approximately the same for the four compounds. An analytical curve of Lupeol was constructed and its equation is:
y = 0.4282x – 0.3077 with and R2 = 0.9991
The analyses of the extracts were done considering this curve valid for the four compounds: Lupeol, Lupeol acetate, a and β- amyrin acetate.
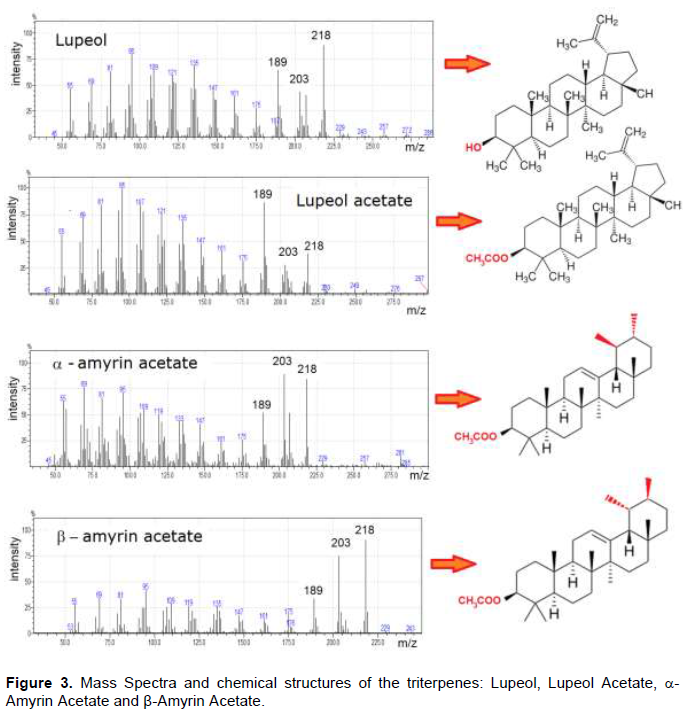
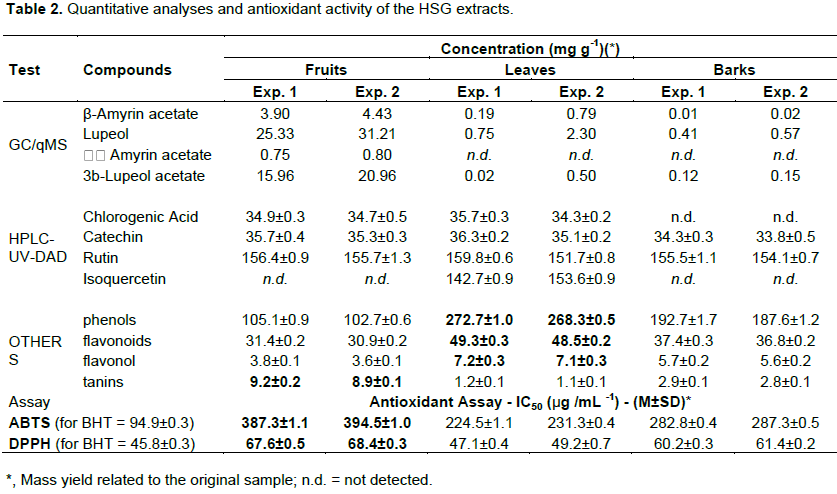
Table 2 shows the results of quantitative determination of the triterpenes in extracts of HSG. The results were calculated considering the initial amount of sample and the mass yield of the extracts and are defined as grams of each compound per kilogram of sample (fruit, leaves or barks). It is clear from the data that fruits have greater amount of the triperpenes, highlighting Lupeol, and Lupeol Acetate, than barks or leaves. Lupeol was the major compound in all the extracts and for all samples, followed by lupeol acetate, corroborating with the results obtained when only the relative areas were analyzed (Figure 2). Another important observation from these data is that the triterpenes are concentrated in the fruit, with lower values in bark and leaves, indicating that this is the best part of the plant for phytotherapy purposes.
Liquid chromatographic analysis of extracts
Table 2 also presents the quantitative results of these chromatographic analyses. As can be viewed in this table, only Rutin and Catechin are present in all the extracts. The leaf extracts showed the more complex chromatographic profile, while fruit extracts showed only three compounds and bark extracts, two compounds. Santos et al. (2016) detected these four compounds in leaf extracts of H. speciosa, Rutin being the main compound. Many studies point several pharmacological applications of this compound, as antidiabetic (Ghorbani, 2017), anticancer activity (Perk et al., 2014), and anti-inflammatory effect (Guardia et al., 2001).
The second flavonoid found with the highest concentration in the present study, chlorogenic acid, was identified in the extraction of leaves. Studies indicate that chlorogenic acid has anti-inflammatory and antioxidant action, and may affect the metabolism of lipids and glucose in genetic metabolic disorders (Naveed et al., 2018).
Determination of flavonoids, flavonol, tannin and phenolic compounds
In Table 2 one can see the quantitative results of analysis of extracts. These results indicate that the leaf extracts are rich in polyphenols, flavonoids and flavonol while the fruits produce extracts rich in tannins. The bark showed intermediate values of all these parameters.
According to Angelo and George (2007), phenolic compounds, flavonoids and tannins are derived from the secondary metabolism of superior plants and are responsible for the color, astringency, flavor and oxidative stability of plants. Assumpção et al. (2014) identified the presence of these compounds in the ethanolic extract of H. speciosa and indicated that the anti-inflammatory activities are related to them.
Antioxidant activities
Table 2 presents the data for antioxidant potential of the extracts (ABTS and DPPH). Using the ABTS methodology, the fruit extracts presented greater antioxidant activity than the other parts of the plant and approximately four times the activity of BHT. On the other hand, for DPPH method, the values were also higher but not so as in ABTS assay (only 5% above the value of BHT). All the extracts presented values higher than BHT. The studies of antioxidant potential performed by Santos et al. (2016) indicated that the ethanolic extract of H. speciosa leaves had greater potential for elimination of free radicals using DPPH and BHT as a comparison. However, the activity of the ethanol extract was lower than that of the ascorbic acid standard. It was also identified that the IC50 of the ethanolic extract was 7.1 times lower than that of BHT and 3.2 times higher than that of ascorbic acid; while the maximum activity of the extract (in μg mL-1) was 5 times higher than that of ascorbic acid and 5 times lower than that of BHT.
Toxicity against A. salina
The tests using 10, 50, 100, 250, 500, 750, and 1000 µgml-1 did not show any toxicity for these microcrustaceous. The absence of toxicity against A. salina is an indicator that the plant is tolerable for the biological systems; however other tests must be developed for a more complete toxicological evaluation (Stefanello et al., 2006).
CONCLUSION
Sonication was satisfactorily used to extract organic volatiles and non-volatiles compounds from leaves and fruits of the HSG while chromatography (GC and LC) allowed the separation, identification and quantification of important compounds with diverse pharmacological activities, emphasizing the triterpenes and flavonoids with anti-inflammatory potential. The chemical characterization indicated that leaf extracts are rich in phenols, flavonoids and flavonol. Fruits of HSG presented high amounts of lupeol and lupeol acetate, with important phytotherapic properties. The bark extracts did not present important compounds and also the yields were no significant. These results indicate that the prospection of the fruits and leaves is more adequate; there is no need for the removal of the barks of the tree, thus avoiding possible damages to the species. The main compounds found are known as important anti-inflammatory and antioxidant agents whose activities are largely described in the literature. These facts allow indicating leaves and fruits of HSG for extracting these compounds for phytotherapic studies. Another important conclusion is that neither extract showed toxicity, which is auspicious for using HSG as medicinal plant or for food purposes.
CONFLICT OF INTERESTS
The authors have not declared any conflict of interests.
ACKNOWLEDGMENTS
The authors appreciate CAPES, CNPq and FAPITEC for the financial support of this work.
REFERENCES
|
Agostini-Costa TS, Garruti DS, Lima L, Freire S, Abreu FAP, Feitosa T (1999). Methodological evaluation for the determination of tannin in cashew juice. Boletim Centro de Pesquisa de Processamento de Alimentos 17:167-176. |
|
|
Angelo PM, Jorge N (2007). Phenolic compounds in foods - A brief review. Revista do Instituto Adolfo Lutz 66:1-9. |
|
|
Assumpção CF, Bachiega P, Morzelle MC, Nelson DL, Ndianye EA, Rios AO, Souza EC (2014). Characterization. antioxidant potential and cytotoxic study of mangaba fruit. Ciência Rural 44:1927-1303. |
|
|
Azmir J, Zaidul ISM, Rahman MM, Sharif KM, Mohamed A, Sahna F, Jahurul MHA, Ghafoor K, Norulaini NAN, Omar AKM (2013). Techniques for extraction of bioactive compounds from plant materials: a review. Journal of Food Engineering 117:426-436. |
|
|
Bindes MMM, Reis MHM, Cardoso VL, Boffito DC (2019). Ultrasound-assisted extraction of bioactive compounds from green tea leaves and clarification with natural coagulants (chitosan and Moringa oleífera seeds). Ultrasonic Sonochemistry 51:111-119. |
|
|
Chemat F, Rombaut N, Sicaire AG, Meullemiestre A, Fabiano-Tixier AS, Abert-Vian M (2017). Ultrasound assisted extraction of food and natural products. Mechanisms. techniques. combinations. protocols and applications A Review. Ultrasonic Sonochemistry 34:540-560. |
|
|
Costa CF, Collevatti RG, Chaves LJ, Lima JS, Soares TN, Telles MPC (2017). Genetic diversity and fine-scale genetic structure in Hancornia speciosa Gomes (Apocynaceae). Biochemical System and Ecology 72:63-67. |
|
|
Djeridane A, Yousfi M, Nadjemi B, Boutassouna D, Stocker P, Vidal N (2006). Antioxidant activity of some Algerian medicinal plants extracts containing phenolic compounds. Food Chemistry 97:654-660. |
|
|
Formagio ASN, Volobuff CRF, Santiago M, Cardoso CAL, Vieira MC, Pereira ZV (2014). [Evaluation of antioxidant activity. total flavonoids. tannins and phenolic compounds in Psychotria leaf extracts. Antioxidants (Basel) 3:745-757. |
|
|
Ghorbani A (2017). Mechanisms of antidiabetic effects of flavonoid rutin. Biomedicine and Pharmacotherapy 96:305-312. |
|
|
Guardia T, Rotelli AE, Juarez AQ, Pelzer LE (2001). Anti-inflammatory properties of plant flavonoids. Effects of rutin. quercetin and hesperidin on adjuvant arthritis in rat. II. Pharmacology 56:683-687. |
|
|
Huie CW (2002). A review of modern sample-preparation techniques for the extraction and analysis of medicinal plants. Analytical and Bioanalytical Chemistry 373:23-30. |
|
|
Jacques RA, Freitas LS, Peres VF, Dariva C, Oliveira JV, Caramao EB. (2006). Chemical composition of mate tea leaves (Ilex paraguariensis): A study of extraction methods. Journal of Separation Science 29:2780-2784. |
|
|
Khoddami A, Wilkes MA, Robert TH (2013). Techniques for Analysis of Plants Phenolic Compounds. Molecules 18:2328-2375. |
|
|
Lacerda AM, Modolo AK, Matias RC, Pistori H, Yano M, Roel AR, Porto KRA (2011). Screening de plantas com potencial fitotóxico. Revista Brasileira de Farmácia 92:352-355. |
|
|
Lucetti DL, Lucetti EPC, Bandeira MAM, Vera HNH, Silva AH, Leal LKAM, Lopes AA, Alves VCC, Silva GS, Brito GA, Viana GB (2010). Anti-inflammatory effects and possible mechanism of action of lupeol acetate isolated from Himatanthus drasticus (Mart.) Plumel. Journal of Inflammation 7:60-71. |
|
|
Maciel MAM, Pinto AV, Veiga Jr VF (2002). Medicinal plants: the need for multidisciplinary scientific studies. Quimica Nova 25:429-438. |
|
|
Marinho DG, Alviano DS, Matheus, ME, Alviano CS, Fernandes PD (2011). The latex obtained from Hancornia speciosa Gomes possesses anti-inflammatory activity. Journal of Ethnopharmacology 135:530-537. |
|
|
Mason TJ, Paniwnyk L, Lorimer JP (1996). The uses of ultrasound in food technology. Ultrasonic Sonochemistry 3:5253-5360. |
|
|
Melecchi MIS, Peres VF, Dariva C, Zini CA, Abad FC, Marttinez MM, Caramao EB (2006) Optimization of the sonication extraction method of Hibiscus tiliaceus L. flowers. Ultrasonic Sonochemistry 13:242-250. |
|
|
Naveed M, Hejazi V, Abbas M, Kamboh AA, Khan GJ, Shumzaid M, Ahmad F, Babazadeh D, Fangfang X, Modarresi-Ghazani F, Wenhua L, Xiaohui L (2018). Chlorogenic acid (CGA): A pharmacological review and call for further research. Biomedicine and Pharmacotherapy 97:67-74. |
|
|
Okoye NN, Ajaghaku DL, Okeke HN, Ilodigwe EE, Nworu CS, Okoye FBC (2014). Beta-Amyrin and alpha-amyrin acetate isolated from the stem bark of Alstonia boonei display profound anti-inflammatory activity. Pharmceutical Biology 52:1-9. |
|
|
Patil DM, Akamanchi KG (2017). Ultrasound-assisted rapid extraction and kinetic modelling of influential factors: extraction of camptothecin from Nothapodytes nimmoniana plant. Ultrasonic Sonochemistry 37:582-591. |
|
|
Pereira AC, Pereira ABD, Moreira CCL, Botion LM, Lemos VS, Braga FC, Cortes SF (2015). Hancornia speciosa Gomes (Apocynaceae) as a potential anti-diabetic drug. Journal of Ethnopharmacology 161:30-35. |
|
|
Peres VF, Saffi J, Melecchi MIS, Abad FC, Jacques RA, Marttinez MM, Oliveira EC, Caramao EB (2006). Comparison of soxhlet, ultrasound-assisted and pressurized liquid extraction of terpenes, fatty acids and Vitamin E from Piper gaudichaudianum Kunth. Journal of Chromatography A 1105:115-118. |
|
|
Perk AA, hatynska-Mytsyk I, Gercek YC, BoztaÅŸ K, Yazgan M, Fayyaz S, Farooqi AA (2014). Rutin mediated targeting of signaling machinery in cancer cells. Cancer Cell International 14:124-128. |
|
|
Rego MT, Furtado AA, Bitencourt MAO, Lima MCJS, Andrade RCLC, Azevedo EP, Soares TC, Tomaz JC, Lopes NP, Silva Jr. AA, Zucolotto SM, Pedrosa MFF (2016). Anti-inflamatory activity of aqueous extract and bioactive compounds identified from the fruits of Hancornia speciosa Gomes (apocynaceae). BMC Complementary and Alternative Medicine 16:275. |
|
|
Roohinejad S, Kouba M, Barba FJ, Greiner R, Orlien V, Lebovka N (2016). Negative pressure cavitation extraction: A novel method for extraction of food bioactive compounds from plant materials. Trends of Food Science and Technology 52:98-108. |
|
|
Santos UP, Campos JF, Torquato HFV, Paredes-Gamero EJ, Carollo CA, Estevinho LM, Souza KP, Santos EL (2016). Antioxidant. antimicrobial. and cytotoxic properties as well as the phenolic content of the extract from Hancornia speciosa Gomes. PLOS ONE 11:1-19. |
|
|
Siddique HR, Saleem M (2011). Beneficial health effects of lupeol: a review of preclinical studies. Life Sciences 88:285-293. |
|
|
Silva AVC, Nascimento ALS, Soares ANR, Rabbani ARC, Silva Jr. JF, Ledo AS (2017). Identification and preliminary characterization of early fruiting mangabeira (Hancornia speciosa - Apocynaceae). Revista Agroambiente On-line 13:115-128. |
|
|
Silva GC, Braga FC, Lemos VS, Cortes SF (2016). Potent antihypertensive effect of Hancornia speciosa leaves extract. Phytomedicine 23:214-219. |
|
|
Stefanello MEA, Salvador MJ, Ito IY, Macar PAT (2006). Avaliação da atividade antimicrobiana e citotóxica de extratos de Gochnatia polymorpha ssp floccose. Brazilian Journal of Pharmacognosy 16:525-530. |
|
|
Tao Y, Sun DW (2013). Enhancement of food processes by ultrasound: a review. Critical Reviews in Food Science and Nutrition 55:570-594. |
|
|
Tsai FS, Lin LW, Lin CRWU (2016). Lupeol and Its Role in Chronic Diseases. In: Gupta S, Prasad S, Aggarwal B, (eds) Drug Discovery from Mother Nature. Advances in Experimental Medicine and Biology 929:146-175. |
|
|
Van Den Dool H, Kratz P (1963) A generalization of the retention index system including linear temperature programmed gas-liquid partition chromatography. Journal of Chromatography A 11:463-471. |
|
|
Veiga Jr VF, Pinto AC (2005). Medicinal plants: Safe cure? Quimica Nova 28:519-528. |
|
|
Zhang H (2011). Bioactive Natural Products: Detection. Isolation. and Structural Determination. Phytomedicine 18:902-903. |
|
Copyright © 2024 Author(s) retain the copyright of this article.
This article is published under the terms of the Creative Commons Attribution License 4.0


