Full Length Research Paper

ABSTRACT
Upland rice (Oryza sativa) is affected by several biotic and abiotic factors that limit the yield potential of cultivars. In relation to water deficiency, the development of drought tolerant and water efficient cultivars is a priority in breeding programs. With this study aimed to evaluate the agronomic behavior of upland rice lines subjected to different irrigations depths aiming for the selection of genotypes that are tolerant and responsive to water deficiency. Thirty-four recombinant inbreeded lines were evaluated in an experiment using supplementary sprinkling and in a dry test without additional irrigation during the 2015/2016 season. The characteristics evaluated were grain yield, water use efficiency, days for flowering, plant height, and occurrence of rice panicle blast, spikelets number per panicle and spikelet sterility. It was concluded that there were different behaviors of the lines in relation to the level of water that were submitted being possible the selection of genotypes responsive and tolerant to water deficit. Drought tolerance is a complex trait that involves several features in the plant development, being grain yield a good feature to be used by breeding experts to select genotypes, with a view to tolerance to water deficiency.
Key words: Oryza sativa, irrigations depths, drought tolerance, water deficiency, inbreed lines.
INTRODUCTION
Rice (Oryza sativa) stands out among cultivated cereals as one of the most important, as it constitutes the basic diet of more than 50% of the world's population (Sneyd, 2016). This cereal presents nutritional balance, an excellent source of energy, vitamins and proteins necessary for human growth, and considered the crop with the greatest potential to fight world’s hunger when production is increased. One of the great challenges of modern agriculture is to guarantee and maintain the cultivar’s yields regardless of climate change (Ceccarelli, 2014). The lack or limited availability of water is the main factor that restricts the yield and rarely occurs separately, since it frequently interacts with other abiotic factor (particularly extreme temperatures) and also with biotic stress (Bianchi et al., 2016).
An alternative for breeding aimed at drought tolerance would be through the phenotyping of secondary features that have a genetic association with grain yield, high heritability, stable (not associated with production loss when cultivated without water deficiency) and easily evaluated (De Moura et al., 2018).
Another important strategy would be conditioning drought tolerance as an objective trait as is made for grain yield, where it is considered an index, in which any change in the environment or in the genotype that influences the plant, reflects its value.
In literature, when working with drought tolerance, great emphasis has been given to water use efficiency (WUE). On the basis of this concept, it is verified that water use efficiency can be increased by incrementing rice yield, conserving or increasing proportionally less the amount of water applied, or by reducing this amount, conserving or reducing proportionally less yield, or also, by combining both alternatives (Stone, 2005). During the whole growth cycle, upland rice crop needs 600 to 700 mm of water (Stone, 2005), showing variations regarding its demand at different phenologic phases, meaning 30% at vegetative stage, 55% at reproductive stage and 15% at maturation stage. In some upland rice producing regions, especially in the savanna region, the occurrence of droughts is common during rainfall season. This phenomenon, due to water deficit, cause biochemical and physiological changes in plants that compromise essential functions linked to yield, promoting losses, especially when the stress coincides with the flowering stage in rice culture (Oliveira, 2017). This may cause flower infertility, lower number of grains per panicle and grain chalkiness (Taiz and Zeiger, 2013; Pierobon et al., 2016). The development of tolerant upland rice cultivars to water deficiency has strong social appeal, because it is unlikely that it will be possible to supply the increasing demand only with the production coming from irrigated systems, and the expectation is this natural resource could become scarcer in the future.
Considering this, genetic breeding of upland rice aimed at tolerance to water deficit has been prioritized the development and selection of genotypes that present such phenotypic features. Thus, as exposed, the aim of this study was to evaluate the agronomic behavior of upland rice lines submitted to different irrigation depths in order to select tolerant genotypes that would respond well to water deficiency or present efficient use of water.
MATERIALS AND METHODS
he experiments were conducted at the experimental unit of the Department of Agriculture of the campus of the Federal University of Lavras (UFLA), located in the city of Lavras, in the State of Minas Gerais. The experiments were carried out during the 2015/2016 season, sowed in December 2015 and harvested in March 2016, and divided into two. The first experiment, called "irrigation" (IRR), was carried out receiving supplementary irrigated throughout the entire development of the culture. In the second experiment, called "dry" (SEQ), there was no additional irrigation throughout the entire cycle of the cultivar. The water supplied came exclusively from rainfall. The water stress to which the experiments were subjected occurred depending on dry periods during the season.
The population evaluated in the experiments was composed of 34 upland rice recombinant inbreed lines (RIL's) in generation F9, derived from the crossbreeding between cultivars BRS Soberana and Douradão arising from the upland breeding program by the Brazilian Agricultural Research Agency (Embrapa), "Rice and Beans". These lines were classified in a previous experiment, carried out in Porangatu/GO, at EMATER/GO's phenotyping site for drought tolerance, during the winter crop of 2014. In this study, the population was composed of 223 RIL's of rice, with irrigation control and classified into 17 tolerant and 17 susceptible to water deficit, according to the yield found in both environments, classified as high and low water availability. In addition to the 34 lines, two controls were used: cultivars Douradão and BRS Soberana, which are the parental of the lines.
The design used in each experiment was that of incomplete blocks, in the form balanced of square lattice balanced with three replicates, totaling 36 treatments with 34 lines and two control cultivars. The experimental plot was constituted of three rows of 4.0 m lines spaced 0.35 m, and seeding density of 80 seeds per linear meter.
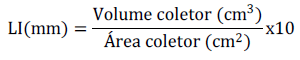
In both experiments, collectors were installed at every eight plots to record the amount of water received by each plot after irrigation and/or rainfall period. Rainfall calculation and quantity of irrigated water in the experiment were made by irrigation depth calculation (LI), in millimeters (mm), by rainfall test collector cups by Fabrimar®, aimed at water distribution uniformity tests in sprinkling systems. In this case, the LI (mm) is calculated by:
The other cultivation features used to carry out the experiments were the same recommended by rice culture in the regions evaluated, except chemical treatments for disease control, since these were evaluated in the experiment (Botelho et al., 2018). The following features were evaluated:
a) Grain yield (kg.ha-1): weight of the grains after harvest and drying to 13% humidity.
b) Water use efficiency (WUE) (kg.ha-1.mm-1): it was estimated the proportion that each millimeter of water results in average grain yield (kg.ha-1).
c) Number of days for flowering: obtained by the number of days from sowing to medium flowering, that is, when the plot presented approximately 50% of the plants with flowering panicles.
d) Plant height (centimeters): measured the distance from the soil end of the highest panicle of five randomized plants from the plot and calculated their average.
e) Occurrence of rice panicle blast: the severity of fungal disease was evaluated in the rice panicle blast culture (Pyricularia grisea).
f) Spikelets number per panicle: five panicles were collected from the central line of each plot by sampling to count the number of total spikelets, including fertile and infertile for each panicle;
g) Spikelet sterility: from the quantification and fertile and infertile spikelets, the infertility percentage was calculated.
After collecting data, individual and joint variance analyses were made (Cochran and Cox, 1957) by statistical software R CORE (2012) and MSTAT-C (1991). The variables measured were submitted to Pearson's phenotypic correlation analysis based on average data from the two environments used for joint analysis. The significance of the correlation coefficients was evaluated by Student's t-test (Cruz, 2013).
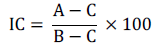
In order to evaluate experimental accuracy, the experimental variation coefficient (CV) was calculated for joint analysis in percentage (Resende and Duarte, 2007). Using the expression proposed by Hamblin and Zimmermann (1986), it was estimated the coincidence in the selection of the ten best progenies for grain yield and WUE.
On what:
A: number of genotypes among the ten best common both features;
B: number of genotypes selected (B=10);
C: expected number of common genotypes for grain yield and WUE, exclusively random, which equals 10% of B (C=1).
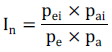
The water deficiency tolerance index (In) was calculated to aid in the discrimination the lines tolerant to water deficiency and responsive to improvements in environmental conditions, according to the following expression (Parentoni et al., 2001):
On what:
pei: average yield of line “i” in the experiment with supplementary irrigation;
pai: average yield of line “i” in the experiment without supplementary irrigation;
pe: average of all line in the experiment with supplementary irrigation;
pa: average of all line in the experiment without supplementary irrigation.
RESULTS
In relation to number of days for flowering, plant height, rice panicle blast incidence, spikelet sterility and spikelets number per panicle, the joint variance analyses in the experiments conducted were obtained in environments with supplementary irrigation and without supplementary irrigation (Table 1). CV (%) estimates were lower than 13% for all features, except for rice panicle blast incidence, with a value of 46.95%, and sterility of 38.33%.
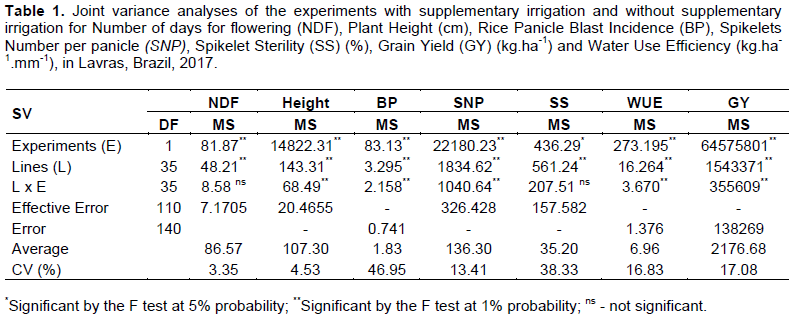
Several significant differences were detected, considering all features evaluated, for sources of variation "lines" and "experiments". Regarding the interaction lines x experiments, the features plant height, rice panicle blast incidence and spikelets number per panicle obtained significant differences. Figure 1 represents the average performance of lines for number of days for flowering, plant height, rice panicle blast incidence, spikelets number per panicle and spikelet sterility in the irrigated and without supplementary irrigation experiments.
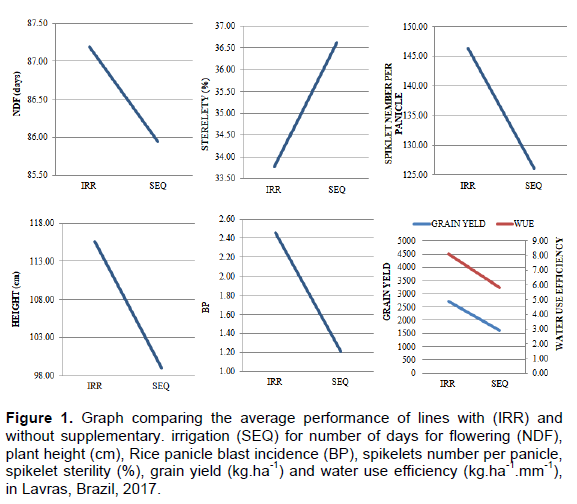
Considering the number of days for flowering, the average for cultivars irrigated experiment was 87 days and the ones in the without supplementary irrigated experiment needed 86 days.
Regarding plant height, the irrigation experiment presented average 115.6 cm and without supplementary irrigated experiment presented 98.99 cm, being that the reduction of this feature was of 16.57 cm considering the irrigated environment in comparison to the dry environment (Figure 1). In relation to rice panicle blast, the average severity of the disease, evaluated by grade assignment, was of 2.45 in the irrigated experiment and of 1.21 in the without supplementary irrigated experiment (Figure 1). In this study, other feature evaluated was the average total number of spikelets per panicle in the irrigation experiment was 146, relatively superior to the without supplementary irrigation experiment, which had an average 126 (Figure 1). Finally, considering spikelet sterility percentage, it can be observed that the average in the irrigation experiment was 33.78% and in the without supplementary irrigation experiment, it was of 36.62% (Figure 1).
The importance of the results and the discussion in this study can be understood by observing grain yield. For the irrigated experiment, the average value found was of 2723.45 kg.ha-1, while the without supplementary irrigated experiment obtained average yield of 1629.90 kg.ha-1. The summary of the joint variance analysis for irrigated and without supplementary irrigation is presented in Table 1. There was a significant difference between experiments (p≤0.01), confirming, as an essential fact to the present study, the presence of water deficiency in the experiment without supplementary irrigation. For sources of lines variation sources and lines x experiments interactions, significant differences were observed for grain yield (p ≤ 0.01).
On average, with supplementary irrigation, the amount of water was of 337.17 mm during the cycle of the culture, while in the experiment without supplementary irrigation, the volume of 279.12 mm of water was observed. In all of the lines, the grain yield values in irrigated experiments were higher when compared to those obtained by the without supplementary irrigated condition (Figure 1). It can be noted that the average grain yield estimation for lines in without supplementary irrigated was 40.15% lower when compared to what was observed irrigation conditions.
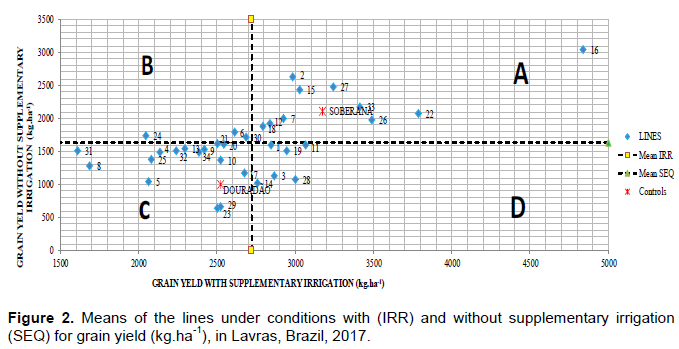
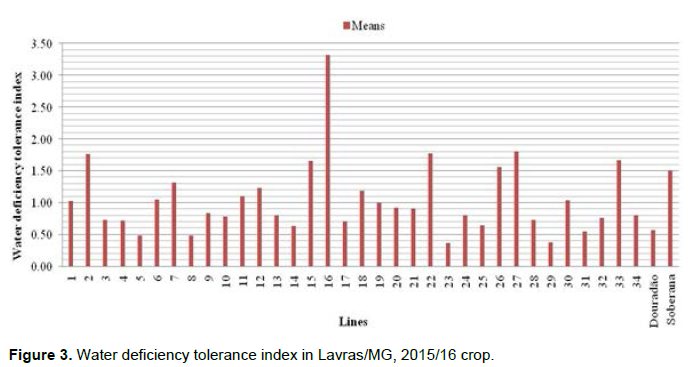
The Figure 2 illustrates a graphical dispersion of grain yield estimations to classify the lines according to their response to water restriction, considering the irrigation and without supplementary irrigation experiments. The lines presented in the quadrant “A” stands out, especially the line, when evaluated in favorable conditions, it presented grain yield estimation of 4837 kg.ha-1. Moreover, considering the experiment with water deficiency, it kept a favorable performance in upland conditions, with yield of 3043 kg.ha-1. The water deficiency tolerance index (In) was evaluated and the lines presenting the highest rates were 2, 16, 22, 27 and control Soberana, with estimations ranging from 1.51 to 3.32. Likewise, the lines with the lowest rates were 5, 8, 23, 29 and the Douradão cultivar (Figure 3).
According to water use efficiency (WUE) average data, it was observed that in IRR experiment, each millimeter of water generated 8.09 kg.ha-1 in upland rice grain yield. For the SEQ experiment, this same millimeter resulted in 5.84 kg.ha-1 (Figure 1). Regarding joint analysis, there was a significant difference considering the source of variation lines x experiments (Table 1). Regarding this fact, the lines that obtained superior WUE values in the experiment without supplementary irrigated when compared with irrigation stand out. Lines 2, 24 and 31 proved to be more efficient in grain production with lower water volume.
Still considering the WUE feature, it is important to stress, the phenotypic performance displayed by line 16, among all genotypes observed, it presented the highest WUE estimations, both in the IRR experiment (14.15 kg.ha-1. mm-1) and SEQ experiment (10.91 kg.ha-1.mm-1).
In order to verify the association between grain yield and water use efficiency, the coincidence in the selection of the ten best genotypes for grain yield and WUE was estimated. Considering the without supplementary irrigation experiment, there was 100% coincidence between the ten best genotypes, and in the irrigated environment, the estimation was 88.88%. From the results described previously regarding grain yield, water use efficiency and other secondary characteristics, these characteristics were analyzed for genetic correlation. Magnitudes and significance of genetic correlation are presented in Table 2.

DISCUSSION
About CV (%) estimations, the simple observation of the occurrence or the evaluation of the disease using subjective criteria is influenced by factors such as sample complexity, size and shape of the lesions, color and number, which most times induces error (Parker et al., 1995). Considering the number of days for flowering, Serraj et al. (2011) and Ndjiondjop et al. (2012) reported that the main direct consequences are delay in flowering and cycle increase when the rice strains are submitted to a certain water stress. According to Terra et al. (2015), a possible explanation could be the fact that the plants, in this condition, still do not present enough reserves of photoassimilates to flower and subsequently fill the grains.
Several authors have found significant reduction for plant height in upland rice genotypes that were submitted to water deficiency (Terra et al., 2013). Under water deficit conditions, the mitosis process is impaired and, consequently, it limits the cell division, elongation and expansion, which reduces the plant's organs growth and development. In relation to rice panicle blast (Pyricularia grisea) in the experiment with supplementary sprinkling, the bigger incidence of the disease could be explained by the fact that this is a fungal disease, which causes more sporulation in high humidity and temperature. Prabhu et al. (2002), oppositely, stated that rainfalls wash spores from the plants, thus decreasing the amount and dissemination of spores.
The result of spikelets number per panicle in upland rice allows assuming that the was a feature highly influenced by water deficiency. In literature, Ahmadikhah and Marufinia (2016) found an average reduction by 18 spikelets per panicle with the water deficiency.
According to Terra et al. (2013), the water stress stimulated spikelet sterility because, at the time of flowering, the pollen grain, in contact with the stigma, needs the existence of moisture in order to start emitting the pollen tube for posterior fertilization by the reproductive nuclei of the oosphere and polar nuclei, creating the embryo and the endosperm, respectively (Taiz and Zeiger, 2013). A big part of the studies assessing water deficiency in upland rice lines found higher spikelet sterility values in environments with water deficit (Serraj et al., 2011; Ndjiondjop et al., 2012; Terra et al., 2013).
The significant difference between experiments, initially, was expected because the occurrence of droughts periods from six to ten days is common during rainy season in regions classified as humid subtropical (Cwa) climates (Pinto et al., 2016). The effects of stress on yield are more significant in tropical than in subtropical climates (Silveira, 2018). The drought occurred while experiments were being carried out, during reproductive stage. The presence of interaction lines x experiments indicates different answers of lines to changes in experimental conditions, that is, the lines behaved differently in the experiments IRR and SEQ. Thus, the lines answered differently allowing the selection of the best ones, that is, tolerant and/or responsive genotypes.
The lines were classified in four groups in the proposed graph (Figure 2). Quadrant A shows the lines with superior average performance in both conditions, being tolerant to water stress as well as responsive, that is, presenting efficient performance and following the improvement in environmental conditions. Quadrant B shows the lines with relatively better performance only in water deficiency conditions, being tolerant but not responsive, that is, performance are below average with environment improvements. Quadrant C shows the lines with performance below average for both conditions in which the experiments were carried out, being classified as inefficient and non-responsive. Quadrant D shows the lines that are not tolerant and not responsive, as they have low yield in water deficiency conditions, but increase their average with the improvement of experimental conditions.
Considering this information, according to Figure 2, it is possible to select lines because of them surpassing the average national crop 2019/2020, which is of 2280 kg.ha-1 according to Conab (2020). Thus, line 16 is classified, within the genotypes evaluated, as the most tolerant and responsive, being a line that could be interesting for upland rice drought tolerance breeding programs.
In the rice crop, a commonly used index is proposed by Parentoní et al. (2001) to estimate the water deficiency tolerance index for each line (Figure 3). The fact of the lines can be attributed to the higher tolerance of lines under water deficiency conditions, for when comparing this index with the performance graph for both experiments; those that had the highest rate were classified as tolerant and responsive.
In literature, great emphasis has been attributed to what is called water use efficiency (WUE), which is a useful feature for breeders to analyze when selecting genotypes presenting the desirable phenotypic performance, even when submitted to water deficiency. According to Rocha et al. (2016), selecting genotypes tolerant to water deficiency must consider mechanism to reduce water loss while maintaining biomass production. Those values displayed by line 16 confirmed its classification as "responsive to water availability improvement" and "tolerant in the presence of water deficiency". According to Stone (2005), the WUE can be increased by agronomic breeding, which corresponds to incrementing rice yield by conserving or proportionally increasing the amount of water applied or by reducing the amount of water, which does not contribute for yield value, conserving this value or, also, combining both alternatives. In this paper, a yield increase was averagely observed with the increase of the applied irrigation depth.
It is observed that the concordance of WUE with the results using grain yield per se was very high and the high significant magnitude of the correlation illustrates the behavior of the previous results, allowing observing that grain yield per se is an extremely representative characteristic in evaluating genotypes tolerant to water deficiency. With regards to spikelet sterility, the behavior inversely proportional to grain yield and WUE is in accordance with Akinwale et al. (2011) and Castro et al., (2020) report that the largest spikelet sterility per panicle is correlated with yield decrease. It is worth highlighting the significant correlation and the magnitude of 0.72 between spikelets number per panicle and number of days for flowering, indicating that water deficiency, by promoting cycle elongation, results in a higher spikelets number per panicle. Some authors corroborate with this result (Akinwale et al., 2011). Finally, regarding rice panicle blast incidence and drought tolerance, it is possible to analyze that the negative and significant correlation of -0.39 of this feature with spikelet sterility allows to infer what some authors have already pointed out (Barrigossi et al., 2004) that the higher incidence of the fungal disease rice panicle blast reflects on spikelet filling.
CONCLUSIONS
The lines had different behaviors regarding the level of water depth to which they were submitted. It was possible to select responsive genotypes that are tolerant to water deficiency. Drought tolerance is a complex characteristic that involves several features in plants’ development. Grain yield with a good feature that can overcome water deficiency should be adopted by breeders when selecting genotypes in Upland rice breeding programs
CONFLICT OF INTERESTS
The authors have not declared any conflict of interests.
ACKNOWLEDGMENTS
To Institutions the Brazilian National Council for Scientific and Technological Development (CNPq), Coordination for the Improvement of Higher Education Personnel (CAPES), Foundation for Research Support of Minas Gerais (FAPEMIG), Brazilian Company of Agricultural Research (EMBRAPA), Agricultural Research Company of Minas Gerais (EPAMIG) and Federal University of Lavras (UFLA), for technical and financial support.
REFERENCES
|
Ahmadikhah A, Marufinia A (2016). Effect of reduced plant height on drought tolerance in rice. 3 Biotech 6(2):221. |
|
|
Akinwale MG, Gregorio G, Nwilene F, Akinyele BO, Ogunbayo SA, Odiyi AC (2011). Heritability and correlation coefficient analysis for yield and its components in rice (Oryza sativa L.). African Journal of Plant Science Biotechnology 5(3):207-212. |
|
|
Barrigossi JAF, Ferreira E, Lanna AC (2004). Panícula branca em arroz: o que causa? Embrapa Arroz e Feijão. Comunicado técnico. |
|
|
Bianchi L, Germino GH, De Almeida SM (2016). Adaptação das plantas ao déficit hídrico. Acta Iguazu 5(4):15-32. |
|
|
Botelho FBS, Soares PC, Castro AP, Torga PP, Reis MS, Rodrigues CS (2018). Melhoramento genético do arroz em Minas Gerais: avanços e perspectivas. In: Arroz: do campo à mesa. Informe Agropecuário, EPAMIG 39:301. |
|
|
Castro DG, Fernandes MCN, Félix MR, Cazassa RS, Tomé LM, Botelho FBS (2020). Estimativas de associação entre caracteres agronômicos na seleção de genótipos de arroz de terras altas. Magistra 30:359-367. |
|
|
Ceccarelli S (2014). Drought. In: Jackson M, Ford-lloyd B, Parry M L. Plant Genetic Resources and Climate Change. Boston 4(13):221-235. |
|
|
Cochran WG, Cox GM (1957). Some methods for the study of response surfaces. Experimental designs pp. 335-375. |
|
|
Conab. Companhia Nacional de Abastecimento (2020). Acompanhamento da Safra Brasileira. |
|
|
Core Team R (2012). R: A language and environment for statistical computing. Vienna, Austria. |
|
|
Cruz CD (2013). Genes: a software package for analysis in experimental statistics and quantitative genetics. Acta Scientiarum Agronomy 35(3):271-276. |
|
|
De Moura AM, Botelho F, Félix M, Da Silva CSC, Rosário Neto A, De Castro AP (2018). Efeito do déficit hídrico na esterilidade de espiguetas em arroz de terras altas. In Embrapa Arroz e Feijão-Resumo em anais de congresso (ALICE). In: International Symposium in Genetics and Plant Breeding, 22. 2018, Lavras. Anais. Lavras: Ed. UFLA. |
|
|
Hamblin J, Zimmermann MJDO (1996). Breeding common bean for yield in mixtures. Plant Breeding Reviews 4:245-272. |
|
|
Mstat-Cm. (1991). Micro statistical programme. Michigan State University, USA. |
|
|
Ndjiondjop MN, Futakuchi K, Cisse F, Baimey H, Bocco R (2012). Field evaluation of rice genotypes from the two cultivated species (Oryza sativa L. and Oryza glaberrima Steud.) and their interspecifics for tolerance to drought. Crop Science 52(2):524-538. |
|
|
Oliveira C (2017). Mudanças fisiológicas e moleculares na cultura do arroz e em plantas daninhas C3 e C4 submetidas a estresses abióticos. 2017. 166 f. Tese (Doutorado) - Programa de Pós-Graduação em Fitossanidade. Universidade Federal de Pelotas, Pelotas. |
|
|
Parentoni SN, Alves VMC, Milach SK, Cançado GMA, Bahia Filho AFC (2001). Melhoramento para tolerância ao alumínio como fator de adaptação a solos ácidos. Recursos genéticos e melhoramento-plantas. Fundação MT, Rondonópolis pp. 783-851. |
|
|
Parker SR, Shaw MW, Royle DJ (1995). The reliability of visual estimates of disease severity on cereal leaves. Plant Patholology 44(5):856-864. |
|
|
Pierobon F, Mendes MP, Santos HO, Lima IP, Rodrigues CS, Alves NB, Bruzi AT, Reis MS, Botelho FBS (2016). Occurrence of grain chalkiness in upland rice genotypes grown with and without irrigation. Internacional Journal of Current Research 8(2):26480-26483. |
|
|
Pinto MAB, Parfitt JMB, Timm LC, Faria LC, Scivittaro WB (2016). Produtividade de arroz irrigado por aspersão em terras baixas em função da disponibilidade de água e de atributos do solo. Pesquisa Agropecuária Brasileira 51(9):1584-1593. |
|
|
Prabhu AS, Guimarães CM, Silva GB (2002). Manejo de brusone no arroz de terras altas. Embrapa Arroz e Feijão. |
|
|
Resende MDV, Duarte JB (2007). Precisão e controle de qualidade em experimentos de avaliação de cultivares. Pesquisa Agropecuária Tropical 37(3):182-184. |
|
|
Rocha DK, Maciel GM, Junior EFF, Júnior CSM, Nogueira GGS, De Almeida RS (2016). Seleção de genótipos de tomateiro submetidos ao estresse hídrico em função da expressão de características fisiológicas. Revista Brasileira de Ciências Agrárias 11(2):80-84. |
|
|
Serraj R, Mcnally KL, Slamet-Loedin I, Kohli, A, Haefele SM, Atlin G, Kumar A (2011). Drought resistance improvement in rice: an integrated genetic and resource management strategy. Plant Production Science 14(1):1-14. |
|
|
Silveira RDD (2018). Estudos genômicos de tolerância à seca em arroz. Multi-Science Journal 1(1):62-69. |
|
|
Sneyd L (2016). Wild Food Consumption and Urban Food Security. In: Rapid Urbanisation, Urban Food Deserts and Food Security in Africa. Springer, Cham pp. 143-155. |
|
|
Stone LF (2005). Eficiência do uso da água na cultura do arroz irrigado. Embrapa Arroz e Feijão. |
|
|
Taiz L, Zeiger E (2013). Fisiologia vegetal, fifth ed Artmed, Porto Alegre. |
|
|
Terra TGR, De Barros Leal TCA, Borém A, Rangel PHN (2013). Tolerância de linhagens de arroz de terras altas à seca. Pesquisa Agropecuária Tropical 43(2):201-208. |
|
|
Terra TGR, De Barros Leal TCA, Rangel PHN, De Oliveira AB (2015). Características de tolerância à seca em genótipos de uma coleção nuclear de arroz de terras altas. Pesquisa Agropecuária Brasileira 50(9):788-796. |
|
Copyright © 2024 Author(s) retain the copyright of this article.
This article is published under the terms of the Creative Commons Attribution License 4.0


