ABSTRACT
The genotype x environment interaction (GEI) has an influence on the selection and recommendation of genotypes. To this end, G x E interaction and grain yield stability study was conducted for 17 advanced Ethiopian mustard across three districts (Sinana, Adaba and Agarfa) in the highlands of Bale zone during 2014 and 2015 main cropping season. Randomized complete block design with four replications was used. The combined analysis for the mean grain yield was highly significant (p≤0.01) for genotypes, environment and genotype x environment interaction. The mean seed yield of the locations was ranged from 0.9427 t ha-1 for Agarfa to 2.645 t ha-1 for Sinana in 2014. The Additive Main effects and Multiplicative Interaction (AMMI) analysis indicated that 76.7% of the GE sum squares was justified by the first two AMMI (AMMI1 and AMMI 2) components. The regression coefficient (bi) of genotypes ranged from 0.629 to 1.345. Genotypes G7 was the most stable with optimum grain yield (2.21 t ha-1), bi- value nearer to unity (bi = 1.03) and minimum value of deviation from regression (0.12). Based on the AMMI Stability Value (ASV), G12, G10, G17, G5, G3, G2, G7, and G8 showed the lowest ASV indicating as they are most stable. However the most stable genotypes would not necessarily give the highest yield. Therefore, based on mean grain yield and the result of stability parameters such as ASV, bi and Genotypes Selection Index (GSI), genotype G7 was found the best candidate variety and recommended for possible release for the test environments and similar agro-ecologies.
Key words: Additive Main effects and Multiplicative Interaction (AMMI), AMMI stability value (ASV), biplot, genotypes selection index (GSI), mustard, stability.
Brassica carinata L. (2n=34) is an amphidiploid (an allopolyploid behaving as a diploid) derived from an ancient cross between Brassica oleracea (2n=18) and Brassica nigra (2n=16) (Mabberley, 2008; Stace, 2010). Throughout most of Africa, where it is cultivated, it is used as leafy vegetable, but in Ethiopia, it is also grown for its seed oil (Mnzava and Schippers, 2007; NGRP, 2014; Taylor et al., 2010; Warwick et al., 2006). Wild forms of B. carinata have not been reported but there are diverse ecotypes (Alemayehu and Becker, 2002). The species is currently being bred to improve a variety of traits. B. carinata likely originated in Ethiopia a few thousand years ago (Mnzava and Schippers, 2007; Warwick et al., 2006). Its exact native distribution is not well understood because it has been cultivated for a long time in Africa; furthermore, it is often confused with Brassica juncea (Mnzava and Schippers, 2007). It is currently cultivated, native, and/or escaping from cultivation in many countries in Africa (Mnzava and Schippers, 2007). "Truly wild types are not known” (Mnzava and Schippers, 2007). The NGRP (2014) reports B. carinata as naturalized in Ethiopia, but because this is where the species is believed to have originated (Warwick et al., 2006). Stability of yield under different environments is an important concern in plant breeding programs.
The goal of plant breeders in crop improvement programs is to develop varieties, which are widely adapted to diversified environments. Some genotypes perform well in some environments but not so well in others (Dhillon et al., 1999). This variability in response is due to genotype by environment interaction (GEI). These interactions of genotypes with environments can be attributed to biotic and abiotic environmental stresses, like drought, temperature, rainfall, soil texture, pests and diseases. The adaptability of a variety over diverse environments is usually tested by its degree of interaction with different growing environments. A variety or genotype is considered to be more adaptive or stable if it has a high mean yield but low degree of fluctuation in yielding ability when grown over diverse environments (Falconer, 1981). Failure of genotypes to respond consistently to variable environmental conditions is attributed to GEI. Knowledge of GEI is advantageous to have a cultivar that gives consistently high yield in a broad range of environments and to increase efficiency of breeding program and selection of best genotypes. Therefore, this work was carried out to determine the adaptability and stability of mustard genotypes in the highlands of Bale zone, Southeastern, Ethiopia.
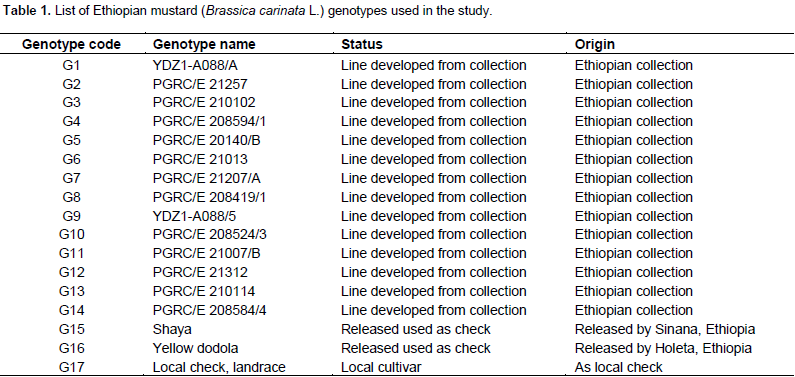
Seventeen mustard genotypes including two released varieties and local cultivar were evaluated for two consecutive years (2014 and 2015) at three locations (Sinana, Adaba and Agarfa) in the highlands of Bale zone, Ethiopia. Sinana Research Center (7° N latitude and 40°E longitude; 2400 m a.s.l.) is located at 463 km south east of Addis Ababa and East of Robe, the capital of Bale zone. The other location is located at 45 and 60 km from the capital zone of Bale in the Southwest direction. The genotypes were arranged using randomized complete block design with four replications with plot size of 7.2 m2 (6 rows at 30 cm spacing in rows of 4 m long). The four central rows used for data collection and as net harvest. The data will be subjected to individual location analysis to taste the homogeneity of the testing environment and combined analysis of variance using balanced analysis of variance (ANOVA) as well as the regression analysis was computed using Cropstat program. LSD is used for the mean separation of the genotypes evaluated. The additive main effect and multiplicative interaction (AMMI) analysis was performed using the model suggested by Crossa et al. (1991). The ASV is the distance from the coordinate point to the origin in a two dimensional of IPCA1 score against IPCA2 scores in the AMMI model (Purchase et al., 2000). This weight is calculated for each genotypes and environment according to the relative contribution of IPCA1 to IPCA2 to the interaction Sum of Squares as follows:
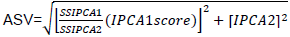
where

is the weight given to the IPCA1 value by dividing the IPCA1 sum squares by the IPCA2 sum of squares. The larger the IPCA score, either negative or positive, the more specifically adapted a genotype is to certain environments. Smaller IPCA score indicates a more stable genotype across environments.
Genotype selection index (GSI) was calculated for each genotype which incorporates both mean grain yield and stability index in single criteria (GSIi) as (Farshadfar and Sutka 2003):
GSIi= RYi +RASVi,
where GSI = genotype selection index, RYi = rank of mean grain yield, RASV = rank for the AMMI stability value for the genotypes.
AMMI analysis of mean seed yield for mustard genotypes
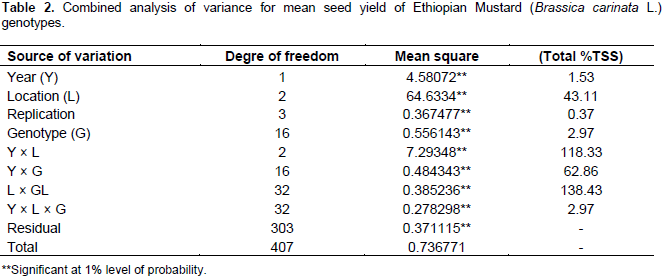
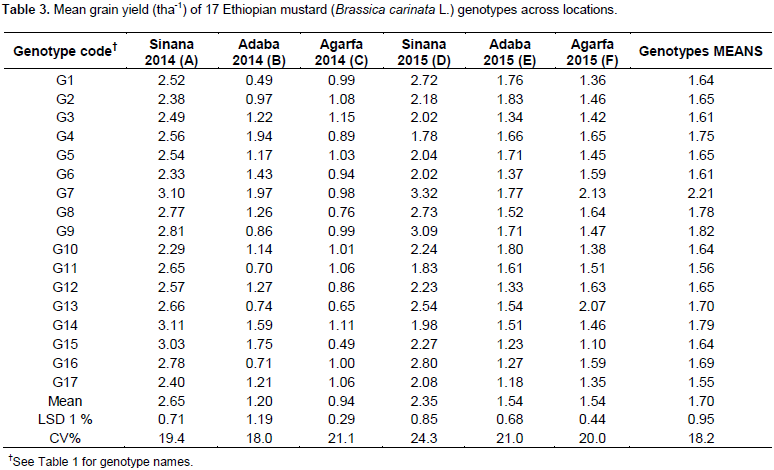
The analysis of variance for individual location revealed non-significant variation for most of the parameters used. The pooled analysis of variance for mean grain yield revealed (Table 2) high significant differences (P<0.01) for genotypes, environment and GE interaction. The same has been reported by Ali et al. (2001), Khan et al. (1988), Wani (1992), Aslam et al. (2015), and Maqbool et al. (2015). Such statistical interaction among the genotypes resulted from the change in the magnitudes of difference between genotypes from one environment to another. The significant GEI showed that seed yield ranking of genotypes was changed over the locations due to the presence of environment interaction indicating that the necessity of testing mustard genotypes at multiple locations. This shows the difficulties encountered by breeders for selecting new genotypes. These difficulties arise from the masking effects of variable environment (Goncalves et al., 2003). Mean comparison for the tested genotypes indicated that maximum grain yield was obtained from G7 (2.21 tha-1), followed by G9 (1.82 tha-1) and G8 (1.78 tha-1) whereas the least mean grain yield was obtained from G17 (1.55 tha-1). The highest yield was obtained from Sinana 2014 (2.65 tha-1), whereas the lowest yield was obtained from Agarfa 2014 (0.94 tha-1) (Table 3).


Regression analysis
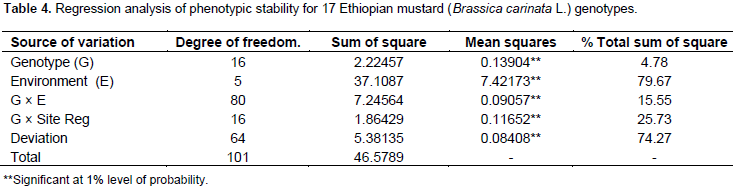
The regression analysis for 17 mustard genotypes grain yield (tha-1) tested in six environments shows that 79.67% of the total sum of square was attributed to the environmental effect, only 4.78% for genotypic effect and 15.55% for GE interaction effects (Table 4). The environments were diverse and caused the greatest variation in the mean grain yield. The GE interaction sum of squares was 3.25 times larger than that of the genotypic effect which determined substantial differences in genotypic response across environment. Similar result was reported by Tarakanovas and Rusgas (2006).

AMMI analysis
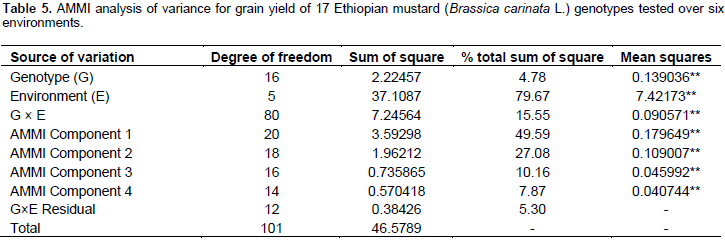
The results of the AMMI model were interpreted on the basis of two AMMI biplots, a biplot that showed the main and first interaction principal components analysis axis (IPCA) effects of both G and E and a biplot that showed the nominal yield (expected yield from the AMMI model equation without environmental deviation) of genotypes across IPCA 1 scores (Gauch and Zobel, 1997). Accordingly, the AMMI analysis of variance for the mean grain yield of the mustard genotypes tested across the studied environments revealed that significant variation was observed for genotypes, environment, and GE interaction (Table 5). The result of the AMMI analysis revealed that 49.59% of the GE interaction sum of squares accounted for AMMI 1, followed by AMMI 2 (27.08%), AMMI 3 (10.16%), and AMMI 4 (7.87%) (Table 5). The first two IPCA scores cumulatively accounted for 76.67% of the total GE interaction. This indicates the importance of undertaking GE interaction analysis when targeting the genotypes mustard to specific location. Furthermore, the use of the two AMMI model (AMMI 1 and AMMI 2) can best fit to justify the present sets of data (Table 5).

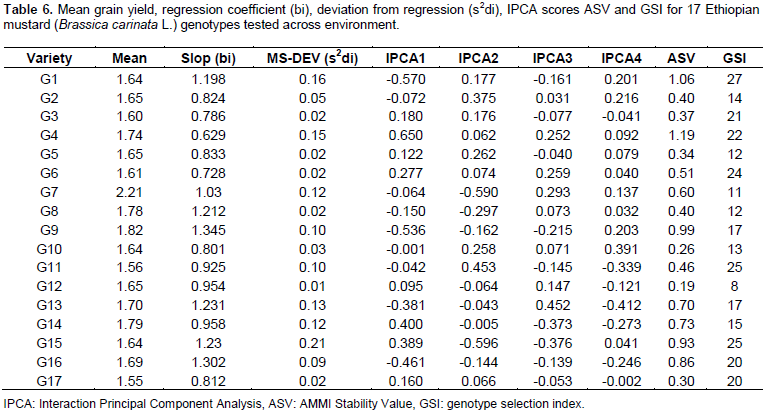
The stability parameters from seed yield were calculated for 17 B. carinata genotypes (Table 6). The regression coefficient (bi) of B. carinata genotypes ranged from 0.629 to 1.345. G9 had the highest regression coefficient (bi=1.345) followed by G16 (bi =1.306), the regression coefficient greater than unity (bi>1.0) indicated that these entries are suitable for favorable environments. The genotypes G11 (bi=0.925), G12 (bi=0.954) and G14 (bi=0.958), had regression coefficient lower than unity (bi<1) indicating that these entries are suitable for unfavorable environments. The G7 (bi=1.03) had regression coefficient close to unity and low deviation from regression indicated that this genotype is the most stable and well adaptive and suitable for commercial cultivation across the tested environments. Similar results have been reported by Ali et al. (2002).

AMMI stability value (ASV)
Furthermore, the ASV which is the distance from the coordinate point to the origin in a two dimensional scattergram of IPCA1 scores against IPCA2 score should also be seen to decide the stability of a genotypes (Purchase et al., 2000). In ASV method, genotype with least ASV score is the most stable. From this study, ASV discriminated genotypes G 12, G10, G17, G5, G3, G2, G8, and G7, as the stable genotypes (Table 6). However, since stability in itself should not be the only parameter for selection, as the most stable genotype would not necessarily gives the best yield performance (Mohammadi and Haghparast, 2007), hence, simultaneous consideration of grain yield and ASV in single non-parametric index is needed. Therefore, based on the GSI, G7 was considered as the most stable genotypes with high grain yield as compared to the others (Table 6).
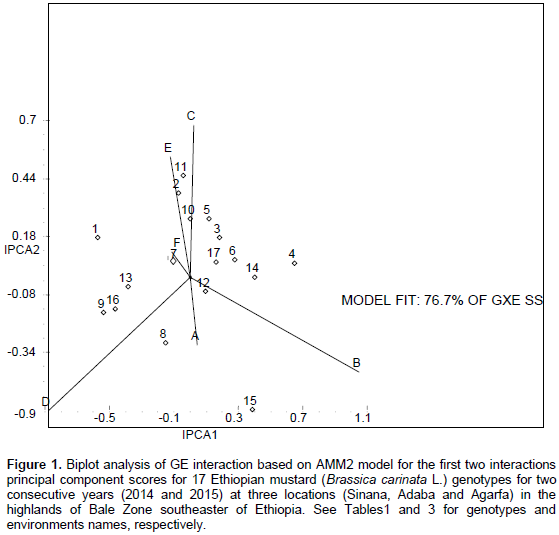
Biplot analysis
Figure 1 represents the AMMI biplot for grain yield of mustard varieties grown in six environments. The mean performance and PCA1 scores for both genotypes and environments used to construct the biplots are presented in Table 6. In AMMI biplot presentation, when a variety and environment have the same sign on PCA1 axis, their interaction is positive and if different their interaction is negative. If a variety or an environment has a PCA1 score of nearly zero, it has small interaction effects and was considered as stable over wide range of environments and genotypes, respectively. However, varieties with high mean performance and large PCA1 scores were considered as having specific adaptability to favorable environments. From this study, four genotypes G8, G15, G9 and G16 positively interacted with environments A, B and D, whereas other genotypes interact with these environments negatively. In similar fashion the rest of genotypes positively interacted with environments C, E and F. Those genotypes found around the origin are considered to be more stable. G4, G7, G8, G9 and G14 gave mean seed yield above the grand mean. However, regarding their stability, G4, G14, G8 and G9 were though they had high mean performance and these genotypes are more suited to specific environments, on the other hand, G7 which gave the highest grain yield and having lower GSI is considered as the most stable genotypes for all the environments under study.

This paper demonstrated the usefulness of AMMI model and biplot analyses in interpretation of grain yield data from a multi environment experiment in identifying stable genotypes. The AMMI model analysis provided estimates of the magnitude and significance of the effects of GE interaction and its interaction principal components relative to G and E effects. Stability and adaptability of genotypes were estimated through AMMI biplots. According to the results based on mean of grain yield, coefficient of regression and deviation from regression, ASV and GSI genotype 7 were the most stable and adaptable in all the studied environments and therefore selected for the possible release in the coming cropping season.
The authors have not declared any conflict of interests.
The authors would like to thank Oromia Agriculture Research Institute for financial support. Besides, the authors also thank Sinana Agriculture Research Center for providing the necessary support and Pulse and Oil Crops research case team staff for the entire trial management and data collection.
REFERENCES
|
Alemayehu N, Becker H (2002). Genotypic diversity and patterns of variation in a germplasm material of Ethiopian mustard (Brassica carinata A. Braun). Genet. Resour. Crop Evol. 49(6):573-582.
Crossref
|
|
|
|
Ali N, Javidfar F, Attry AA (2002). Stability analysis of seed yield in winter type rapeseed (Brassica napus) varieties. Pak. J. Bot. 34(2):151-155.
|
|
|
|
|
Ali N, Nawaz MS, Mirza MY, Hazara GR (2001). Stability analysis for pod yield in groundnut (Arachis hypogaea L.). Pak. J. Bot. 33:191-196.
|
|
|
|
|
Aslam M, Maqbool MA, Yaseen M, Zaman QU (2015). AMMI Biplot analysis for comparative evaluation of maize genotypes under different saline environments. Pak. J. Agric. Sci. 52:339-347.
|
|
|
|
|
Crossa J, Fox PN, Pfeiffer WH, Rajaram S, Gauch HG (1991). AMMI adjustment for statistical analysis of an interactional wheat yield trial. Theor. Appl. Genet. 81:27-37.
Crossref
|
|
|
|
|
Dhillon SS, Sing K, Bar KS (1999). Stability analysis of elite strain in Indian mustard. PAU, Regional Research station, Bathinda, India-151001.
|
|
|
|
|
Falconer DS (1981). Introduction to quantitative genetics. 2nd ed. Longman Group Limited, New York. 340p.
|
|
|
|
|
Farshadfar E, Sutka J (2003). Locating QTLs controlling adaptation in wheat using AMMI model. Cereal Res. Commun. 31:249-254.
|
|
|
|
|
Gauch, HG, Zobel Jr RW (1997). Identifying mega-environmentsand targeting genotypes. Crop Sci. 37:311-326.
Crossref
|
|
|
|
|
Goncalves P, Bartoletto N, Martins R, Gallo P (2003). Genotype x environment interaction and phenotypic stability for girth growth rubber yield of Hevea clones in Sao Paulo State, Brazil. Genet. Mol. Biol. 26:441-448.
Crossref
|
|
|
|
|
Khan, IA, Malik BA, Bashir M (1988). Investigation of genotype x environments interaction for seed yield in chickpea. Pak. J. Bot. 20:201-204.
|
|
|
|
|
Mabberley DJ (2008). Mabberley's Plant-Book: A Portable Dictionary of Plants, Their Classification and Uses (3rd edition). Cambridge University Press, New York. 1021p.
|
|
|
|
|
Maqbool MA, Aslam M, Ali H, Shah TM, Atta BM (2015). GGE biplot analysis based selection of superior chickpea (Cicer arietinum L.) inbred lines under variable water environments. Pak. J. Bot. 47:1901-1908.
|
|
|
|
|
Mnzava NA, Schippers RR (2007). Brassica carinata A. Braun.: Internetrecord from Plant Resources of Tropical Africa (PROTA), Protologue Flora 24: 267 (1841) OnlineDatabase. Wageningen University. http://www.prota4u. org.protav8
|
|
|
|
|
Mohammadi R, Haghparast R (2007) Biplot analysis of multi-environment trials for identification of winter wheat mega-environment in Iran. World J. Agric. Sci. 3:475-480.
|
|
|
|
|
National Genetic Resources Program (NGRP) (2014). Germplasm Resources Information Network (GRIN). United States Department of Agriculture, Agricultural Research Service.
View
|
|
|
|
|
Purchase JL, Hatting H Vandenventer CS (2000). Genotype x environment interaction of winter wheat in south Africa: II. Stability analysis of yield performance. South Afr. J. Plant Soil 17:101-107.
Crossref
|
|
|
|
|
Stace C (2010). New Flora of the British Isles (3rd ed.). Cambridge University Press, Cambridge, United Kingdom. 1130 p.
|
|
|
|
|
Tarakanovas P, Rusgas V (2006). Additive main effect and multiplicative interaction analysis of grain yield of wheat varieties in Lithuania. Agron. Res. 4:91-98.
|
|
|
|
|
Taylor DC, Falk KC, Palmer CD, Hammerlindl J, Babic V, Mietkiewska E, Jadhav A, Marillia EF, Francis T, Hoffman T, Giblin EM, Katavic V, Keller WA (2010). Brassica carinata - A new molecular farming platform for delivering bio-industrial oil feedstocks: Case studies of genetic modifications to improve very long-chain fatty acid and oil content in seeds. Biofuels, Bioprod. Biorefin. 4(5):538-561.
Crossref
|
|
|
|
|
Warwick SI, Gugel RK, McDonald T, Falk KC (2006). Genetic variation of Ethiopian mustard (Brassica carinata A. Braun) germplasm in western Canada. Genet. Resour. Crop Evol. 53(2):297-312.
Crossref
|
|
|
|
|
Wani SA (1992). Genotype x environment interaction for yield and its components in Indian mustard. Adv. Plant Sci. 5:421-425.
|
|


 is the weight given to the IPCA1 value by dividing the IPCA1 sum squares by the IPCA2 sum of squares. The larger the IPCA score, either negative or positive, the more specifically adapted a genotype is to certain environments. Smaller IPCA score indicates a more stable genotype across environments.