ABSTRACT
Genetic diversity is worthwhile for durum wheat breeding and consequently results in production of more efficient varieties under different conditions. Cluster analysis based on Euclidean distances was carried out with 21 durum wheat genotypes to assess the genetic diversity for agronomic and quality traits. The Unweighted Pair Group Average using Arithmetic Mean as linkage rule was used for the analysis of the distances between clusters. The genotypes were evaluated for 23 agronomic and quality traits and expressed ample genetic variability. The cluster analysis clutches 21 durum wheat genotypes into 3 main distinct clusters which imply the presence of substantial genetic diversity among the tested genotypes. The highest and lowest genetic distance was observed between local cultivar Var21 and advanced breeding line Var8 (12.5) and advanced breeding lines Var14 and Var15 (0.33) genotypes, respectively. From cluster mean values, genotypes in cluster 3 revealed wider genetic variations for both intra and inter cluster genetic dissimilarities and can be utilized for direct use as parents in hybridization programs to develop high yielding durum wheat varieties. Genotypes in cluster 3 have also showed genetic variation for quality traits and may be used for enhancement of protein and gluten contents and other desirable traits other than grain yield. It was also renowned that disparity of genotypes into different clusters was because of the small contribution and cumulative effect of a number of traits. The facts obtained from this finding can be exhaustively used to design crosses and boost the use of genetic diversity and manifestation of heterosis.
Key words: Agronomic traits, cluster analysis, durum wheat, genetic distances, quality traits.
Wheat mutually both the tetraploid (Triticum durum L.) and hexaploid (Triticum aestivum L.) are the high ranking cereal crops in Ethiopia, even though bread wheat is predominant. Most of the durum wheat varieties, grown in Ethiopia are landraces consisting of a large number of different genetic lines. Ethiopia was believed as the centre of origin for tetraploid wheat, however, the absenteeism of ancestral forms and wild relatives preclude Ethiopia as the centre of origin of cultivated durum wheat (Gashew et al., 2007). The high protein content and specific gluten properties make durum good for special uses. The most important use of durum wheat grain is for making semolina for use in pasta products. In North Africa, and particularly in Tunisia, durum is favored for the production of couscous and “burgul”, in addition to macaroni. Traditional breads are also made out of durum flour (Nefzaoui et al., 2014). Analysis of genetic diversity assembly by family in durum wheat is an important constituent of its improvement programs as it assists to provide information about genetic diversity and is a benchmark for stratified classification of breeding populations (Mohammadi and Prasanna, 2003). Genetic diversity of durum wheat corroborates its potential for improved efficiency and hence its use for breeding, which sooner or later may result in enhanced food production. Plant uniformity, which can be resulted by the use of modern plant breeding techniques, can yield plants, which are more effectual and enhanced resistance under different stresses (Khodadadi et al., 2011). A need to advance durum wheat varieties with a diverse genetic background and to integrate novel variability into the existing durum wheat gene pool is based on their genetic diversity studies.
The study of diversity among numerous traits is practical to plant breeders in deciding genotypes which possess groups of desired traits. Morphological characters and molecular markers of wheat can be useful for breeders to plan for convincing traits in diverse varieties of wheat that can be utilized in imminent breeding programs (Arora et al., 2014). Estimation of genetic distance is one of the applicable tools for parental selection in durum wheat for genetic recombination for potential yield increase. One of the important approaches to wheat breeding is hybridization and subsequent selection. Parents’ choice is the doorway in plant breeding program through genetic reconsolidation. In order to benefit from transgressive segregation, genetic divergence between parents is compulsory (Ahmad et al., 2014; Zamanianfard et al., 2015). The higher genetic distances between parents, the higher heterosis in progeny can be observed. Some methods like cluster analysis, principal component analysis and factor analysis for genetic diversity identification, parental selection, tracing the pathway to evolution of crops, centre of origin and diversity, and study interaction between the environment are currently available (Das et al., 2014). The cluster analysis is a suitable method for defining family relationships that is to deciding the extent of genetic affinity or distance of genotypes from each other (Mishra et al., 2015; Kumar et al., 2014). Various algorithms have been used in studying genetic diversity in cluster analysis. From the algorithms, Un-weighted Pair-Group Average using Arithmetic Mean (UPGMA), Ward’s, SLINK, and CLINK, applied for cluster analysis and exploring genetic diversity for grouping of plant materials in the past, UPGMA and Ward’s methods are the most popular approaches (Khodadadi et al., 2011).
Un-weighted Pair-Group Average using Arithmetic Mean (UPGMA) is the most valid statistical amalgamation rule in obedience with the connection of family based on their genetic relationship. Euclidean distance can theoretically estimate the genetic distance between parents to maximize the transgressive segregation because it measures the actual geometric distance between genotypes in the space (Hoque and Rahman, 2006). Euclidean or strait line measure of distance is the most commonly used for estimating genetic distance and tree clustering method between individual genotypes or populations by morphological data. Hence, in this investigation, improved, advanced breeding lines as well as local genotypes were used. An effort was made to generate information on ancestral relationships and their implication in selection of better genotypes of wheat for the development or improvement of cultivars and germplasm as well. The objectives of the experiment is to assess genetic relationship through their ancestors between Ethiopian durum wheat genotypes by using cluster analysis and characterize the genetic diversity of Ethiopian durum wheat genotypes using morphological traits and provide an insight to genetic diversity.
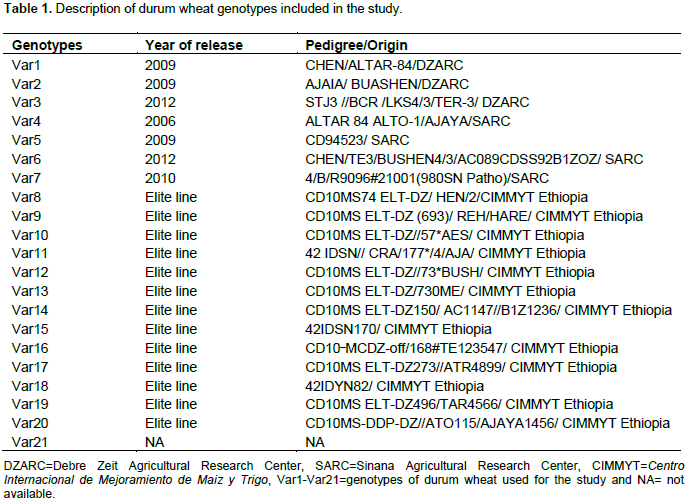
The plant material comprised of 13 advanced durum wheat breeding lines from CIMMYT Ethiopia, 4 released varieties from Sinana Agricultural Research Centre, 3 released varieties from Debre Zeit Agricultural Research Centre and one local variety (Table 1) were evaluated at Hera Liphitu on-farm research site of Yabello Pastoral and Dryland Agriculture Research Centre (YPDARC) during 2014 main cropping season. The experimental site is located at 05°84’281"N latitude and 038°25’990" E longitude and at an altitude of 2310 m.a.s.l. The annual rainfall is 750 mm and average annual minimum temperature is 8°C and the annual maximum temperature is 25°C. The experiment was arranged in Randomized Complete Block Design (RCBD) with three replications. The experimental plots consisted of six rows of 2.5 m length and 20 cm row space. The central four rows were harvested to estimate grain yield (3 m2). Observation on 23 agronomic and quality traits viz., days to heading, days to maturity, grain filling period, thousand kernels weight, grain yield per hectare, biological yield per plot, harvest index, plant height, effective tillers m-2, kernels spike-1, spikelets spike-1, peduncle length, spike length, ash content, vitresneous, sodium dodecyl sulfate sedimentation test, protein content, gluten content, zeleny index, gluten index, wet gluten content, dry gluten content and test weight were subjected to software for cluster analysis.
Clustering was made using the hierarchical cluster analysis. Euclidean distance was used to compute a matrix of distances (cluster distance measure) and the clustering (joining tree) between genotypes method was unweighted pair group average (UPGMA) using arithmetic mean. The distances (D2) for each pair of genotype combinations were computed using the following formula:
D2ij= (Xi–Xj)’S-1 (Xi–Xj), where: D2ij= the square distance between any two genotypes i and j, Xi and Xj=the vectors for the values for ith and jth genotypes, and S-1= the inverse of pooled variance covariance matrix. Average intra and inter-cluster D2 values were estimated using the formula:
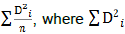
is the sum of distances between all possible combinations (n) of durum wheat genotypes included. Significance of the squared distances was tested against the tabulated
D2 values at P degree of freedom at 5% probability level, where P represents the number of traits used for clustering genotypes. Cluster analysis was carried out by using the STATISTICA version 12 software.
Cluster mean analysis
The analysis of genetic diversity through the cluster analysis has been shown in Figure 1. The Dendrogram was generated to examine the relationships among 21 durum wheat genotypes based on Euclidean distances. It was constructed on the basis of 23 agronomic and quality traits and divided the genotypes into three main groups by incision the Dendrogram at 8 units’ distance. Allotment pattern of all the genotypes into a range of various clusters showed the existence of large enough genetic divergence among the genotypes for the traits studied. This study illustrated the diversity of durum wheat among advanced breeding lines, released varieties and local cultivar and offered opportunities for using these genotypes for their desired traits in durum wheat breeding program to develop varieties for different agro-ecologies in Ethiopia (Singh et al., 2014; Zewdie et al., 2014). Similar genetic divergent studies by cluster analysis are reported by different authors Ali et al. (2008), Salem et al. (2008), Das et al. (2014) and Savii and Nadeala (2012). Cluster I comprised of one genotype Var1 that is a recently released variety in 2009 from Debre Zeit Agricultural Research Centre and characterized by early maturity, low thousand kernels weight and grain yield, medium protein and gluten content, high vitresneous, medium zeleny index, strong gluten index and medium test weight. The clustering of this genotype alone might occurred due to selection differential, genetic drift under diverse environmental conditions and further more genetic divergence due to its ancestors might be the major factor contributing to the disparity as reported by Verma et al. (2014).
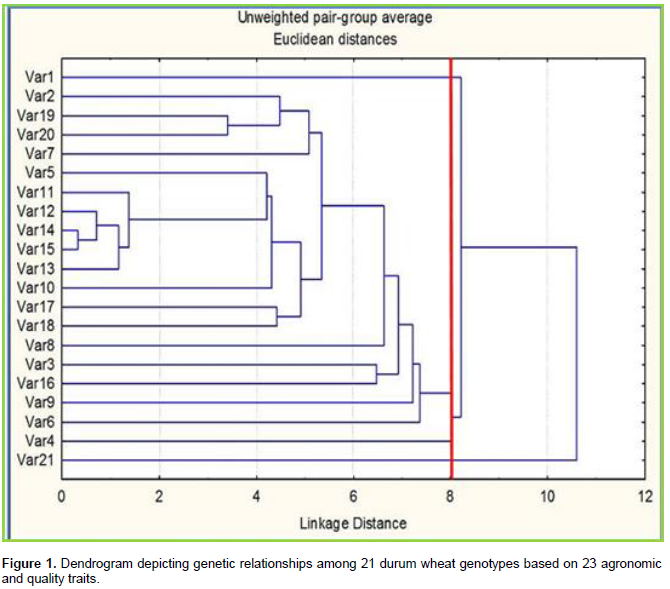
Cluster II was exceedingly diverse and encompasses about 90.5% (19) studied genotypes, Var2, Var19, Var20, Var7, Var5, Var11, Var12, Var14, Var15, Var13, Var10, Var17, Var15, Var8, Var3, Var16, Var9, Var6 and Var4. Six genotypes Var2, Var3, Var4, Var5, Var6 and Var7 are recently released varieties from Sinana and Debre Zeit Agricultural Research Centre and the rest are advanced genotypes of durum wheat from CIMMYT Ethiopia. In general, genotypes of this cluster are characterized from early maturing to late maturing, lowest to highest thousand kernels weight and grain yield, low to high gluten and protein content. In cluster II, Var16 is an advanced off-season breeding line from CIMMYT Ethiopia and the highest of all in thousand kernels weight and grain yield. This genotype also was characterized by medium protein and gluten content from durum wheat quality aspect. The CIMMYT/Ethiopia genotypes grouped together in cluster II may be due to not being intensively used for durum wheat improvement in Ethiopia and were distinct in the cluster analysis. This result suggested that there was partial relationship between the pedigrees/-origin and their divergence on the basis of all agronomic and quality traits studied. Kumar et al. (2014) also reported similar result of genetic divergent in wheat via cluster analysis. Cluster III comprised only one genotype Var21, local cultivar, had intermediate characteristics from both agronomic and durum wheat quality traits.
There is no clear reason why genotypes Var1 and Var21 appear to be rather isolated in different clusters, although Var21 is the local cultivar from the area. Within the advanced genotypes clustered together, there was a correspondence genetic distances. This suggested that germplasm collected from the same origin were not necessarily closely related and different regions did not essentially have different genetic background. In the present study, cluster II was more divergent, such circumstances could be due to the difference in genetic diversity in the base population of the germplasm, being spread in the country. This suggests that germplasm collected from the same region might have different genetic background. Similar findings were reported by Gashaw et al. (2007). In addition, the result advocate that crosses involving parents belonging to more divergent clusters would be expected to manifest maximum heterosis and wide variability in genetic architecture as reported by Daniel et al. (2012) and Singh et al. (2014). High yielding genotype from cluster II could be further tested for their combining ability and thus the genotypes present in different clusters can be hybridized to assemble desirable traits with higher heterotic potential as reported by Mishra et al. (2015).
Estimation of genetic dissimilarity
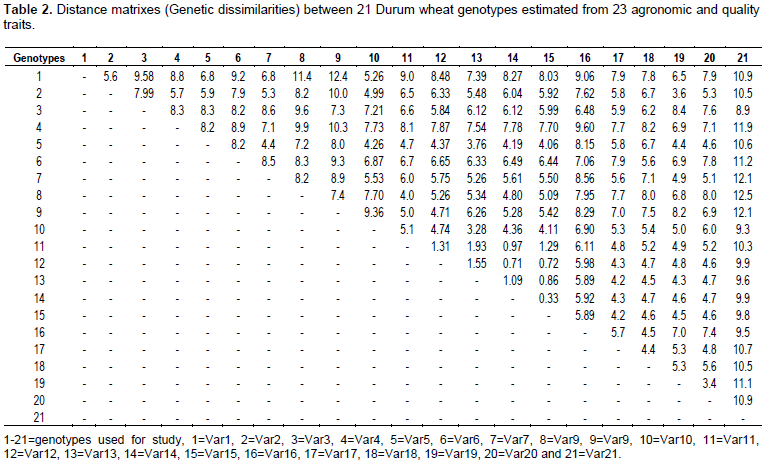
On the present finding, high degrees of genetic divergence was noticed both intra and inter cluster analysis of durum wheat genotypes. Estimation of the genetic distance between pairs of genotypes, calculated was presented in Table 2. The figures exhibited the highest range of genetic distance amongst 21 durum wheat genotypes studied grounded on 23 agronomic and quality traits. The largest genetic distance (12.5) was observed between the local cultivar (Var21) and advanced breeding line Var8 from CIMMYT/Ethiopia. The first is a local variety, tallest of all, late maturing type, and intermediate from both agronomic and quality traits, in contrast to the second (Var8) advanced breeding elite line which is characterized by low thousand kernels weight and grain yield, short plant height, high vitresneous, strong gluten index, medium gluten and protein content and low test weight. Nearly similar genetic distance (12.4) was observed between the released variety Var1 and advanced breeding line Var9 followed by (12.1) between local cultivar Var21 and Var9 and between released variety Var7 and local cultivar Var21 suggesting that they belongs to different gene pools as reported by Nefzaoui et al. (2014). This result revealed an extensive amount of divergence leading to cultivar identification, increased efficiency and speed of plant breeding programs, accelerated marker assisted selection (MAS) and permitted persistent progress in the advancement of selected genotypes (Iqbal et al., 2011). The lowest genetic distance 0.33 was observed between advanced breeding lines of CIMMYT Var14 and Var15 followed by 0.71 between Var12 and Var14 and 0.72 between Var12 and Var15 and 0.97 between Var11 and Var14. These genotypes are all advanced breeding lines from CIMMYT/Ethiopia and characterized by late maturing type, relatively low thousand kernels weight and grain yield, intermediate plant height, high protein content, low gluten content, strong gluten index and low test weight. This indicated that advanced breeding lines were relatively close and can be utilized for better protein content and other desirable traits than the improved varieties to obtain higher heterosis (Bousba et al., 2012). On the other hand, in some cases, the estimates of comparative genetic distances among genotypes entirely might correlate with their origins as suggested by Abera et al. (2014).
The knowledge about the genetic relationships of genotypes provides useful information to address breeding programs and germplasm resource management. In order to make the best utilization of genetic potential of genotypes for improvement of traits and for adaptation to various stress conditions, genetic study is very crucial. This study distinguished the level of diversity present in the genotypes and continuous genetic diversity assessment via cluster analysis will help to maintain the diverse of durum wheat for conservation and improvement. The results can also help the breeders so that they can effectively select the parents leading to progenies with high differentiation among them. In conclusion, any one of the methods might be used to study genetic diversity and genotype grouping by any approach would provide different information. The choice of genetic diversity analysis method depends largely upon the scope and the tools available to the researcher studies and may be used to evaluate genetic diversity and assess the genetic relationships between wheat genotypes with high accuracy. However, phenotypic traits are useful for preliminary, fast, simple, and inexpensive genotype identification and can be used as a general approach for assessing genetic diversity among different cultivars. Therefore, the classification obtained for these Ethiopian durum wheat genotypes, based on phenotypic traits will be a useful tool for breeders to plan crosses for positive agronomic and quality traits by choosing genotypes with appropriate diversity. This study suggested that molecular approaches using molecular markers with the strong environmental evidence will support phenotypic cluster analysis, and makes these traits relatively reliable and efficient for precise discrimination of closely related genotypes and the analysis of their genetic relationships. Further studies on the influence of environment and agronomic practices on the genetic potential of the varieties in different wheat environment are necessary to stratify the environments based on quality and yield suitability.
The authors have not declared any conflict of interests.
REFERENCES
|
Abera DZ, Orabi J, Jahoor A, Backes G (2014). Genetic diversity and structure found in samples of Eritrean bread wheat. Plant Genet. Resour. 12(1).
|
|
|
|
Ahmad HM, Awan SI, Aziz O, Ali MA (2014). Multivariative analysis of some metric traits in bread wheat (Triticum aestivum L.). Eur. J. Biotechnol. Biosci. 1(4):22-26.
|
|
|
|
|
Ali Y, Atta MB, Akhter J, Monneveux P, Lateef Z (2008). Genetic Variability, Association and Diversity Studies in Wheat (Triticum aestivum L.) Germplasm. Pak. J. Biotechnol. 40(5):2087-2097.
|
|
|
|
|
Arora A, Kundu S, Dilbaghi N, Sharma I, Tiwari R (2014). Population structure and genetic diversity among Indian wheat varieties using microsatellite (SSR) markers. Austr. J. Crop Sci. 8(9):1281-1289.
|
|
|
|
|
Bousba R, Baum M, Djekoune A, Labadidi S, Djighly A, Benbelkacem K, labhilili M, Gaboun F, Ykhlef N (2012). Screening for Drought Tolerance Using Molecular Markers and Phenotypic Diversity in Durum Wheat Genotypes. World Appl. Sci. J. 16(9):1219-1226.
|
|
|
|
|
Daniel H, Mebrahtom M, Tsige G (2012). Genetic Divergence Analysis on Some Bread Wheat Genotypes Grown in Ethiopia. J. Central Eur. Agric. 12(2):344-352.
|
|
|
|
|
Das B, Satyanarayana NH, Mukherjee S, Sarkar KK, Bengal W (2014). Genetic diversity of wheat genotypes based on principal component analysis in Gangetic alluvial soil of West Bengal. J. Crop Weed 10(2):104-107.
|
|
|
|
|
Gashaw A, Mohammed H, Singh H (2007). Genetic Divergence in Selected Durum Wheat Genotypes of Ethiopian Plasm. Afr. Crop Sci. J. 15(2):67-72.
|
|
|
|
|
Hoque M, Rahman L (2006). Estimation of Euclidian distance for different morpho-physiological characters in some wild and cultivated rice genotypes (Oryza sativa L.). Pak. J. Sci. 1:77-79.
|
|
|
|
|
Iqbal A, Ameen A, Nawaz S, Amjad M, Ali Z, Khan MA, Bukhari Y, Ahmed N (2011). Molecular characterization of Pakistani wheat cultivars using random markers. Afr. J. Biotechnol. 11(71):13571 -13575.
|
|
|
|
|
Khodadadi M, Fotokian MH, Miransari M (2011). Genetic diversity of wheat (Triticum aestivum L.) genotypes based on cluster and principal component analyses for breeding strategies. Aust. J. Crop Sci. 5(1):17.
|
|
|
|
|
Kumar V, Payasi DK, Saiprasad SV (2014). Genetic Divergence Analysis in Durum Wheat (Triticum durum L. Desf.) Int. J. Curr. Res. 6(6):7001-7005.
|
|
|
|
|
Mishra CN, Tiwari V, Kumar S, Gupta V, Kumar A, Sharma I (2015). Genetic Diversity and Genotype by Trait Analysis for Agromorphological and Physiological Traits of Wheat (Triticum aestivum L.). SABRAO J. Breed. Genet. 47(1):40-48.
|
|
|
|
|
Mohammadi SA, Prasanna BM (2003). Analysis of Genetic Diversity in Crop Plants-Salient Statistical Tools and Considerations. Crop Sci. 43:1235-1248.
Crossref
|
|
|
|
|
Nefzaoui M, Udupa SM, Gharbi MS, Bouhadida M, Iraqi D (2014). Molecular Diversity in Tunisian Durum Wheat Accessions Based on Microsatellite Markers Analysis. Rom. Agric. Res. 31:1222-4227.
|
|
|
|
|
Salem KFM, El-Zanaty AM, Esmail RM 2008. Assessing Wheat (Triticum aestivum L.) Genetic Diversity using Morphological Characters and Microsatellite Markers. World J. Agric. Sci. 4(5):538-544.
|
|
|
|
|
Savii G, Nedelea G (2012). Analysis of phenotypic diversity in winter wheat for some yield traits. J. Hortic. For. Biotechnol. 16(1):119-122.
|
|
|
|
|
Singh P, Singh AK, Sharma M, Salgotra SK (2014). Genetic divergence study in improved bread wheat varieties (Triticum aestivum). Afr. J. Agric. Res. 9(4):507-512.
Crossref
|
|
|
|
|
Verma PN, Singh BN, Singh G, Singh MK, Setter TL (2014). Genetic diversity analysis for yield and other agronomic traits in bread wheat under water logged sodic soil condition. J. Wheat Res. 6(1):51-58.
|
|
|
|
|
Zamanianfard Z, Etminan A, Mohammadi R, Shooshtari L (2015). Evaluation of Molecular Diversity of durum wheat genotypes using ISSR markers. Research Trend. In Biological Forum 7(1):214.
|
|
|
|
|
Zewdie B, Struik PC, Van Gastel JG (2014). Assessment of on-farm diversity of wheat varieties and landraces: Evidence from farmer's fields in Ethiopia. Afr. J. Agric. Res. 9(38):2948-2963.
Crossref
|
|


