ABSTRACT
Plants under hydrothermal stress show a variety of responses aimed at reducing leaf growth and total leaf area, thereby reducing physiological processes such as transpiration and photosynthesis. The effects of hydrothermal stress on cassava plant growth parameters were thus investigated. Twenty cassava varieties representing a broad range of genetic diversity were used. Plants were grown in the field, physical measurements were made and percentage changes in growth parameters and biomass accumulation recorded bimonthly. Significant variation among varieties was found for the response to stress of leaf growth rate (losses of between 60 and 100% after stress) and duration (losses within 1 to 2 months) which equally resulted into reduction in leaf area. Variations were also observed in leaf retention (0 to 40%) and expansion rate (lamina width (25 to 33%) and length (14 to 58%) among different varieties. Differences were also observed for the time and rate of leaf loss during stress period. Based on observed differences, varieties were grouped under three distinct clusters including early recovering varieties, stay green varieties and the susceptible varieties. Alterations in leaf properties were highly correlated to harvest index where low harvest index (0.2 to 0.4) was observed for stay green and susceptible varieties compared to early recovering varieties (0.4 to 0.7). From the observation, different coping mechanisms, important in selection of drought stress tolerant genotypes were identified and pointed to specific genetic mechanisms for leaf retention/loss and biomass accumulation. The results suggest that rate of growth and duration differences are due to different physiological mechanisms, and can be combined to select for hydrothermal stress tolerant varieties.
Key words: Leaf expansion rate, leaf area, leaf development, recovery mechanisms.
Plants respond to abiotic stresses, in part through the reduction of physiological processes (transpiration,
photosynthesis and respiration) which can be can be achieved by morphological adjustments such as stomatal closure (Tardieu and Davies, 1993), leaf wilting and leaf rolling (O’Toole and Cruz, 1980). Understanding morphological trait adjustments during cassava growth is thus essential in elucidating how environmental stress affects plant growth and development components. In addition, common stress tolerance mechanisms involve reductions in leaf and shoots growth which are genetically determined, but are highly influenced by the environment (Kaplan, 2001). Therefore, their behavior can explain observed changes in plant structure in response to changes in environment. Notably, changes in leaf area under stress can be a consequence of reduced leaf number and/or reduced area of individual leaves (Aguirreza´bal, 2006; Kaplan, 2001) which in turn leads to reduction of leaf growth, a factor that is influenced by decreased cell division (Schuppler et al., 1998; Granier et al., 2000), cell wall hardening (Neumann, 1995), and decreased turgor (Hsiao et al., 1998).
The extent of leaf growth reduction in response to stress is an important factor in determining the adaptation of a certain plant or variety to an environmental scenario. As observed in some plants, prolonged drought leads to reduced leaf growth but plants are more likely to reach maturity with considerable yield. On the other hand, during short-term water deficits, a plant which maintains leaf growth is likely to have higher yields (Blum, 2005). This too is observed under thermal stress which results in total leaf morphology shift as observed by Guerin et al. (2012). Architectural changes during growths, which are related to such limitations as abiotic stresses or translocation of water and nutrients, can therefore decrease or, increase the effects of physiological changes on the functioning of entire plants (Valladares and Pearcy, 1999; Zotz et al., 2002). Such scenarios point to an internal genetic control mechanism that allows cassava to adapt to changes in environment. It also points to a well regulated gene expression network allowing plants to respond appropriately to hydrothermal stress.
Since the photosynthetic performance of vascular plants depends on plant and leaf size (Schmidt and Zotz 2001), changes in leaf related parameters such as leaf area, leaf size and leaf numbers are likely to influence net productivity of the plant and related plant processes such as cell expansion, physiology and development. Usually changes in plant size result into changes in leaf shape although changes in leaf sizes and leaf architecture may be mediated by the effects of the environment. In addition, changes in the leaf area index are not only affected by the age of the plant but by other environmental factors such as photosynthetic light flux and temperature (Zotz et al., 2002). This implies that occurrence of hydrothermal stress has a negative impact on leaf development and related processes such as nitrogen use efficiency and carbon partitioning which determine the photosynthetic potential of the leaf and hence its broad functioning (Katahata et al., 2007).
A plant can maintain its leaf area by maintaining its growth rate (Salekdeh et al., 2009; Blum, 2005) or by increasing the duration of leaf growth (Aguirreza´bal , 2006) both of which have the benefit of increasing the opportunity for recovery after offset of stress (Alves and Setter, 2004). However, changes in the moisture and temperature regimes over a certain period may result into failure of the plant to uphold its growth rate hence reducing the plant size. In a number of crops (Fasehun, 1979) low soil moisture results into dehydration or loss of cell water and hence cell death or inactivity (Osorio et al., 1998). Water deficits, important causes of dehydration, result into reduced branching, leaf production and leaf expansion which result into reduced biomass (Osorio et al., 1998) and reduced photosynthetic capabilities (Seyed et al., 2012). This could be attributed to dehydration that results into altered biomass allocation and changes in the translocation/evapo-transpiration processes. Thus, acclimatization to dehydration stress may trigger avoidance mechanisms which in turn protect the plant from dehydration stresses (Seyed et al., 2012). In particular, loss in turgor in the leaves results into surface area reduction hence reduced leaf size (Salekdeh et al., 2009), a stress tolerance/avoidance strategy. Hence, different plants will respond differently to such changes where the responses are mediated by the plants’ genetic makeup. This genetic variability in leaf growth and development could be used to develop crop varieties adapted to specific stress scenarios. However, breeding for these traits is not a common approach for obtaining drought resistance in crop species because of a lack of well-characterized source of genetic variability. This study seeks to address this concern by providing relevant phenotypic information to explain the genetic variability observed.
In studies on the effect of temperature on leafy vegetative parts of the plants, it has been established that increase in temperature results into increased senescence of floral and leafy parts with more than 50% reductions observed in flowery parts compared to the leafy parts (Yin and Kropff, 1996). Temperatures slightly below the optimal growth temperatures result into increased leaf area, dry weight and thickness (Shin et al., 2001). For tropical plants, temperatures slightly above optimal growth temperatures may mean increased photosynthesis for the leaves although this may result into loss in dry weight (Boese and Huner, 1990) which later affects the plants ability to produce metabolites for storage or yield and accelerates aging. Thus, thermal stress negative effects on biomass and reductions observed are a result of modifications in the plants developmental organs which help the plant in offsetting the effects of the stress. This protects the plant from succumbing to cumulative stress as observed for most abiotic stresses (Salekdeh et al. 2009). In addition, when there is an interaction between water and heat stress (hydrothermal stress), plant growth and development may be severely compromised.
The changes in plant growth respond to water deficit and high temperatures as discussed above have not been studied in cassava. At this point and with the changes in climate anticipated, it is required that the analysis of cell- and leaf-level responses to water deficit and increased temperature in regard to plant growth traits be understood. Since radiation interception, as well as photosynthesis and transpiration, are largely affected by water availability and temperatures, the effects of these factors on primary morphological sites for physiological process need to be understood. Thus, the objective of this work was to analyze the response of leaf growth to water deficit and increased temperature in several cassava genotypes in order to identify and quantitatively describe sources of phenotypic variability for these drought tolerance determinant traits.
Twenty varieties of cassava were selected based on their dry matter content, resistance to Cassava Mosaic Disease (CMD) and farmer preference and established in a Randomized Complete Block Design (RCBD) in Kasese, Western Uganda. The varieties included local farmer preferred varieties such as Nyaraboke, Kwatamumpale, Mpologoma, Bao, Bukalasa, Mercury, Magana, Rugogoma and Gwalanda. These varieties have good eating qualities, are very amenable to processing, show a specific level of tolerance to cassava mosaic disease and are said to be adapted to dry conditions. The elite varieties selected included NASE 1, NASE 2, NASE 3, NASE 12, TME 204, I/92/00067, MH96/0068 which combine tolerance to drought with CMD resistance, high dry matter content and good processing traits. In particular, variety MH96/0068 was selected in a study by Turyagyenda et al. (2013) as one of the stay green varieties with high levels of tolerance to water stress. The newly released varieties NASE 13, NASE 14, NASE 16 and NASE 19 are farmer preferred elite varieties recently released and have shown some level of resilience to drought stress. These varieties combine high dry matter contents and high yield with resistance to CMD, tolerance to CBSD and a recommendable level of resistance to abiotic stresses. However, they have not been screened thoroughly for their resistance to hydrothermal stress and no recommendations so far can be made in this effect to the farmers using these varieties. The trial consisted of two experimental and two control blocks in 81M2 plots, with up to 81 plants per plot. The plant responses to available conditions were monitored on a bimonthly basis where changes in leaf properties and plant growth parameters were recorded. Weather and location characteristics were also recorded during the trial period.
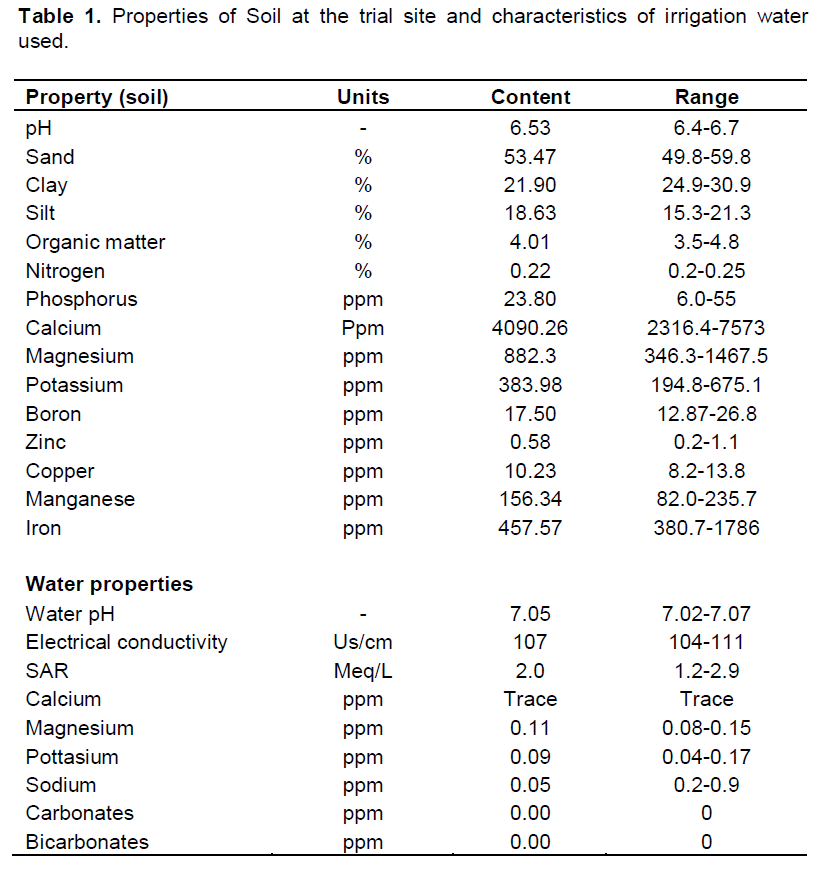
Soil properties, water properties and weather characteristics of the trial site
Properties including soil pH, organic matter, and minerals such as Nitrogen, Phosphorus, Calcium, Potassium, Boron, Zinc, Copper, Manganese, Iron, and Magnesium were investigated in terms of their quantities. Soil components such as silt, sand and clay were determined. Properties of the irrigation water to be used such as salinity and pH were also determined.
Weather patterns for the trial site were monitored during the trial period. This allowed the forecasting and determination of periods of critical soil moisture stress and increased air temperatures and factors that affect changes in these two properties that make hydrothermal stress. Important parameters affecting the relative humidity and soil water availability were considered. Daily rain fall patterns were recorded in addition to hourly temperature regimes throughout the stress period. The relative humidity was also recorded on an hourly basis. These were averaged on a monthly basis and used to make inferences on how the plant reacted to different environmental changes during its growth cycle.
Description of planting date and developmental cycles of cassava with rainfall pattern
In order to synchronize the data collection schedule with impending forecasted weather conditions, a specific date for planting the trial was chosen. The choice of the planting date was dependent on the developmental cycle of cassava plants and considerations for parameters to be studied at different times in the crop growth cycle. Planting was carried out in the first season representing a time of maximal rainfall during April to allow the plant to fully establish in the high moisture regimes and favorable temperatures at that time. Initial hydrothermal stress was experienced in the low rainfall period (June to August), allowing studies into the effect of stress and how it affects plant growth and development. This was followed by favorable moisture and temperature conditions between September and November allowing unaltered crop growth and root bulking coupled to maximum canopy development for the crop. The final stage of root bulking fell into a hydrothermal stress period between December and March affecting the plants canopy and its stored reserves.
Determination of leaf properties
During the plant growth cycle, the rate of growth and development was determined by direct measurements of leaf related properties and the changes thereof used to compare differences in plant growth and developments. Leaf properties were determined by direct measurements on the 5th most fully expanded leaf on each plant at a specific time. Leaf length, leaf width, petiole length, and plant height were measured using a measuring tape (Stanley 33-115, Power Lock, England) and the different measurements recorded in centimeters. For leaf lobe length and width, the centrally positioned leaf lobe on the 5th leaf was considered. This was meant to harmonize the different measurements taken. Numerical counting was used for leaf lobe numbers of the 5th fully expanded leaf and whole plant leaf numbers. Cumulative changes in leaf numbers and leaf characteristics were recorded over the 12 month growth period. These were compared across the three broad phenotypic manifestations observed during growth. In addition, changes in particular leaf properties with growth time were also recorded. Mean values for each property was determined from replicated observations on six plants per plot. Variations in these properties were then determined using the analysis of variance. Summary statistics (means, and standard deviations) were computed for leaf, soil and water properties. For each of the leaf properties, values for the fifteen replicate leaves in each replication were averaged to produce a mean for each of the varieties. Means were computed for cumulative changes in each leaf property to produce mean trends for each variety across the growing period. Subsequently, variables were averaged across all varieties and within each phenotypic class for trend evaluation. The significance (P > 0.05) of mean differences among variety groups was determined by analysis of variance (GenStat Discovery Edition, 2012).
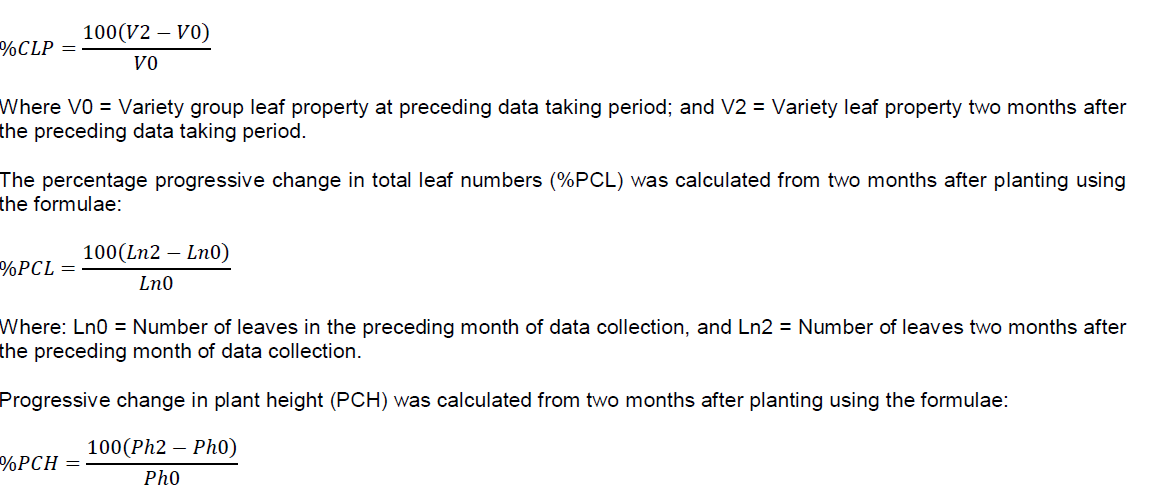
Cumulative Leaf Percentage change (%CLP) in the different leaf properties was calculated using the formulae below:
Where: Ph0 = Plant height in the preceding month of data collection, and Ph2 = Plant height two months after the preceding month of data collection.
Harvest index and related parameters
To determine the overall effect of the hydrothermal stress on cassava yield and the differences among the varieties of cassava used in this study, the harvest index and related yield parameters were investigated. Harvest index was determined as the ratio of the weight of the root to the weight of the shoot for six plants in each plot in three replications. Total root number for each plant was recorded and cortex thickness determined for at least six commercial roots from each plot. In addition, the branching length and stem diameter were also determined by measurement.
Statistical analysis
Mean values for each of the properties were generated from the analysis of results using Microsoft excel software. The standard deviations and standard error were used to compare the variety characteristics across a given parameter. Analysis of variance and correlations among study parameters for all the test varieties were computed using the GenStat software (Genstat, discovery edition, 2012) and used to study the effect of above plant biomass on the yield components of the plant. Regression analyses and correlation analyses were employed to determine overall relationships among leaf properties and harvest parameters.
Soil, water and weather characteristics
Soil and water properties were determined for the trial site to understand the suitability of the site for a hydrothermal stress screening experiment. It was also important in understanding the water retention properties of the soil, mineral and nutrient availability and the suitability of the water for irrigating the control plots.
These properties are presented in Table 1. Soil pH ranged from 6.5 to 6.7 and was in the required range for growth and development of cassava as earlier suggested by Alves and Setter (2004). The water pH was also at neutrality ranging from 7.01 to 7.07. The average percentage of sand (53.47%) was twice as much as the percentage of clay (21.9%) and silt (18.63%) showing that the soil at the trial site could be easily drained and with very low capacity to hold water for a long time appropriate for drought screening. A high organic matter content (3.5 to 4.8%) and Nitrogen content 0.2 to 0.25% was observed which was appropriate for vegetative growth. Other elements such as phosphorus, Calcium, Magnesium, Potassium, Boron, Zinc, Copper, Manganese, and Iron fell in the recommended range for plant growth. The electrical conductivity of the irrigation water ranged from 104 to 111 µs/cm while the water contained low amounts of minerals such as calcium, magnesium, and potassium which ranged from trace to 0.17 ppm. The water also did not contain either carbonates or bicarbonates hence the near neutral pH observed.
Weather characteristics
The main determinant weather characteristics were recorded to show the relationships between weather characteristics and how they varied during the experimental period. The values are presented in Figure 2F. The trial was planted in April at a time when a considerable amount of rainfall and hence humidity was available to allow for crop establishment. By June (at two months after planting), the experiment was established. Between August and October, high rainfall hence increments in humidity were realized allowing the trial to fully establish and the plants to root and bulk. By the onset of stress in the month of December, the plants had already developed roots and had substantial reserves in the storage roots. Stress was characterized by reductions in rainfall and humidity and increments in temperature for a period of 12 weeks between the month of December and March (Figure 2F). Peak stress was characterized by increased temperature and reduced humidity experienced mid-January up to beginning of March for a period of 7 to 8 weeks. This was reversed with increased rainfall and moisture experienced in March and April (Figure 2F).
Phenotypic grouping of the varieties
Based on observed phenotypic characteristics, varieties were ranked according to their ability to retain leaves or recover leaves during and after the hydrothermal stress period (Plate 1). The groupings included varieties that maintained a moderately high Leaf Area Index (LAI) during hydrothermal stress or stay green varieties (SGV).
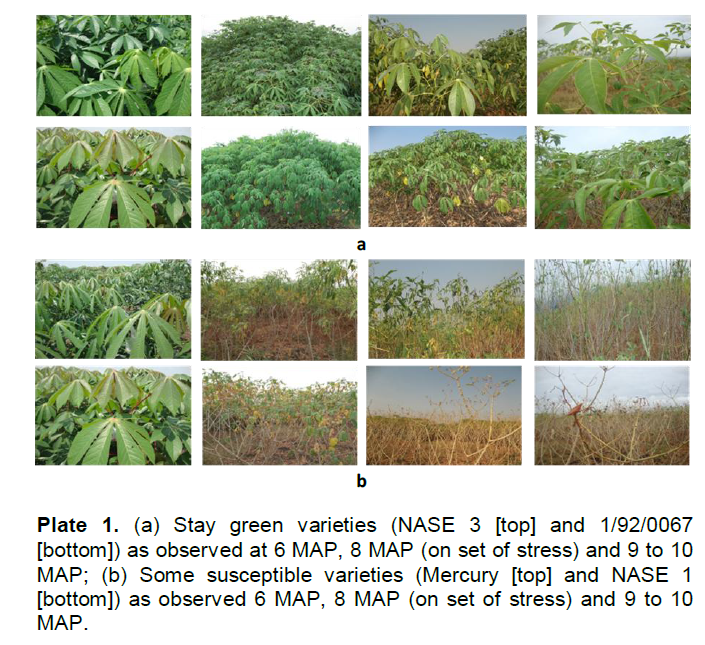
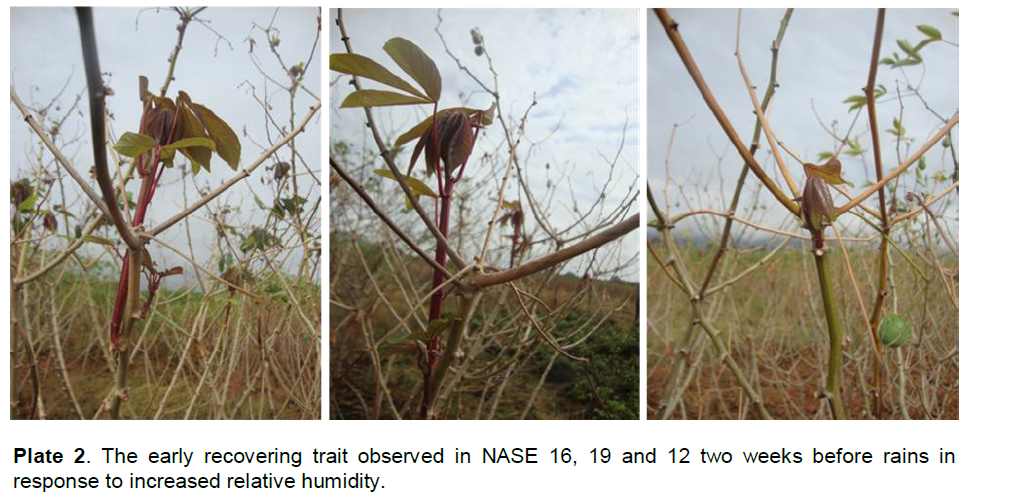
These included varieties such as NASE 2, NASE 3, MH96/0686, I/92/0067 and the local variety Magana. However, some varieties completely lost leaves as stress progressed and even the remaining leaves during stress were dechloropyllated and yellow signifying losses in chlorophyll and related pigments hence little or no capacity to photosynthesize. These varieties showed little or no capacity to recover easily after stress and they were labeled susceptible varieties (SV). They included varieties such as NASE 1, Rugogoma and Mercury. The other grouping included varieties that lost all their leaves immediately after onset of stress only to recover immediately with increase in relative humidity or early recovering varieties (ERV). They included NASE 16, NASE 19 and Bukalasa (Plate 2). Some varieties had both mechanisms but were not very pronounced in each case.
Cumulative changes in leaf properties over the growth period
For determination of the differences in the rate of growth and development among the cassava varieties used in this study, cumulative changes in leaf properties were determined and the results obtained are presented in Table 2. Significant differences were observed for petiole length among variety groups at 4 months after planting where the early recovering varieties had the highest cumulative petiole length growth observed. Stay green varieties had low cumulative petiole growth even at 4 months after planting. Negative cumulative increase in petiole length at 8 months after planting coincided with onset of stress. Highest reductions were observed for susceptible varieties (-22.4%) and the lowest for stay green varieties (-13.4%) at the end of the critical stress period. At 9 months after planting, the early recovering varieties had lost almost all leaves only to recover them a month later (Table 2). At twelve months after planting, (one month post recovery), early recovering varieties had gained more new leaves hence positive cumulative percentage differences (231.4%) observed. However, the cumulative change was low in susceptible varieties (18.3%) while it was negative (-13.4%) for stay green varieties at twelve months after planting.
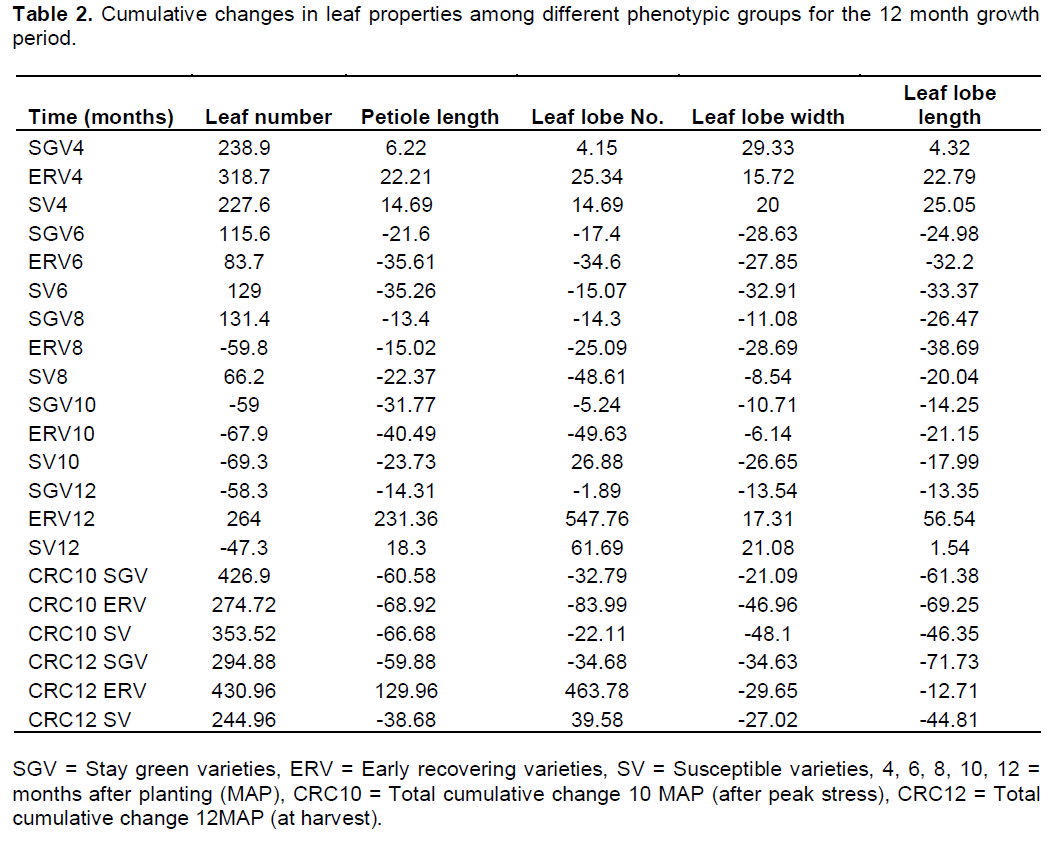
Significant variations (P<0.05) were observed in leaf lobe numbers at four months after planting with the early recovering varieties having the highest cumulative leaf lobe numbers (25.3%) compared to stay green varieties (4.2%) and susceptible varieties (14.7%). The pattern changed with onset of stress (eight months after planting) where severe reductions were observed for susceptible varieties (-48.6%) while low cumulative reductions were observed for stay green varieties (-14.3%) and early recovering varieties (-25.1). Differences occurred in the rate of reduction with stay green varieties having the highest cumulative reductions rate over the growth period. However, the early recovering varieties lost all the leaves as the stress period progressed making it difficult to follow the changes that occurred. Unlike petiole length, there were significant differences in the rate of reduction of leaf lobes between stay green varieties and early recovering varieties throughout the whole growth period. At twelve months after planting, stay green varieties had negative changes (-34.6%) while early recovering varieties had positive cumulative changes (234%) in leaf lobe numbers having regained a significant number of new leaves.
Changes in leaf lobe sizes were measured as leaf lobe width and length and decreased with growth time across the different varieties. At maximum vegetative growth between four and six months after planting, leaves were characterized into four broad categories including the short broad leaved (length between 14 and 17 cm and width between 6.5 and 7.5 cm), long broad leaved (length between 21 and 24 cm and width between 6.0 and 7.5 cm), short narrow leaved (length between 15 and 17 cm and width between 5.0 and 6.0 cm) and long narrow leaved (length between 21 and 23 cm and width between 4.5 and 6.0 cm). Most of the stay green varieties had short broad leaves and high cumulative increase in leaf lobe width and low cumulative increase in leaf lobe length (Figure 1). The early recovering varieties had intermediate characteristics with most of them having high cumulative leaf lobe length. On the other hand, the susceptible varieties had broad and long leaves. At onset of stress (eight months after planting), high cumulative reductions in leaf lobe length and width were observed for early recovering varieties (-38.7%) compared to stay green varieties (-26.5%) and susceptible varieties (-20.1%). Cumulative reductions were also observed to occur for both leaf length and leaf width at ten months after planting although major reductions were observed for leaf width.
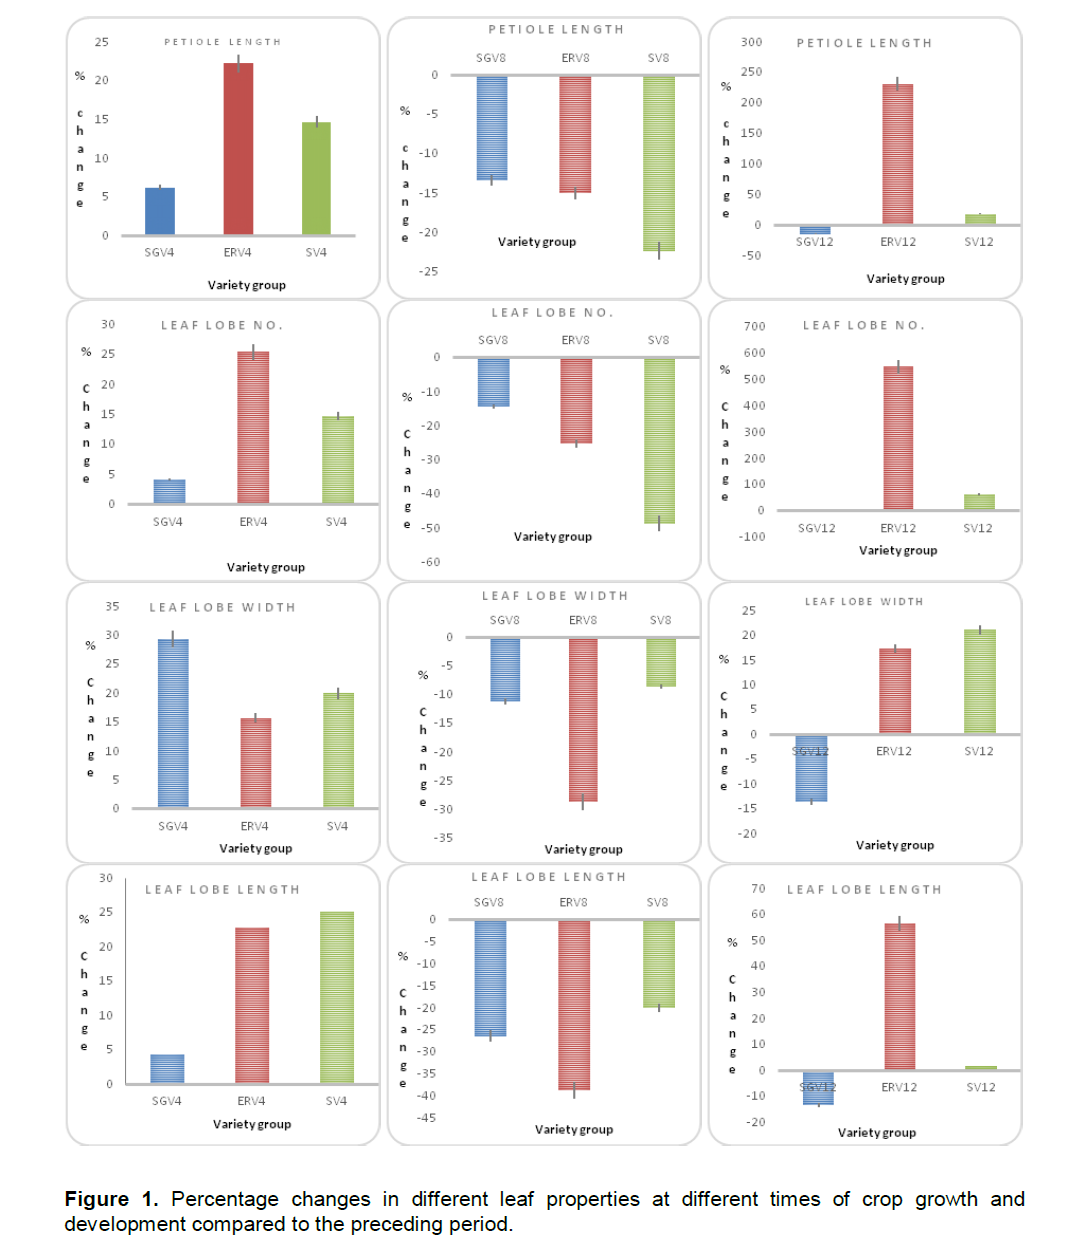
Typically over 60% reductions for leaf lobe width compared to 35 to 45% reduction in leaf lobe length were observed (Figure 1). There were no significant (P>0.05) differences for cumulative leaf lobe width between stay green and susceptible varieties much as considerable changes were observed for leaf lobe length between the two. After the plants had recovered from the stress and at twelve months after planting, positive cumulative differences for leaf lobe length (more than 55% gain in leaf lobe length) compared to leaf lobe width (17% gain in leaf lobe width) were recorded for early recovering varieties. However, negative cumulative differences were observed for stay green varieties (an average of -13.5% for both leaf lobe width and length) (Table 2). For leaf lobe length, positive cumulative differences were observed for early recovering varieties (56.5%) while the susceptible varieties had low positive changes (1.5%) implying that on recovery, susceptible varieties produced broad but shorter leaves, a general change in leaf morphology. Still negative differences were observed for stay green varieties in this instance (-13.5%) (Table 2).
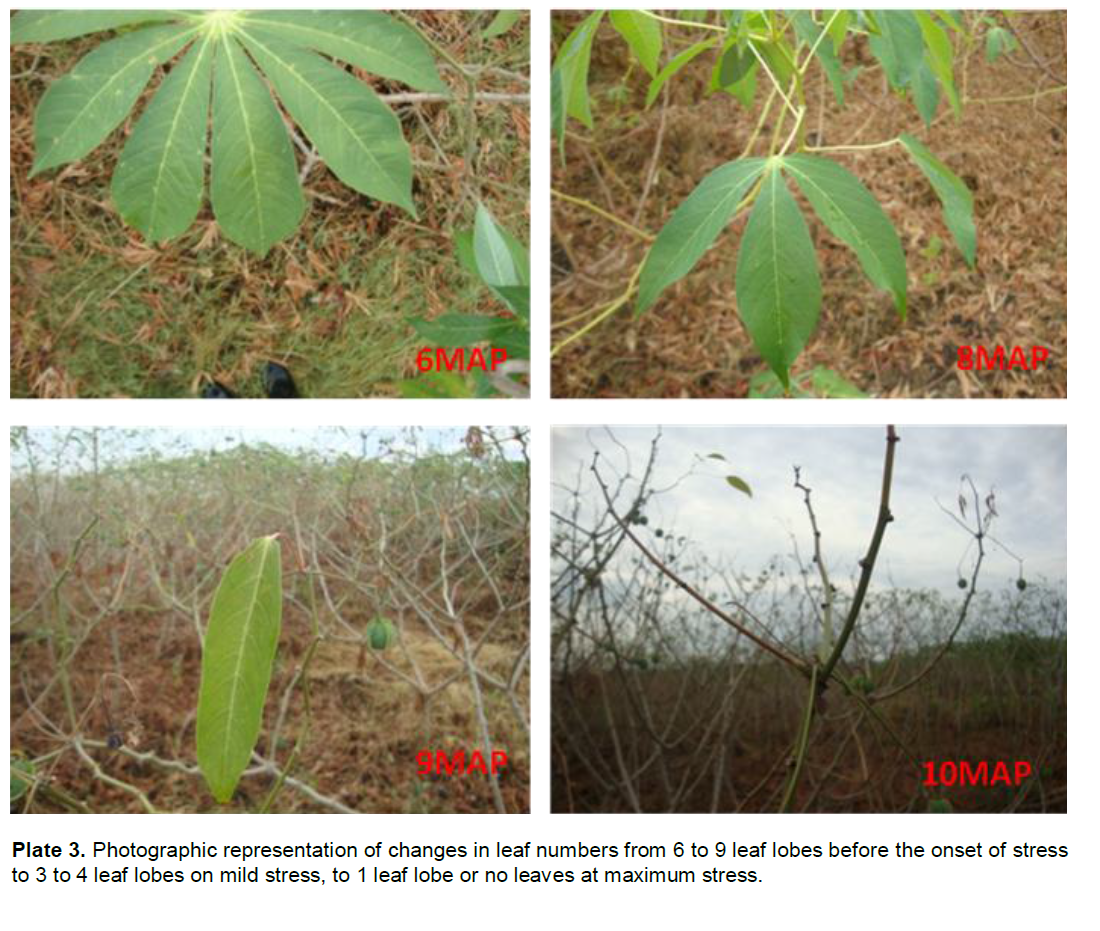
Changes in leaf numbers, leaf lobe numbers and leaf sizes were related to plant biomass accumulation and development. Leaf lobe numbers for stay green varieties remained fairly constant over the growth period and were slightly affected after critical hydrothermal stress at ten months after planting. They ranged from 6.5 to 7.2 leaf lobes on average (Plate 3). Among the early recovering varieties, leaf lobe numbers peaked at four months after planting with some varieties having up to an average of 9 leaf lobes. However, a drop was observed by six months after planting and with the onset of stress the plants shed off most of the leaves and leaf lobe numbers dropped significantly to no leaves or just one leaf lobe. On recovery, the average number of 7.4 leaf lobes was reinstated (Figure 2A) for these varieties. Susceptible varieties did not lose all the leaves during the stress period and had averages of about 3 dechlorophyllated leaf lobes with little or no capacity to carry out photosynthetic metabolism.

At two months after planting, petiole length ranged between 15.4 and 23.2 cm and the highest was recorded for the stay green varieties (Figure 2). The length of petioles increased significantly and by four months after planting, it ranged from 22.1 to 25.4 cm. Reductions in petiole growth were observed for all the varieties studied at six months after planting where petiole length ranged from 14.3 to 19.2 cm. In particular, the stay green varieties posted higher petiole lengths at all times compared to early recovering varieties and susceptible varieties. Reductions in moisture and increments temperature between six to eight months after planting resulted into significant reductions in petiole length among the susceptible and stay green varieties. In stay green varieties, petiole length reduced from an average17.2 cm on onset of hydrothermal stress to about 11.0 cm by the end of this stress period. No significant (P>0.05) increments in petiole length were observed after stress in these varieties with an average of 11.2 cm registered at 12 months after planting (Figure 2B). Among the susceptible varieties, petiole length dropped significantly from 13.7 cm at onset of hydrothermal stress to about 2.3 cm by end of peak stress, a 70% reduction. The early recovering varieties had a recovery mechanism where the petiole increased in size as new leaves were produced when hydrothermal stress was relieved (Figure 2B). By two months after planting, leaf lobes lengths ranging between 15 and 18 cm were registered which increased up to 21.5 cm on average by four months after planting. However after that, a drop in size was observed ranging from 13 to 17 cm by six months after planting and 7 to 14 cm by eight months after planting just like other plant morphological properties. Onset of hydrothermal stress resulted into a more significant negative effects in leaf size growth with lengths ranging from 4 to 9 cm by the end of the stress period although increments were observed after recovery with up to about 11.5 cm registered. Differences occurred among varieties in terms of reduction in leaf size with more significant drops observed for stay green varieties (40% reduction) compared to susceptible varieties (10% reduction) and early recovering varieties (24%) (Figure 2C).
The leaf lobe width followed the same pattern as length (Figure 2D).
Changes in total leaf numbers over the growth period
Accumulation of biomass in plants is as a result of leaf production which form the biggest part of the above ground biomass and are important in photosynthesis. However, plant leaf numbers vary due to genetic differences but most importantly due to changes in the environment. Thus, the variations in leaf numbers were determined and the results are presented in Figure 2E and Table 3. At two months after planting, most plants had average leaf numbers between 12 and 24 leaves which increased up to 40 to 94 leaves by 4 MAP.
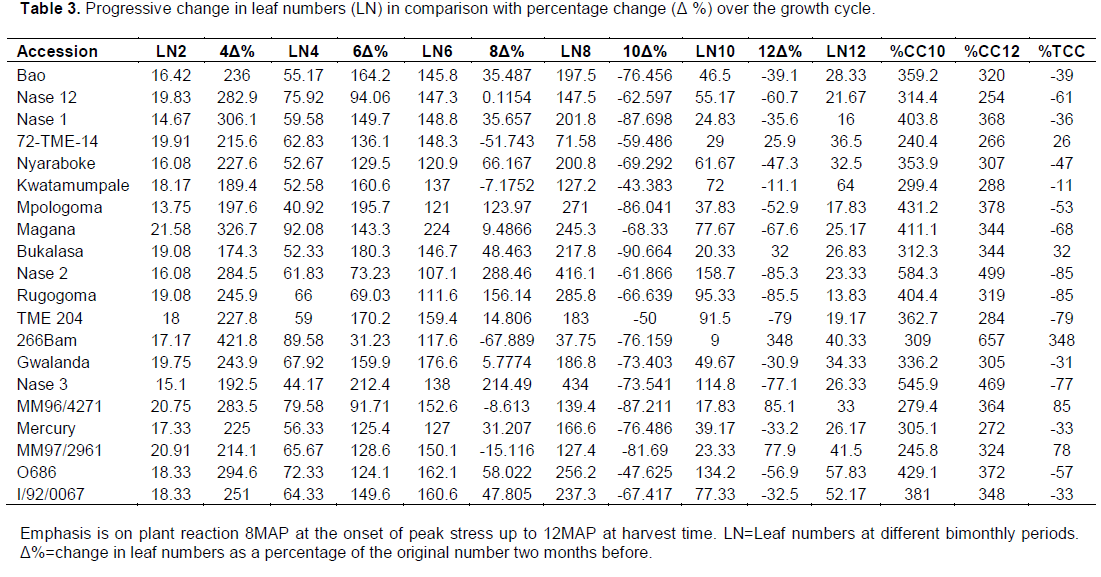
Progressive increments were observed with time to an average of 107 to 177 leaves by six months after planting and 120 to 417 at eight months after planting representing a broad range of leaf numbers across different varieties. After this, leaf numbers fell significantly to as low as only 9 leaves per plant in early recovering varieties and 158 leaves in some of the stay green varieties at ten months after planting during the critical stress period. However, after critical hydrothermal stress, continued growth resulted into more leaves depending on the mechanism of tolerance to
stress displayed.
The number of leaves increased significantly reaching the peak at 6 MAP for early recovering varieties (125 leaves on average) and at 8 MAP for susceptible varieties (200 leaves on average) and stay green varieties (250 leaves on average) per plant. In early recovering varieties, there were losses in the number of leaves at onset of critical hydrothermal stress at eight months after planting. Such losses continued throughout the stress period reaching a minimum of an average of two leaves per plant by peak stress at 10 MAP representing an average loss of 80% in the total leaf numbers (Table 3). However on recovery, early recovering plants regained most of the leaves per plant at the end of the growth period representing an average gain of over 95% and an overall net gain of 15% of the leaves compared to the period before critical hydrothermal stress period. For the stay green varieties, drops in leaf numbers started later in the critical hydrothermal stress period at about 9 MAP. Significant (p<0.05) losses in leaves were observed from about 250 leaves registered at 8 MAP to a loss of about 48% of all the leaves by 10 MAP. With no recovery mechanism presented in these varieties, continued leaf loss was observed up to about 78 leaves per plant by the end of the growth cycle representing an average net loss of about 98% of the total leaves compared to the period before critical hydrothermal stress. The same pattern was observed for susceptible varieties although more losses (70%) were registered by 10 MAP and with up to 34 leaves per plant at the end of the growth period representing about 100% loss in leaves compared to the leaf number before the stress period (Figure 2E). While the early recovering variety plants shed off their leaves, the stay green and susceptible varieties maintained their leaves, significantly reducing the leaf size and slowly reducing leaf numbers through normal leaf senescence. However, on recovery, the ERV easily and spontaneously gained photosynthesizing leaves and by harvest time had the same leaf numbers as stay green varieties. Variations in leaf numbers among the different variety groups were significant (p<0.05) between six and ten months after planting but specifically at eight months after planting. This coincides with the period of peak stress and the variations were more pronounced between the stay green varieties and the early recovering varieties. While stay green varieties like Magana, NASE 3, NASE 2, I/92/0067 and MH96/0686 maintained high leaf numbers even during the stress period with the highest average leaf number being 416 leaves at eight months after planting, varieties like NASE 16 NASE 19, and Bukalasa lost most of the leaves with more than 76.2% reductions immediately after onset of critical hydrothermal stress (Table 3). Percentage total cumulative changes (%TCC) in leaf number at ten months after planting was high among the stay green varieties (350 to 580%) and low for the early recovering varieties (200 to 310%) showing that the stay green varieties maintained leaves over a long period of time during stress compared to other varieties. Percentage total cumulative change at twelve months after planting was almost equal for both stay green and early recovering varieties but low for the susceptible varieties (Table 3). Total cumulative percentage change for the entire growth period was high and positive for the early recovering varieties (260 to 348%) and low and negative for susceptible varieties and stay green varieties (-80%). Based on this, the stay green varieties maintained some of the leaves although a negative cumulative percentage was observed after critical hydrothermal stress. Some of the test varieties recovered increasing the leaf numbers by eleven and twelve months after planting. Such an increment defines recovery of the plant after stress.
Thus, depending on the number of leaves on the plant, selections for drought tolerant varieties can be made easily where high leaf numbers before stress depicts a characteristic stay green variety and low leaf numbers lost immediately at onset of stress depict an early recovering variety. Among the varieties that showed a recovery mechanism, the time of recovery varied hence differences in the ability to recover during stress. The value of the total cumulative change (%TCC) at harvest can also be an important selection indicator for tolerance to stress especially if plant yield components are taken into consideration. For selection of the stay green phenotype, varieties which showed a high positive percentage between 100 and 290% eight months after planting can be important
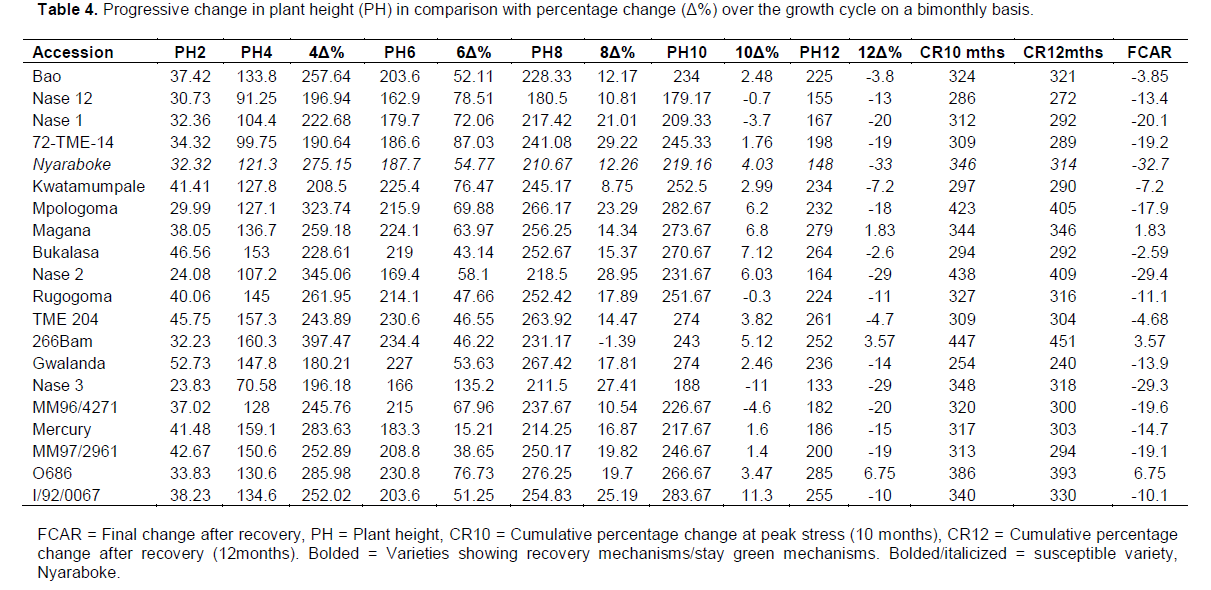
Changes in plant height as a determinant of growth rate
Above ground biomass increments are related to the height of the plant and hence there was need to assess the variations in plant height to supplement the selection methods of hydrothermal stress tolerant varieties. Results for changes in plant height as a factor of plant growth rate are presented in Table 4. High growth rates were observed for all varieties between two and four months after planting where some varieties achieved more than 350% plant height changes compared to the height after germination. In particular high progressive changes in the growth rate were observed in NASE 16(397%), NASE 2(345%) and Mpologoma (323.7%). At six months after planting, reduced growth rates were observed with limited growth increments ranging between 30 and 80% except for the stay green variety NASE 3 with up to 135.2% growth increments. By eight months after planting, exceedingly low growth rates were observed with some varieties exhibiting negative growth rates such as NASE 16(-1.49%) due to loss of leaves and shoots at the onset of critical hydrothermal stress. At ten months after planting, a few varieties posted positive growth changes especially the stay green varieties such as I/92/0067 and Magana and some early recovering varieties such as Bukalasa. Most of the other varieties had negative growth increments due to the effect of stress on the growth and development of shoots during the stress period. Severe growth retardation was observed in varieties such as Rugogoma, Mercury, NASE 1 and Mpologoma, susceptible varieties which had most of their shoot drying up during the critical stress period and hence reductions in growth. On a cumulative basis and up to ten months after planting, high growth rates were observed for mainly stay green varieties such as Magana, MH96/0686, NASE 3, NASE 2 and the early recovering variety NASE 16 while at twelve months after planting, high cumulative growth was observed for NASE 2, NASE 16 and MH96/0686. Over all high growth rates for the whole growth period were observed for Magana, NASE 16, and MH96/0686 while low growth rates were observed for Nyaraboke, NASE 1 and NASE 3. Varieties with overall high growth rates and yield after recovery such as NASE 16 and Magana can be selected and deployed as moisture and temperature stress tolerant varieties.
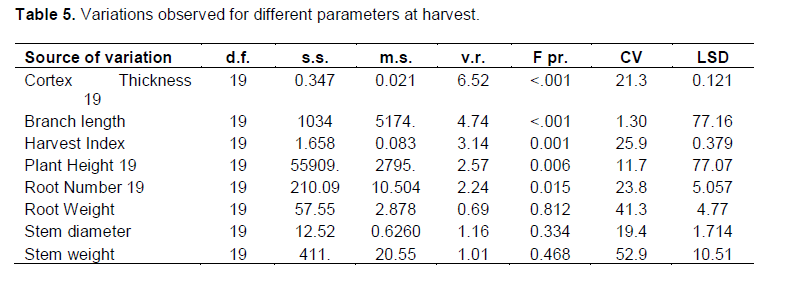
Harvest index related parameters
The ratio of the below ground biomass (cassava yield components) to the above ground biomass was estimated and compared to root related properties such as Dry matter yield, cortex thickness and root number. Variations among genotypes were observed in morphological parameters such as root cortex thickness, and the branching level and number of branches. The cortex thickness was positively correlated to root number (r = 0.84), root weight (r = 0.62) and stem weight (r = 0.51). The early recovering varieties had a smaller cortex thickness (0.2 to 0.3 cm) compared to stay green varieties which had cortex thickness of 0.35 to 0.55 cm and the susceptible varieties which had cortex thickness of between 0.3 and 0.4 cm. A bigger cortex was thus related to high levels of resilience to stress as earlier observed by (Okogbenin et al., 2013). Plant height in the different genotypes was positively correlated to the stem diameter (r = 0.33) and root weight (r = 0.28). The harvest index varied significantly within the different genotypes and was negatively correlated to plant height (r = -0.19) and stem weight (-0.42). High harvest index was recorded for early recovering varieties while low harvest index was recorded for the stay green varieties. The number of roots varied significantly in different cassava varieties although no significant differences were observed for root weight (p > 0.05). Generally stem related properties were not significantly (p>0.05) different among different cassava varieties although shoot weight was positively correlated to root number (r = 0.53) and root weight (r = 0.69). Likewise stem
diameter was positively correlated to root weight (r = 0.57) and root number (r = 0.68). Since no differences were observed for stem related parameters, the yield components that varied significantly between different varieties are the main determinants of stress resilience in plants.
Selection of hydrothermal stress tolerant and avoidant varieties
This study was mainly conducted to understand the phenotypic mechanisms for tolerance to hydrothermal stress in cassava varieties and from the results above, a number of plant properties were identified that were key in the selection of tolerant varieties. These selections and their mechanisms are presented in Figure 3. Selections for the stay green mechanism were mainly based on the ability of the plant to accumulate biomass during the vegetative stage of growth from two to six months after planting. Plants which accumulated a lot of biomass at this time maintained substantively higher biomass contents during stress, had higher rate of leaf retention and higher growth rates. In addition, they had lower harvest indices and they were identified as stay green varieties. However, cassava plants displaying the stay green mechanism did not necessary maintain high leaf lobe numbers but instead reduced the number of leaf lobes at a lower rate compared to other varieties as the critical hydrothermal stress period progressed (Figure 2).
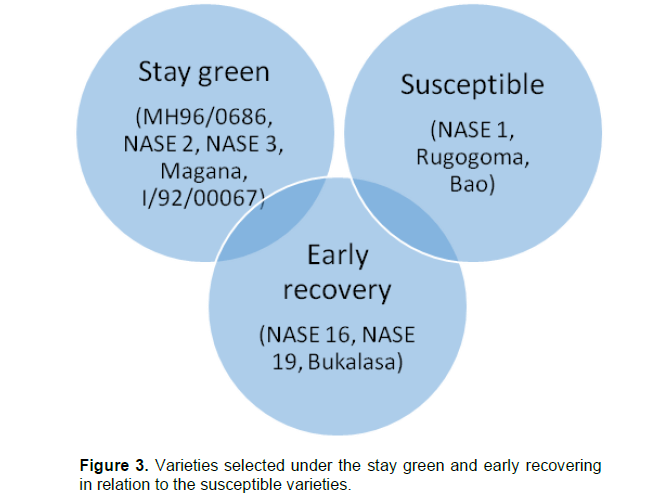
On the other hand, selection for the early recovering mechanism were based on the loss of leaves immediately at onset of critical hydrothermal stress, the ability to produce new shoots immediately on removal of hydrothermal stress, leaf re-growth and maintenance immediately after hydrothermal stress and higher harvest indices (Figure 2). Like in the stay green mechanism, the early recovering mechanism was mainly based on leaf lobe number maintenance after hydrothermal stress but not maintenance of individual leaves. Plants which displayed no mechanism and easily succumbed to stress were described as susceptible plants.
Changes in biomass allocation and accumulation during the cassava plant growth cycle are expected. These changes describe the inherent plant characteristics which are mediated by both the genetic component of the plant and its interaction with the environment. Such changes determine the yield potential of the plant in period of normal growth where as in stress conditions; the environment plays a big role in influencing the rate of growth and ultimately affecting the yield potential of the cassava plant as earlier observed by Osorio et al. (1993). In this study, the effects of stress resulted into significant changes in plant morphology resulting into altered yield compared to the control conditions. The stress conditions also resulted into reduced growth rates and the plants ability to attain a particular growth height or leaf area index as observed (Tables 2 and 3). The results also showed that low moisture and elevated temperature stress had significant effects on dry matter accumulation, root numbers and size, plant height and also leaf lobe length and leaf width. Such significant differences in shoot based biomass affected the plants ability to effectively increase its root based biomass resulting into reductions in yield and yield components.
Reductions in leaf size and leaf expansion were observed as the main factors that cause loss in biomass during stress. Shoot and leaf biomass in most plants accumulates in a curve-linear fashion increasing to maximum by the time the plant gets into the reproductive stage (Ranawake et al., 2011). This was observed in cassava between two to six months after planting as the plants increased their biomass content linearly though variety based differences were observed showing that some of these traits are partly under genetic control (Figure 1 and Table 3). Differences observed in petiole length and leaf size (drought related traits) among variety groups at the onset of hydrothermal stress show that tolerance mechanisms are related to plant genetic makeup. Such variations result into differences in accumulation of biomass in different varieties describing a stress tolerance criterion for a particular variety. Negative changes in leaf size properties and the petiole length at eight months after planting shows the negative influence of hydrothermal stress on cassava plants. This had an impact on the harvest index as observed later on in the growth cycle of the plant and even the harvest parameters as shown in Table 5. High rates of biomass accumulation observed earlier in the plants growth cycle may be a preparatory measure for carbon sequestration preparing for periods of low carbon uptake. Hydrothermal stress increases the imbalance between carbon supply and demand resulting into reduced biomass and loss of reproductive organs (Blum, 2005). Cassava plants which have mechanisms of increasing above ground biomass for purposes of increased photosynthetic and growth metabolism may be more prepared to counteract effects of stress compared to the others which slowly accumulate biomass as has been observed in other plants by Ranawake et al. (2011). Specific increments in biomass earlier before stress was observed in the early recovering and stay green varieties which by six months after planting had significant biomass in the above ground parts hence were prepared for onset of stress later in the growth cycle
Correlation between the above ground biomass especially the stem characteristics with root biomass points to the influence of the above ground biomass on the sink (root) organs. It also points to the importance of the root cortex as one of the sink organs in stress tolerance as observed by Cohen et al. (2005) and Okogbenin et al. (2013). This also explains the correlation between harvest index and biomass parameters such as leaf size and plant height (Table 5). Higher values for cortex thickness in stay green varieties also point to the use of the storage reserves in times of stress. Thus, breeding for stress tolerance requires a full understanding of the relationships between biomass and root mass for selection of plants that effectively accumulate photosynthetic biomass and offset the effects of stress. The differences observed before onset of stress among the different variety groups but especially for the stay green and early recovering varieties point to the fact that stress tolerance or avoidance mechanism are a function of plants genetic framework as was earlier confirmed by Thornley (1972).
The positive cumulative increments in leaf sizes observed post stress in early recovering varieties were due to production of new vigorous leaves compared to the stay green varieties which maintained old non vigorous leaves. This implies that avoidance mechanisms are desired to allow the plant to attain a certain level of metabolic activity after stress which helps the plant to grow faster and revive the photosynthetic processes necessary for increasing plant biomass (Peroni et al., 2012). Observed changes in leaf morphology after stress for leaf size had an implication on the form and type of metabolism carried out by these leaves as suggested by Aguirreza’bal (2006). Leaves produced due to heterotrophic metabolism by using the plants own resources have less biomass and hence low photosynthetic capacity as observed by Hedayati et al. (2013) in other species of Euphorbiaceae. However, such leaves were able to regain normal metabolism and normal morphology although in the stay green varieties the morphological state of the leaves did not change a lot, an indicator of compromised photosynthetic metabolism. The efforts put forward by the plants to regain normal leaf morphology after recovery was observed for early recovering varieties suggesting that leaf and plant morphology need to be reinstated for optimal functioning of the cassava plants metabolic apparatus. This may also be related to particular genetic mechanisms meant to help the plant attain the former metabolic state as observed by Blum (2005).
The maintenance of a fairly constant leaf area index by stay green varieties during growth period and even in the stress period describes a tolerance mechanism by cassava plants as suggested by Asadi et al. (2012) and Turyagyenda et al. (2013). Such a mechanism may allow plants to minimally photosynthesize and maintain basic growth and physiological activities throughout the growth period. However, it comes with basic changes in rate, type and direction of translocated material in such plants. This explains the variations in root parameters among different varieties (Table 5) which also point to the importance of stored material in the root in allowing plants to cope with stress.
The differences observed at harvest in the different cassava varieties for root properties are an indicator of differences in yield in addition to the use of stored material as reserve metabolites to help the plant counteract stress as suggested by Zotz et al. (2002). Plant growth rate was probably dependent on increased rates of metabolism that increase the available plant resources meant for growth and development and hence helping the plant to achieve relevant metabolites that usher it into the reproductive phase as was observed by Blum (2005). This is due to increase in the rates of both respiratory and photosynthetic metabolism (Thornly, 1972). Interference in any of these forms of metabolism by either biotic or abiotic stress results into reduced growth hence reduction in plant growth properties as the critical hydrothermal stress conditions are maintained. The significant differences between the varieties tested for plant height, shoot dry weight and root based properties showed that some varieties were more sensitive while others were more tolerant. This has been reported in cereals such as wheat (Pauk et al., 2010) and Jatropha curcas (Hedayati et al., 2013) where plant height also decreased with increasing levels of water stress conditions.
Understanding how biomass reductions are photosynthetically driven is very important in determining their effect on the partitioning of photo assimilates to the significant parts of the plant at different growth times (Seyed et al., 2012). Since biomass accumulation during stress is mainly heterotrophic and is dependent on carbon resources in the root for growth support (Holzapfel et al., 2010), there is a significant effect of stress on harvest index as was observed in different cassava varieties (reducing in susceptible and stay green varieties due to use of stored resources to maintain basic metabolic processes) in effect reducing crop yield. Thus, selection of tolerant plants should account for the impact of hydrothermal stress on storage organs of cassava as a food resource. Loss in root weight and hence yield reduces the food and industrial value of cassava.
Apart from the leaves, the branching ability (determinant of shoot biomass) of the plant also has roles to play as far as stress tolerance/resistance is concerned. An increase in root to shoot ratio (or root to total dry matter ratio), as proposed by Steinberg et al. (1990) and attributable mainly to a reduction in shoot growth, was observed when water was limiting. This was a main mechanism for the stress avoidant plants of the early recovering varieties which maintained a low LAI. The size-dependent changes in biomass partitioning from direct changes in the carbon allocation process observed for these cassava plants reveal that water deficits probably act on biomass allometry by slowing down growth and adjusting plant size to the reduced amounts of carbon assimilated. This may be as a result of stomatal closure and decreased leaf area (Osorio et al., 1993). Employment of such mechanisms by cassava plants during abiotic stresses in different ways (hence the different phenotypes observed during stress) shows that cassava varieties differ in their ability to utilize the critically reduced amount of water available to the plant during drought incidence. If biomass production in the different varieties and the trend of water use efficiency are taken into account, it follows that when water is available to the plant, transpiration is unimpeded by stomata and lesser changes in biomass allocation and plant morphology may be expected as suggested by Bergantine et al. (2004).
Based on the results and observations from the field, it was realized that biomass based selection is important in the selection of hydrothermal stress tolerant plants. However, in earlier studies, (Okogbenin et al., 2013; Turyagyenda et al., 2013), selections were based on biomass properties such as high leaf retention during stress, high biomass retention during stress, high growth rates and high harvest indices. Such a selection mechanism based on leaf retention is not exhaustive since in this case even plants with mixed reactions will be selected even if the leaf morphology is severely compromised. In addition, selections only based on growth rate during stress will not easily identify drought avoidant plants that display a recovery mechanism after stress since these plants will be in a state of dormancy during this time. Thus, the author propose that selections for hydrothermal stress tolerant and avoidant plants be taken into account by considering phenotypic parameters such as leaf lobe retention during stress, cumulative leaf lobe retention during the growth cycle of the plant, and cumulative rate of growth during the plant growth cycle coupled to high harvest indices (Table 5). This will allow for selection of hydrothermal stress tolerant and avoidant plants falling under two broad stress tolerance mechanisms identified as stay green and early recovering mechanisms. It will also allow for possible understanding of plants that have mixed mechanisms and fall under the intersection between stress tolerant and avoidant plants in addition to identifying the stress susceptible plants as shown in Figure 3.
Results from this work showed that hydrothermal stress reduced biomass due to changes in the plants’ morphological properties. The reductions were mainly in leaf based biomass and leaf related properties compared to the whole plant. Since leaves are the most sensitive organs to drought stress and respond quickly to low water availability, such a study is imperative in understanding the responses of cassava plants to water deficit and increased temperature, factors that mainly contribute to drought. Modification of plant morphological properties in response to stress does not only have an effect in controlling water loss but also provides an energy saving mechanism including saving stored resources in the plant. In cases where this is not possible, the plant either utilizes its resources to tolerate the stress or completely succumbs to the effects of stress and is hence susceptible. Identifying this in cassava is possible by studies on cassava plant phenotypic properties. And thus in this study, hydrothermal stress tolerant and avoidant plants were selected based on leaf lobe retention, biomass accumulation based selection during the vegetative stage of growth, leaf and leaf lobe recovery immediately after elimination of hydrothermal stress, selection based on number of fibrous roots/root cortex and selection based on harvest index after stress.
However, relating these phenotypic properties to their genetic controls may provide a much more reliable basis for selection of tolerant varieties of cassava.
This work was carried out by NARO scientists in collaboration with partners and funders. None of the parties have raised any concerns regarding this work and there is no conflict of interest in regard to the material contained in this study.
This work was supported by the Bio-Innovate project, a subsidiary of SIDA grant under National Agriculture Research Organization (NARO).
REFERENCES
Alves AC, Setter TL (2004). Abscisic acid accumulation and osmotic adjustment in cassava under water deficit. Environ. Exp. Bot. 51(3):259-271.
Crossref |
|
|
|
Asadi S, Lebaschy MH, Khourgami A, Mirrad AH (2012). Effect of Drought Stress on the Morphology of Three Salvia sclarea Populations. Ann Biol. Res. 3(9):4503-4507. |
|
|
|
Bergantine R, Yamauchi A, Pardales J,Bolatete D (2004). Screening cassava genotypes for resistance to water deficit during crop establishment. Philippine J. Crop Sci. 29(1):29-39. |
|
|
Blum A (2005). Drought resistance, water-use efficiency, and yield potential—are they compatible, dissonant, or mutually exclusive. Aus. J. Agric. Res. 56:1159-1168.
Crossref |
|
|
Boese RS, Huner NPA (1990). Effect of Growth Temperature and Temperature Shifts on Spinach Leaf Morphology and Photosynthesis. Plant Physiol. 94:1830-1836.
Crossref |
|
|
Cohen S, Raven E, Li Y, Grava A, Goldschmidt EE (2005). Physiological responses of leaves, tree growth and fruit yield of grapefruit trees under reflective shade screens. Scientia Hort. 107:27-35.
Crossref |
|
|
Fasehun FE (1979). Effect of soil matric potential on leaf water potential, diffusive resistance, growth and development of Gmelina arborea L. seedlings. Biologia Plantarum 21(2):100-104.
Crossref |
|
|
Granier C (2000). PHENOPSIS, an automated platform for reproducible phenotyping of plant responses to soil water deficit in A. thaliana….ion with low sensitivity to soil water deficit. New Phytologist, 169(3):623-635.
Crossref |
|
|
|
Guerin GR, Wen H, Lowe A (2012). Leaf morphology shift linked to climate change. Biol. Lett. 23 8(5):882-886. |
|
|
Holzapfel BP, Smith JP, Field SK, Hardie WJ (2010). Dynamics of carbohydrate reserves in cultivated grapevines. Hortic. Rev. 37:143-211.
Crossref |
|
|
Hsiao TC, O'Toole JC, Yambao EB, Turner NC (1998). Influence of Osmotic Adjustment on Leaf Rolling and Tissue Death in Rice (Oryza sativa L.). Plant Physiol. 75(2):338-341.
Crossref |
|
|
|
Hedayati A, Alizadeh O, Sharafzadehs AM, Azarpanah A (2013). Physiological and morphological responses biodiesel plant (Jatropha curcas L.) to water stress condition. Int. J. Agric. Crop Sci. (IJACS) 5(7):695-703 |
|
|
Katahata S, Naramoto M, Kakubari Y, Mukai Y (2007). Photosynthetic capacity and nitrogen partitioning in foliage of the evergreen shrub Daphniphyllum humile along a natural light gradient. Tree Physiol. 27(2):199-208.
Crossref |
|
|
Kaplan DR (2001). The science of plant morphology: Definition, history, and role in modern biology. Am. J. Bot. 88(10):1711-1741.
Crossref |
|
|
|
Osório J, Pereira JS (1993). Genotypic differences in water use efficiency and 13C discrimination in Eucalyptus globulus Tree Physiol. 14(7-8-9):871-882. |
|
|
O'toole JC, Cruz RT (1980). Response of leaf water potential, stomatal resistance, and leaf rolling to water stress. Plant Physiol. 65(3):428-432.
Crossref |
|
|
Okogbenin E, Setter TL, Ferguson M, Mutegi R, Ceballos H, Olasanmi B, Fregene M (2013). Phenotypic approaches to drought in cassava: review. Front Physiol. 4:93.
Crossref |
|
|
|
Pauk J, Cseuz L, Lantos C, Mihály R, Vass I, Dudits D (2010). Drought stress and the response of wheat: nursery and complex stress diagnostic experiments. Association of PflanzenzÃchter and Seed Merchants Austria, pp. 15–18 |
|
|
Peroni I, Pagliarani C, Lovisolo C, Chitarra W, Roman F, Schubert A (2012). Recovery from water stress affects grape leaf petiole transcriptome. Planta 235(6):1383-96.
Crossref |
|
|
|
Ranawake AL, Amarasingha UGS, Rodrigo WDRJ, Rodrigo UTD, Dahanayaka N (2011). Effect of water stress on growth and yield of mung bean (Vigna radiate L). Trop. Agric. Res. Ext. 14(4):76-79 |
|
|
Salekdeh GH, Reynolds M, Bennett J, Boyer J (2009). Conceptual framework for drought phenotyping during molecular breeding. Trends Plant Sci. 14:488-496.
Crossref |
|
|
Schmidt G, Zotz G (2001). Ecophysiological consequences of differences in plant size: in situ carbon gain and water relations of the epiphytic bromeliad, Vriesea sanguinolenta. Plant Cell Environ. 24:101-112.
Crossref |
|
|
Schuppler U, He PH, John PCL, Munns R (1998). Effect of water stress on cell division and cell-division-cycle 2-like cell-cycle kinase activity in wheat leaves. Plant Physiol. 117(2):667-678.
Crossref |
|
|
|
Seyed YS, Lisar RM, Hossain MM, Rahman IMM (2012). Water Stress in Plants: Causes, Effects and Responses. Water Stress, ISBN: 978-953-307-963-9 |
|
|
|
Shin K, Lieth H, Kim S (2001). Effects of temperature on leaf area and flower size in rose. Proc. III IS Rose Research Acta Hort. 547:185-191. |
|
|
Steinberg SL, Miller JC, McFarland MJ, (1990). Dry matter partitioning and vegetative growth of young peach trees under water stress. Aust. J. Plant Physiol. 17:23-26.
Crossref |
|
|
Turyagyenda L, Kizito EB, Ferguson M, Baguma Y, Agaba M, Harvey J, Osiru D (2013). Physiological and molecular characterization of drought responses and identification of candidate tolerance genes in cassava. AoB PLANTS: plt007 doi: 10.1093/aobpla/plt007
Crossref |
|
|
Tardieu F, Davies WJ (1993). Integration of hydraulic and chemical signalling in the control of stomatal conductance and water status of droughted plants. Plant Cell Environ.16:341-349.
Crossref |
|
|
|
Thornley JHM (1972). A balanced quantitative model for root: shoot ratios in vegetative plants. Annals Bot. 36:431-441. |
|
|
Neumann PM (1995). The role of cell wall adjustment in plant resistance to water deficits. Crop Sci. 35:1258-1266.
Crossref |
|
|
Valladares F, Pearcy RW (1999). The geometry of light interception by shoots of Heteromeles arbutifolia: morphological and physiological consequences for individual leaves. Oecologia 121:171-182.
Crossref |
|
|
Yin X, Kropff MJ (1996). The effect of temperature on leaf appearance in rice. Ann. Bot. 77:215-221.
Crossref |
|
|
Zotz G, Reichling P, Valladares FA (2002). Simulation study on the importance of size-related changes in leaf morphology and physiology for carbon gain in an epiphytic bromeliad. Ann. Bot. 90(4):437-443.
Crossref |