ABSTRACT
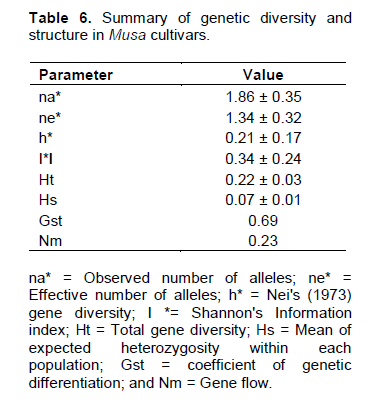
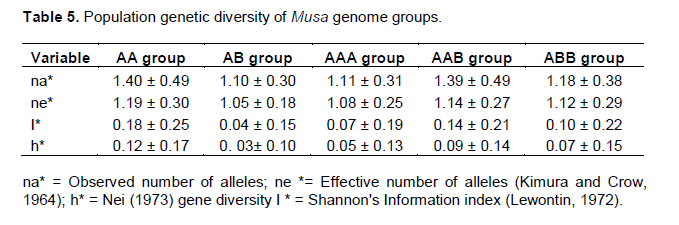
Banana and plantain (Genus: Musa; Family: Musaceae) are giant perennial rhizomatous herbs native to South East Asia and Western Pacific. Present study analyzed the genetic population structure and diversity of South Indian Musa cultivars belonging to different genome groups using random amplified polymorphic (RAPD) markers. The total genetic diversity for all groups (Ht) was 0.22 and within groups (Hs) was 0.07 indicating high genetic variability among groups (Gst=0.69). Gene flow (Nm) was also found to be relatively very low with a value of 0.23. Genetic variability parameters and AMOVA revealed that genetic diversity is mainly present among the genome groups. Analysis of genetic diversity and structure revealed highest diversity and heterozygosity in AA group followed by AAB. Nei (1973) gene diversity was 0.12 ± 0.17 in AA group followed by 0.09 ± 0.14 in AAB group. Dendrogram derived based on UPGMA method also grouped AA cultivars into two different clusters and separated them from the wild Calcutta 4 (AA) indicating the involvement of several Musa acuminata subspecies in the origin and evolution of AA diploids. The current work revealed the status of genetic diversity and population structure among Musa genome groups implying the need of effective conservation of diploid M. acuminata (AA) group.
Key words: Banana, genetic diversity, Musa, random amplified polymorphic (RAPD), population structure.
Banana and plantain (Genus: Musa; Family: Musaceae) are fruit crops of great socio-economic significance as they serve as staple food for many millions of people across the tropics and sub tropics. Globally, bananas are grown in more than 130 countries across the world on an area of 8.25 Mha with an annual production of over 100 million tonnes, of which about one third are produced in the African, Asia-Pacific and Latin American and Caribbean regions. Modern cultivated bananas evolved from intra- and inter- specific hybridization between two wild diploid species, Musa acuminata Colla. and Musa balbisiana Colla., that contributed the A and B genomes respectively (Simmonds, 1995). Commercially cultivated bananas are seed sterile diploid, triploid or tetraploid clones which are classified into different genome groups as AA, BB, AB, AAA, AAB, ABB, AAAA, AAAB, AABB and ABBB based on a system created by Simmonds and Shepherd (1955). This system assigns a score of 1 to 5 for 15 selected morphological features that differentiate M. acuminata from M. balbisiana. The total score determines the relative contribution of these wild species to the constitution of the clone/cultivar. However, many of the cultivars cannot be classified into their respective genome groups, as they show a bias towards either A or B phenotype. Moreover, most of the cultivars cannot be easily distinguished on the basis of their morphology, especially if they are closely related. Practice of assigning local names to cultivars based on fruit and plant characteristics resulting in numerous synonyms and homonyms has created an added confusion in the identification and classification of banana cultivars.
India is recognized as one of the major centers of origin and diversity especially for M. balbisiana (Simmonds, 1962). Diversity among commercial cultivars in India is also vast owing to diverse climatic conditions from dry arid zones to humid tropical and cold temperate zones. South Indian states, especially Kerala, Tamil Nadu and Karnataka are endowed with numerous delicate edible diploid M. acuminata’s also (Uma and Sathiamoorthy, 2002). Analysis of genetic diversity and characterization are central to the effective management of genetic variation. In order to make the best utilization of genetic potential of genotypes for improvement of traits and for adaptation to various stress conditions, genetic study is crucial (Salem et al., 2008). A good understanding of the current status of genetic diversity and adaptive potential of population is a pre-requisite for the successful management of conservation programs. Information on the genetic diversity and phylogenetic relationships within South Indian banana germplasm is scarce (Mukunthakumar et al., 2013). With this background, present study attempted to assess the genetic diversity and structure of South Indian Musa cultivars using molecular markers. Applying the appropriate degree of caution, random amplified polymorphic DNA markers (Williams et al., 1990) can provide invaluable tools to study patterns of genetic variability due to their advantages over other molecular methods, such as less complex and labour-intensive procedures and more arbitrary sampling of the genome.
Lougheed et al. (2000) suggested that concerns regarding the relatively lower resolving power of random amplified polymorphic (RAPD) markers can be ameliorated by the relative ease with which one can increase the number of assayed loci. The use of RAPD markers to genetically fingerprint plants which are morphologically similar or indistinguishable has been established as reliable, efficient and informative as they tend to reside in regions with many repeated sequences, and therefore in non coding regions, which are more susceptible to mutations, consequently reveal more polymorphisms (Irwin et al., 1998). Thus, they allow better analysis of genetic identity and variation amplifying different regions of the genome and are effective to reveal inter-intra species DNA variability (Zhao et al., 2015). RAPD markers have been widely used for the identification of genetic relationships a) among cultivars, b) among wild forms and c) between wild forms and cultivars (Bukhari et al., 2015). Reports are also available supporting that RAPD markers are as effective as AFLP markers for identifying clonal diversity (Albert et al., 2003; Kjolner et al., 2004). In this study, the authors identified the level of diversity and population structure present in the cultivars distributed in different genome groups of Musa employing RAPD markers.
Plant material and genomic DNA isolation
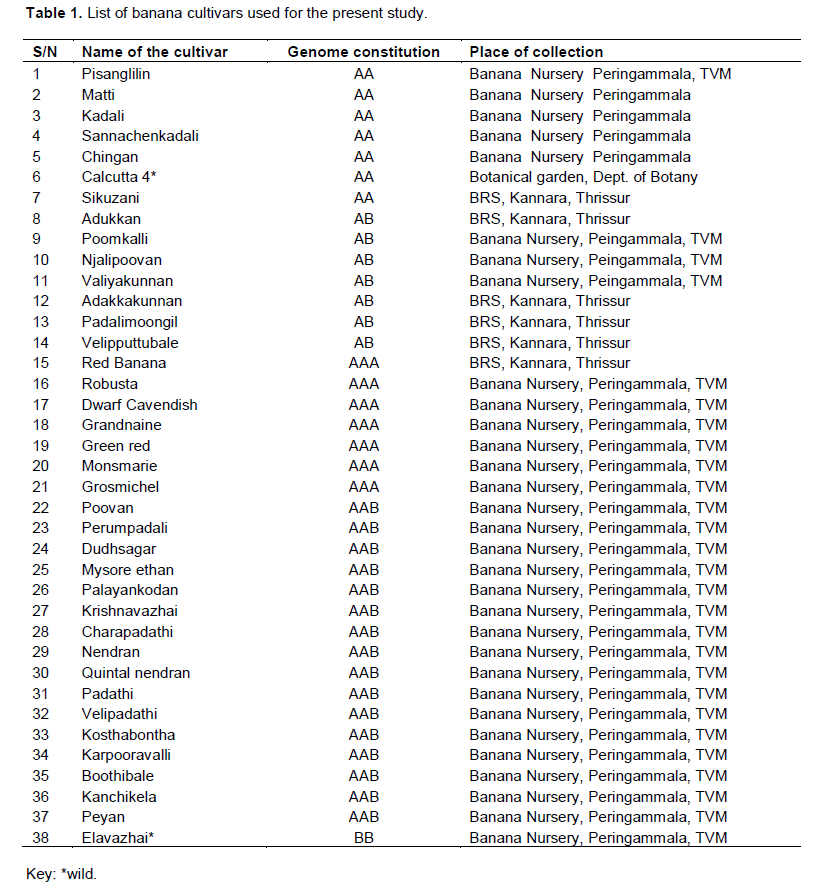
A total of 38 banana cultivars (Table 1) belonging to AA, BB, AB, AAB and ABB genome groups were collected from Banana Research Station, Kannara, Thrissur and Banana Nursery, Peringammala, Thiruvananthapuram located in South Indian State, Kerala. Five to ten grams of young cigar leaves collected from a single representative healthy plant of each cultivar were used for DNA extraction. The harvested leaves were immediately stored at -80°C. Genomic DNA was isolated using CTAB method of Saghai-Maroof et al. (1984) with minor modifications. The DNA concentration was estimated with a DNA fluorimeter (Hoeffer Scientific, San Francisco, USA) using Hoechst 33258 as the DNA intercalating dye (Brunk et al., 1979).
RAPD assay
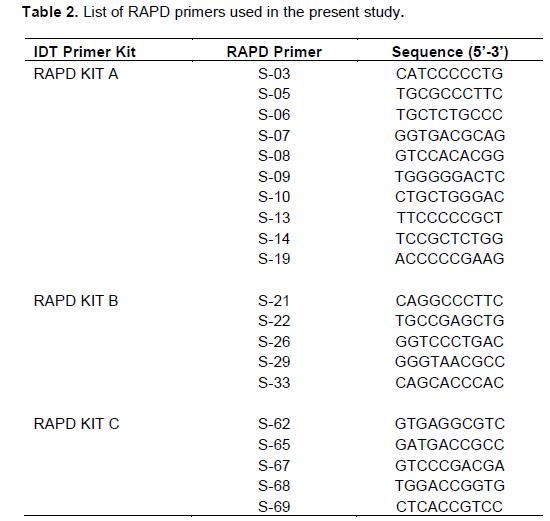
For RAPD assay, a total of 20 decamer primers (IDT, USA) were used. A list of primers along with their sequence information is given in Table 2. Each reaction was performed twice to verify reproducibility. RAPD assay were carried out with 10X PCR buffer with 1.5 mM MgCl2, 0.2 mM of each dNTP, 15 pmol of random primer from kit ‘A’, ‘B’, ‘C’ and ‘D’ (IDT, USA), 50 ng genomic DNA and 1.0 unit of Taq DNA polymerase (Genei, India). The volume was made upto 25 μl with sterile distilled water. DNA amplifications were performed in a thermal cycler (Eppendorf gradient, USA). The thermal profile consisted of an initial cycle of 5 min at 94°C, 2 min at 36°C and 2 min at 72°C followed by 38 cycles of 1 min at 94°C, 1 min at 36°C and 2 min at 72°C and a last cycle at 72°C for 7 min. Amplified products were resolved in 1.5% agarose gel stained with ethidium bromide.
Genetic data analysis
RAPD products for each primer set from individual cultivars were scored as either present (1) or absent (0) in order to construct a binary matrix of RAPD. The 1/0 matrix was used to compute pair-wise Dice similarity coefficients using WinDist (Yap and Nelson, 1996). The similarity matrix was subjected to the unweighted pair group method for arithmetic analysis (UPGMA) in order to generate a dendrogram. The robustness of the nodes in the dendrogram was tested by bootstrap analysis on 1000 data replicates using WinBoot (Yap and Nelson, 1996). On the basis of the same matrix Principal Coordinate Analysis (PCoA) was performed by Gen Alex6.5 (Peakall and Smouse, 2012). This multivariate technique allowed us to find and plot the major pattern within multiple loci data set. The resulting distance matrix was also subjected to Analysis of Molecular Variance (AMOVA) using GenAlex6.5. The AMOVA estimated and partitioned total molecular variance within and among genome groups and then tested the significance of partitioned variance components using non-parametric testing procedures with 999 permutations (Excoffier et al., 1992). The φPT coefficient, which is analogous to Fst for binary data was calculated. The RAPD profile data was also analyzed using the standard population genetic and numerical taxonomy analysis software POPGENE Version 1.32 (Yeh et al., 2000). The basic parameters calculated using POPGENE software included genetic diversity indices, number of alleles per locus, gene flow among populations, observed and expected heterozygosity at a given locus and Shannon information index as a measure of gene diversity. The discriminatory power of RAPD markers was evaluated by three parameters. The polymorphic information content (PIC) for each RAPD marker was calculated, as proposed by Roldan-Ruiz et al. (2000), as PICi = 2fi (1-fi), where PICi is the polymorphic information content of marker i, fi is the frequency of the marker bands present, and 1-fi is the frequency of absent marker bands. PIC was averaged over all the bands for each primer. The resolving power (Rp) of the primers was calculated according to Prevost and Wilkinson (1999) as Rp = ΣIb where Ib (band informativeness) takes the value of 1-[2×(0.5-p)], p being the proportion of the genotypes containing the band. The third parameter used was the marker index (MI) as proposed by Powell et al. (1996) and used by Milbourne et al. (1997).
Marker informativeness and polymorphism
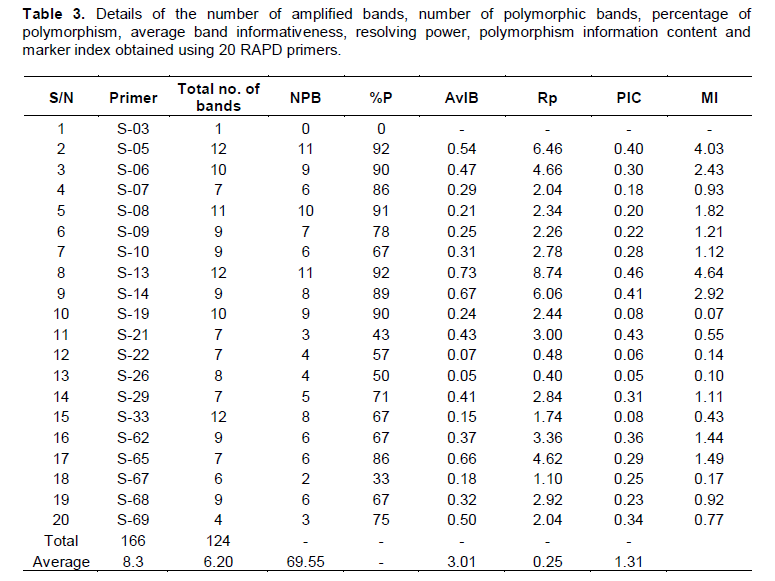
Amplification products of 38 banana cultivars with twenty random decamer primers yielded a total number of 166 scorable bands, out of which 124 were polymorphic. Average number of bands obtained per primer was 8.3 and average number of polymorphic bands per primer was 6.2. The size of the amplification products ranged from ~100 bp to ~1800bp. A single (Monomorphic) band was obtained with the primer S-03 while, highest number of bands (12) was obtained with primers S-33, S-05 and S-13. The percentage of polymorphism obtained with the twenty random decamer primers ranged from 0% to a maximum of 92% with an average of 69.55%. Primer S-05 and S-13 revealed the highest polymorphism (92%), while the primer S-67 exhibited the lowest (33%). Eight out of twenty primers showed more than 80% polymorphism when amplified with the total genomic DNA of 38 banana cultivars. The twenty polymorphic primers exhibited variations with regard to their average band informativeness (AvIB) and resolving power (Rp) (Table 3).

Genetic similarity
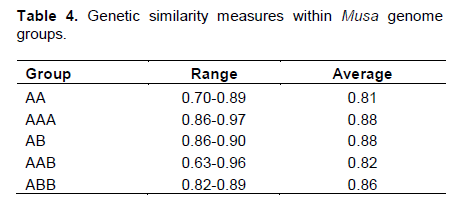
A fairly wide range of Dice similarity coefficient from 0.46 to 0.97 with an average of 0.69 was observed among the 38 banana cultivars when analysed using the 20 primers. The highest value of Dice similarity coefficient (0.97) was observed between the cultivars Grandnaine (AAA) and Dwarf Cavendish (AAA). The lowest similarity coefficient value (0.46) was observed between the cultivars Boothibale (ABB) and Dwarf Cavendish (AAA). Dice similarity coefficient showed considerable range of variation among the cultivars of within each genome group (Table 4). AA and AAB groups were found to be most diverse with an average similarity coefficient of 0.81 and 0.82, respectively.
Cluster analysis and principal co-ordinate analysis
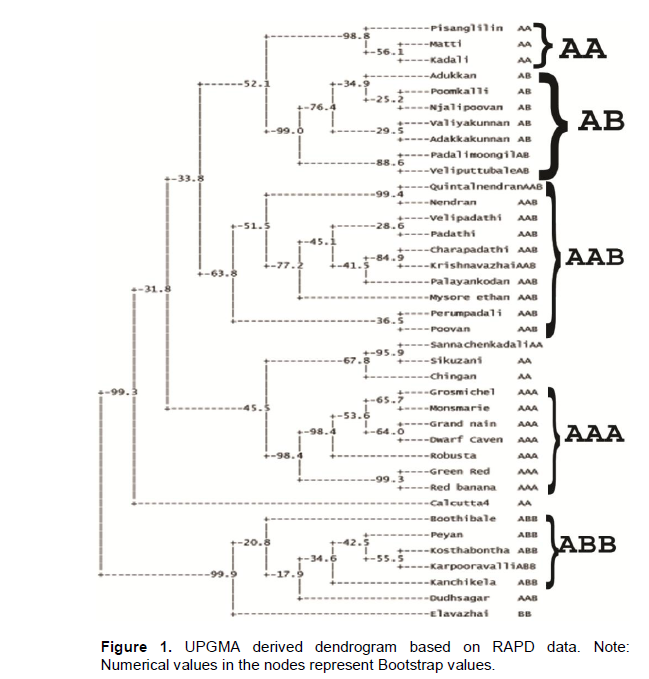
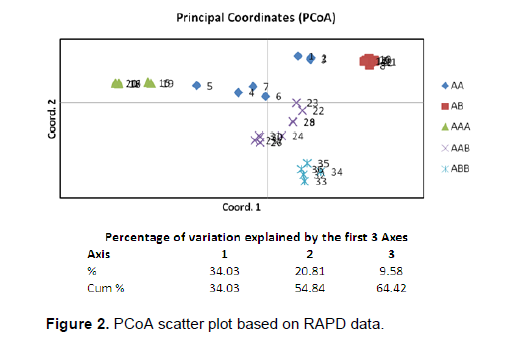
An apparently trustworthy separation was observed between the ABB/BB group (and AAB Dudhsagar) and the AA/AAA/AB/AAB cultivars in the dendrogram (Figure 1). Within the A/AB/AAB cluster there are a few clear clusters like all AB cultivars and all AAA cultivars with each cluster having more than 90% bootstrap values. The wild diploid Calcutta 4 (AA) remained as an out-group and was separated from rest of the cultivars. The results of the PCO analysis were comparable to the cluster analysis (Figure 2). The first three most informative principal components explained 64.42% of the total variation.
Population structure and AMOVA
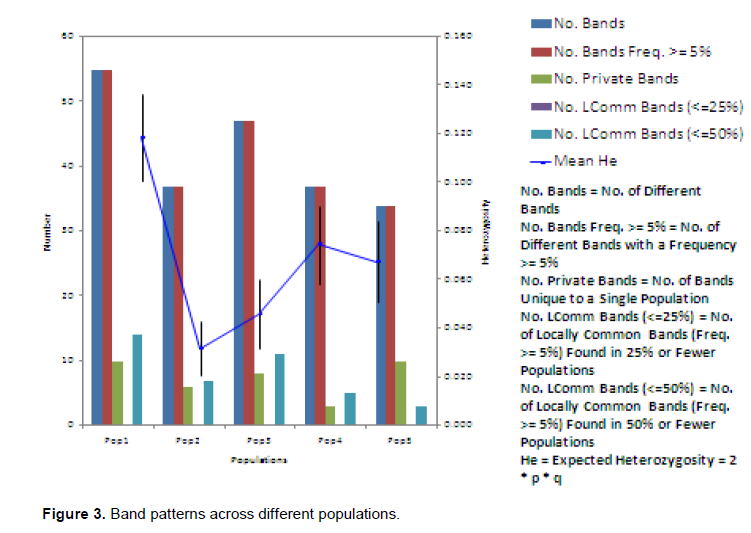
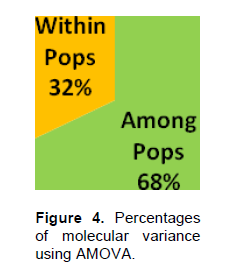
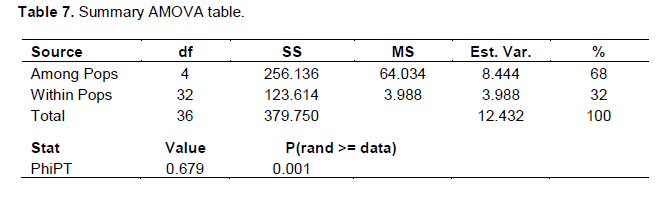
The Nei (1973) gene diversity (h) was observed in the range 0.03 to 0.12 among different Musa genome groups (Table 5). AA genome group was found to be most diverse in terms of mean expected heterozygosity (Figure 3) followed by AAB group. Number of observed alleles (na), number of effective alleles (ne), Shannon’s information index (I) were also highest in AA group followed by AAB group (Table 5). The coefficient of genetic differentiation (GST) was found to be 0.69 among the thirty-eight Musa cultivars showing a high level of overall population differentiation. The level of gene flow (Nm), which refers to the number of individuals entering into the population in a generation was found to be 0.23 (Table 6). Analysis of Molecular Variance (AMOVA) showed that largest proportion of genetic variation among the populations (68%) than within populations (32%) (Figure 4). The PhiPT value 0.679 (p<0.05) indicated a significant genetic variance between different genome groups (Table 7).


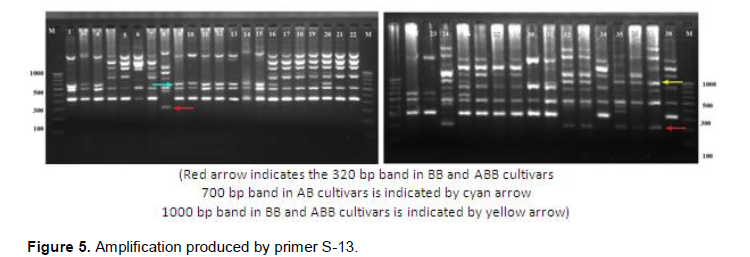
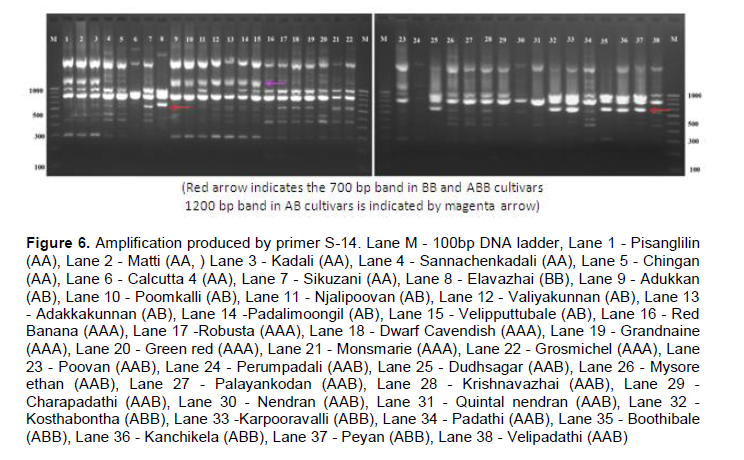
RAPD amplification pattern among different Musa genome groups
RAPD markers showed distinct amplification pattern in different Musa genome groups. The primer S-13 has amplified a ~400bp band in all cultivars except BB (lane 8) and ABB (lane 32, 33, 35, 36, 37) group of cultivars (Figure 5). However, a band of ~320 bp size was amplified by the same primer in all ABB and BB cultivars which was absent in rest of the cultivars. A band of size ~1000 bp was found common in cultivars of BB and ABB genome constitution. Primer S-14 produced a band of ~700 bp size common in BB and ABB cultivars (Figure 6).
Assessment of genetic diversity represents essential tools for germplasm management and plant breeding efforts. Accurate and rapid genotype identification is especially important in vegetatively propagated plant species, such as bananas and plantains. Among the numerous molecular markers available, the random amplified polymorphic DNA (RAPD) technique has been successfully used to investigate the clonal diversity in many plant species (Auge et al., 2001; Persson and Gustavsson, 2001; Debnath, 2007). The use of dominant markers to assess genetic variability between individuals and populations is promising because many polymorphic loci can be obtained fairly easily in a relatively short period and at low cost, without any prior knowledge of the genome of the species under study (Nybom and Bartish, 2000; Nybom, 2004).
RAPD is a useful and efficient tool to detect the genetic variability and the results are comparable with other markers (Ma et al., 2012). RAPD polymorphisms can theoretically result from insertion of a large piece of DNA between the primer binding sites, resulting in fragment loss; insertion or deletion of a small piece of DNA which lead to a change in size of the amplified fragment; deletion of one of the two primer annealing sites resulting in either the loss of a fragment or an increase in size; a nucleotide substitution within one or both primer target sites affecting the annealing process, which can lead to a presence versus absence polymorphism or to a change in fragment size. Polymorphisms between individuals mainly result from sequence differences in one or both of the primer binding sites and are visible as the presence or absence of a particular amplification product. These polymorphisms behave, therefore, as dominant genetic markers (Sperisen and Bucher, 1998).
In the present study, RAPD markers revealed prevalence of high genetic diversity among South Indian Musa cultivars as reported previously (Bhat and Jarret, 1995; Uma et al., 2006). Bhat et al. (1995) obtained 605 polymorphic bands in 57 Indian banana cultivars using 49 RAPD primers. Uma et al. (2006) reported 74.6% polymorphism among Indian wild M. balbisiana (BB) population using 4 RAPD primers with an average of 7.75 polymorphic bands per primer. Brown et al. (2009) observed 83% polymorphism in Mauritian Musa germplasm using 15 RAPD primers producing 6.9 polymorphic bands per primer. Use of IRAP markers revealed 96.12% polymorphism among 25 Musa genotypes from North-east India (Singh et al., 2014). 97.25% polymorphism was revealed in Aconitum species when amplified with 15 RAPD primers (Zhao et al., 2015). Similarly 94.22% polymorphism was observed among 45 genotypes of common bean when amplified using 19 RAPD primers (Bukhari et al., 2015).
In the present study, genetic diversity estimates calculated by means of Dice similarity coefficient ranged from 0.46 to 0.97 with an average of 0.69. Presence of high genetic diversity among the cultivars studied support the view that India is one of the secondary centers of diversity for bananas and plantains (Simmonds, 1962). The appearance of polymorphism in a given population is often due to existence of genetic variants represented by the number of alleles at alocus and their frequency of distribution in the population (Bhattacharya et al., 2010). Bhat et al. (2004) suggested that high diversity in banana germplasm may be due to the vegetative mode of propagation. According to him, as somatic mutations accumulated, novel types were emerged through bud sports. High genetic diversity has also been reported in East African highland bananas and Mauritian bananas (Pillay et al., 2001; Brown et al., 2009). Bhat et al. (2004) also suggested highly broadened genetic base for Indian plantains as opposed to highly narrow genetic base of African plantains (Crouch et al., 2000).
Genetic variation is non-randomly distributed among populations, species and higher taxa (Hamrick et al., 1979). Estimation of genetic diversity parameters such as percentage of polymorphic loci and gene diversity index provide a measure of genetic richness of the taxa. Genetic diversity within populations is considered to be of high importance for adaptation to changing environments and as a consequence, for a long term survival of a species. Genetically uniform populations are more vulnerable to diseases and pathogens and are more likely to get extinct by the spread of a single devastating disease. Populations that have a narrower range of genotypes may also simply fail to survive at climatic extremes such as heat, cold, drought, salinity etc. Nei’s (1973) genetic diversity (h) is considered as an important parameter for genetic distance between sub populations and is a common indicator in population genetics (Arora et al., 2014). Among different Musa genome groups analyzed during the present study, AA was found to be most diverse followed by AAB. In the present study, significant level of genetic differentiation of populations has been inferred by the PhiPT value, 0.679 (Phi>0.2 means populations are significantly different), gene diversity (h=0.21) and Shannon’s information index (I=0.34).
Culley et al. (2002) explained that coefficient of gene differentiation (Gst), is an important indicator of proportion of variation among populations and is directly proportional to the amount of variation among them. Among South Indian banana cultivars analyzed during present study, higher coefficient of genetic differentiation (Gst=0.69) depicts that 69% of the variability is present among the populations and 31% of variation lies within the populations. Whereas, among 25 Musa genotypes from North east India, higher proportion of genetic variation was found within population as indicated by a Gst value of 0.451 (Lamare and Rao, 2015). An average Gst value of 0.4358 was noticed in Aconitum populations from China (Zhao et al., 2015). However, very small degree of genetic differentiation was observed among Colombian mango populations with a Gst value of 0.0532 (Díaz-Matallana et al., 2009). The results of AMOVA were also found comparable to Gst in the present study, depicting that the variability was prominently conserved among the populations (68%) in comparison within the subpopulations (32%). AMOVA analysis in Indian wheat varieties revealed that genetic diversity (78.5%) is mainly contained within the populations (Arora et al., 2014). Wild soybean (Glycine soja) populations from China also revealed 43.92% of molecular variance occurred within populations (Guo et al., 2012). This can be reasoned that the studied populations might encompass more of the available genetic diversity of the natural population. High level of variability among populations can be explained by the low value of gene flow (Nm=0.23). As a general indicator of the magnitude of genetic exchange, level of differentiation among populations is inversely proportional to the value of gene flow. Genetic differentiation among populations with Nm<1.0 may result from limited gene flow due to high selective pressure or discontinuous distribution conditions (Slatkin, 1987).
In the present study, diploid AA group showed highest genetic diversity in terms of Nei’s expected heterozygosity and Shannon’s index while diploid AB group was least diverse. Observed number of alleles (Na) and effective number of alleles (Ne) were also highest in AA group and least in AB group. Resmi et al. (2011) reported similar results in the same set of genotypes employing STMS markers. Lougheed et al. (2000) emphasized that both microsatellites and RAPDs can be successfully employed in assays of genetic differentiations over relatively larger geographic scales and may give comparable results. The high level of genetic diversity detected in AA diploid cultivars might derived from their putative inter sub-specific hybrid origin, with limited fertility due to heterozygosity for chromosome structural abnormalities, maintained by vegetative propagation (Creste et al., 2003). Grapin et al. (1998) reported that most cultivated diploids are heterozygous for most of the microsatellite loci. Somatic mutation that accumulates genetic variation within clonally persisting clumps may account for some of the heterozygosity (Ge et al., 2005).
UPGMA derived dendrogram based on the Dice similarity matrix for RAPD markers revealed four major clusters which grouped cultivars of AB, AAB, AAA and ABB genomic groups separately. In the present study, cultivars of AA group were associated with AB and AAA cluster. Earlier studies also reported that diploid AA cultivars could not be conclusively resolved from triploid AAA clones (Brown et al., 2009). Variation within the M. acuminata subspecies complex may account for the rather wide separation of the fertile diploids from their cultivated AAA relatives. Calcutta 4 (AA) was found to be separated from rest of the cultivars in the dendrogram. The wide separation of the wild diploid AA types from the cultivated triploids may be due to the effects of repeated selection/mutation among the cultivated clones that has resulted in a cultivated M. acuminata genome that is significantly different from its ancestral diploid progenitors (Bhat and Jarret, 1995). Present study observed specific RAPD amplification pattern among different Musa genome groups which can be attributed to the respective genome contributions from the parental species. Pillay et al. (2000) identified PCR markers specific to the A and B genomes in Musa. Nair et al. (2005) also observed a remarkably distinct restriction pattern in ABB genomic groups from AAB group using IRAP primers. Results of the present study suggests that RAPD markers can be employed for distinguishing Musa genome groups even in an early phase of vegetative growth over morphological classification which could be done only in a later stage of flowering and fruiting. Present results would also provide an insight towards the genetic relationships of different South Indian Musa cultivars, ultimately help in in situ conservation and Musa breeding programs.
The author(s) have not declared any conflict of interests.
The first author is thankful to the University Grants Commission, New Delhi for the UGC Research Award 2012-’14 (No. F.30-1/2013(SA-II))/RA 2012-14).
REFERENCES
|
Albert T, Raspe O, Jacquemart AL (2003). Clonal structure in Vaccinium myrtillus L. revealed by RAPD and AFLP markers. Int. J. Plant Sci. 164:649-655.
Crossref
|
|
|
|
Arora A, Kundu S, Dilbaghi N, Sharma I, Tiwari R (2014). Population structure and genetic diversity among Indian wheat varieties using microsatellite (SSR) markers. Aust. J. Crop Sci. 8(9):1281-1289.
|
|
|
|
|
Auge H, Neuffer B, Erlinghagen F, Grupe R, Brandl R (2001). Demographic and random amplified polymorphic DNA analyses reveal high levels of genetic diversity in a clonal violet. Mol. Ecol. 10:1811–1819.
Crossref
|
|
|
|
|
Bhat KV, Jarret RL (1995). Random amplified polymorphic DNA and genetic diversity in Indian Musa germplasm. Genet. Resour. Crop Evol. 42:107-118.
Crossref
|
|
|
|
|
Bhat KV, Bhat SR, Chandel KPS, Lakhanpaul S, Ali S (1995). DNA fingerprinting of Musa cultivars with oligodeoxyribonucleotide probes specific for simple repeat motifs. Genetic analysis: Biomol. Eng. 12:45-51.
|
|
|
|
|
Bhattacharya S, Bandhopadhyay TK, Gosh PD (2010). Efficiency of RAPD and ISSR markers in assessment of molecular diversity in elite germplasms of Cymbopogon winterianus across West Bengal, India. Emir. J. Food Agric. 221:13-24.
Crossref
|
|
|
|
|
Brown N, Venkatasamy S, Khittoo G, Bahorun T, Jawaheer S (2009). Evaluation of genetic diversity between 27 banana cultivars (Musa spp.) in Mauritius using RAPD markers. Afr. J. Biotechnol. 8(9):1834-1840.
|
|
|
|
|
Brunk CF, Jones KC, James TW (1979). Assay for nanogram quantities of DNA in cellular homogenates. Anal. Biochem. 92:497-500.
Crossref
|
|
|
|
|
Creste S, Neto AT, Silva SO, Figueira A (2003). Genetic characterization of banana cultivars (Musa spp.) from Brazil using microsatellite markers. Euphytica 132:259-268.
Crossref
|
|
|
|
|
Culley TMM., Wallace LE, Gengler-Nowak KM, Crawford DJ (2002). A comparison of two methods of calculating GST, a genetic measure of population differentiation. Am. J. Bot. 89:460-465.
Crossref
|
|
|
|
|
Debnath SC (2007). An assessment of the genetic diversity within a collection of wild cranberry (Vaccinium macrocarpon Ait.) clones with Resmi et al. 11 RAPD-PCR. Genet. Resour. Crop Evol. 54:509-517.
Crossref
|
|
|
|
|
Díaz-Matallana M, Schuler-García I, Ruiz-García M, Hodson de JE (2009). Analysis of diversity among six populations of Colombian mango (Mangifera indica L. cvar. Hilacha) using RAPDs markers. Electronic J. Biotechnol. 12(3): 1-2.
|
|
|
|
|
Excoffier L, Smouse PE, Quattro JM (1992). Analysis of molecular variance inferred from metric distances among DNA haplotypes: application to human mitochondrial DNA restriction data. Genetics 131:479-491.
|
|
|
|
|
Ge XJ, Liu MH, Wang WK, Schaal BA, Chiang TY (2005). Population structure of wild bananas, Musa balbisiana, in China determined by SSR fingerprinting and cpDNA PCR-RFLP. Mol. Ecol. 14:933-944.
Crossref
|
|
|
|
|
Grapin A, Noyer JL, Carreel F, Dambier D, Baurens FC, Lanaud C, Lagoda PJL (1998). Diploid Musa acuminata genetic diversity assayed with sequence tagged microsatellite sites. Electrophoresis. 19:1374-1380.
Crossref
|
|
|
|
|
Guo J, Liu Y, Wang Y, Chen J, Li Y, Huang H, Qui L, Wang Y (2012). Population structure of the wild soybean (Glycine soja) in China: implications from microsatellite analyses. Ann. Bot. 110:777-785.
Crossref
|
|
|
|
|
Hamrick JL, Linhart YB, Mitton JB (1979). Relationships between life history characteristics and electrophoretically-detectable genetic variation in plants. Ann. Rev. Ecol. Syst. 10:173-200.
Crossref
|
|
|
|
|
Irwin SV, Kaufusi P, Banks K, Pena dela R, Cho J J (1998). Molecular characterization of taro (Colocasia esculenta) using RAPD markers. Euphytica. 99:183-189.
Crossref
|
|
|
|
|
Kjolner S, Sastad SM, Taberlet P, Brochmann C (2004). Amplified fragment length polymorphism versus random amplified polymorphic DNA markers: clonal diversity in Saxifraga cernua. Mol. Ecol. 13:81-86.
Crossref
|
|
|
|
|
Lamare A, Rao SR (2015). Efficacy of RAPD, ISSR and DAMD markers in assessment of genetic variability and population structure of wild Musa acuminata Colla. Physiol. Mo. Bio. Plants.
Crossref
|
|
|
|
|
Lougheed SC, Gibbs HL, Prior KA, Weatherhead PJ (2000). A comparison of RAPD versus microsatellite DNA markers in population studies of the Massasanga Rattlesnake. Am. Genet. Assoc. 91:458-463.
|
|
|
|
|
Ma X, Chen SY, Bai SQ, Zhang XQ, Li DX, Zhang CB, Yan JJ (2012). RAPD analysis of genetic diversity and population structure of Elymus sibiricus (Poaceae) native to the southeastern Qinghai-Tibet Plateau, China. Genet. Mol. Res. 11(3):2708-2718.
Crossref
|
|
|
|
|
Milbourne D, Meyer R, Bradshaw J, Baird E, Bonar N, Provan J, Powell W, Waught R (1997). Comparison of PCR based marker systems for the analysis of genetic relationships in potato. Mol. Breed. 3:127-136.
Crossref
|
|
|
|
|
Mukunthakumar S, Padmesh P, Vineesh PS, Skaria R, Kumar KH, Krishnan PN (2013). Genetic diversity and differentiation analysis among wild antecedents of banana (Musa acuminata Colla) using RAPD markers. Indian J. Biotechnol. 12:493-498.
|
|
|
|
|
Nair AS, Teo CH, Scwarzacher T, Harrison HP (2005). Genome classification of banana cultivars from South India using IRAP markers. Euphytica. 144:285-290.
Crossref
|
|
|
|
|
Nei M (1973). Analysis of gene diversity in subdivided populations. Proc. Natl. Acad. Sci. (USA). 70:3321-3323.
Crossref
|
|
|
|
|
Nybom H (2004). Comparison of different nuclear DNA markers for estimating intraspecific genetic diversity in plants. Mol. Ecol. 13(5):1143-1155.
Crossref
|
|
|
|
|
Nybom H, Bartish IV (2000). Effects of life history traits and sampling strategies on genetic diversity estimates obtained with RAPD markers in plants. Perspect. Plant Ecol. Evol. Syst. 3:93-114.
Crossref
|
|
|
|
|
Peakall R, Smouse PE (2012). GenAlex 6.5: Genetic analysis in Excel. Population genetic software for teaching and research-an update. Bioinformatics 28(9):2537-2539.
Crossref
|
|
|
|
|
Persson HA, Gustavsson BA (2001). The extent of clonality and genetic diversity in lingonberry (Vaccinium vitisidaea L.) revealed by RAPDs and leaf-shape analysis. Mol. Ecol. 10:1385–1397.
Crossref
|
|
|
|
|
Pillay M, Nwakanma DC, Tenkouano A (2000). Identification of RAPD markers linked to A and B genome sequences in Musa L. Genome. 43:763-767.
Crossref
|
|
|
|
|
Powell W, Morgante M, Andre C, Hanafey M, Vogel J, Tingry S, Rafalski A (1996). The comparison of RFLP, RAPD, AFLP and SSR (microsatellite) markers for germplasm analysis. Mol. Breed. 2:225-238.
Crossref
|
|
|
|
|
Prevost A, Wilkinson MJ (1999). A new system for comparing PCR primers applied to ISSR fingerprinting of potato cultivars. Theor. Appl. Genet. 98:107-112.
Crossref
|
|
|
|
|
Resmi L, Ratna Kumari, Bhat KV, Nair AS (2011). Molecular characterization of genetic diversity and structure in South Indian Musa cultivars. Int. J. Bot. 7(4):274-282.
Crossref
|
|
|
|
|
Roldan-Ruiz I, Dendauw J, VanBockstaele E, Depicker A, De Loose M (2000). AFLP markers reveal high polymorphic rates in rye grasses (Lollium spp.). Mol. Breeding. 6:125-134.
Crossref
|
|
|
|
|
Saghai-Maroof MA, Soliman KM, Jorgensen RA, Allard RW (1984). Ribosomal DNA spacer-length polymorphisms in barley: mendelian inheritance, chromosomal locations and population dynamics. Proc. Natl. Acad. Sci. USA. 81:8014-8018.
Crossref
|
|
|
|
|
Salem KFM, El-Zanaty AM, Esmail RM (2008). Assessing wheat (Triticum aestivum L.) genetic diversity using morphological characters and microsatellite markers. World J. Agric. Sci. 4(5):538-544.
|
|
|
|
|
Simmonds NW (1962). The evolution of the bananas. Longman, London.
|
|
|
|
|
Simmonds NW (1995). Bananas. In: Evolution of crop plants. Smartt, J. and Simmonds, N. W. (eds.). Longman, Essex, pp. 370-375.
|
|
|
|
|
Simmonds NW, Shepherd K (1955). The taxonomy and origin of the cultivated bananas. J. Linn. Soc. Bot. 55:302-312.
Crossref
|
|
|
|
|
Singh WA, Singh NS, Handique PJ, Devi HS (2014). Morpho-taxonomical and molecular assessment of musa genotypes from North east India by morphological and inter-retrotransposon amplified polymorphism markers. Plant Syst Evol. 301(2):563-575. DOI 10.1007/s00606-014-1094-9.
Crossref
|
|
|
|
|
Slatkin M (1987). Gene flow and the geographic structure of populations. Science 236:787-792.
Crossref
|
|
|
|
|
Sperisen C, Bucher U (1998). Cloning of random amplified polymorphic DNA (RAPD) to generate codominant genetic marker. In: Molecular Tools for Screening Biodiversity. Karp, A., Issac, P. G. and Ingram, D. S.(eds.). Chapman & Hall, London, pp. 217-222.
Crossref
|
|
|
|
|
Uma S, Siva SA, Saraswathi MS, Manickavasagam M, Durai P, Selvarajan R, Sathiamoorthy S (2006). Variation and interspecific relationships in Indian wild Musa balbisiana (BB) population as evidenced by random amplified polymorphic DNA. Genet. Resour. Crop Evol. 53:349-355.
Crossref
|
|
|
|
|
Uma S, Sathiamoorthy S (2002). Names and synonyms of bananas and Plantains in India. NRC for Banana, Tiruchirapalli, India.
|
|
|
|
|
Williams JGK, Kubelik AR, Livak KJ, Rafalski JA, Tingey SV (1990). DNA polymorphisms amplified by arbitrary primers are useful as genetic markers. Nucl. Acids Res.18:6531-6535.
Crossref
|
|
|
|
|
Yap IV, Nelson RJ (1996). WinBoot: A program for performing bootstrap analysis of binary data to determine the confidence limits of UPGMA based dendrograms. International Rice Research Institute (IRRI), Manila. P. 22.
|
|
|
|
|
Yeh FC, Yang RC, Boyle TBJ, Ye ZH, Mao JX (2000). POPGENE 32, Microsoft windows based software for population genetic analysis (version 1.32). Alberta, Canada: Molecular biology and Biotechnology Centre, University of Alberta, Edmonton, Canada.
|
|
|
|
|
Zhao F, Nie J, Chen M, Wu G (2015). Assessment of genetic characteristics of Aconitum germplasms in Xinjiang Province (China) by RAPD and ISSR markers. Biotechnol. Biotechnol. Equip. 29(2):309-314.
Crossref
|
|